Agricultural Adaptation Strategies Impact on West Africa Food Security

This document examines the impact of agricultural adaptation strategies on food security in West Africa. It analyzes household survey data from 200 households in 3 sites to define 4 household types based on their food security status, asset levels, and market orientation. It finds that adoption of strategies like soil conservation, agroforestry, livestock and crop diversity can improve food security for some household types but not others. Specifically, households that intensified their practices and had larger land areas per capita saw greater improvements in food security and land productivity. The strategies households use depend on their type, with more food-secure households relying on high-value crop production and diversified income sources.
Recommended

Recommended
More Related Content
What's hot
What's hot (20)
Viewers also liked
Viewers also liked (7)
Similar to Agricultural Adaptation Strategies Impact on West Africa Food Security
Similar to Agricultural Adaptation Strategies Impact on West Africa Food Security (20)
More from ILRI
More from ILRI (20)
Recently uploaded
Recently uploaded (20)
Agricultural Adaptation Strategies Impact on West Africa Food Security
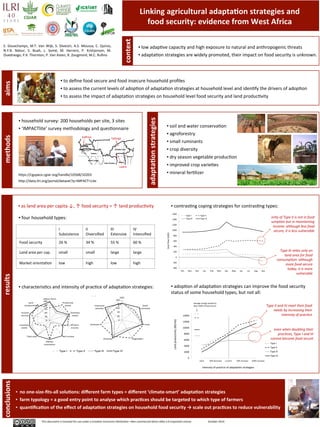
- 1. Linking agricultural adapta/on strategies and food security: evidence from West Africa ▪ low adapOve capacity and high exposure to natural and anthropogenic threats ▪ adaptaOon strategies are widely promoted, their impact on food security is unknown. ▪ to define food secure and food insecure household profiles ▪ to assess the current levels of adopOon of adaptaOon strategies at household level and idenOfy the drivers of adopOon ▪ to assess the impact of adaptaOon strategies on household level food security and land producOvity Priority of Type II is not in food consump3on but in maintaining income: although less food secure, it is less vulnerable S. Douxchamps, M.T. Van Wijk, S. Silvestri, A.S. Moussa, C. Quiros, N.Y.B. Ndour, S. Buah, L. Somé, M. Herrero, P. Kristjanson, M. Ouedraogo, P.K. Thornton, P. Van Asten, R. Zougmoré, M.C. Rufino aims methods results (b) (c) ▪ Labour force 100 80 Productive assets 60 40 Domestic 20 assets Off farm income Net income conclusions I Subsistence II Diversified Food security 26 % 34 % 55 % 60 % Land area per cap. small small large large Market orientaOon low high low high characterisOcs and intensity of pracOce of adaptaOon strategies: (b) (c) (a) (b) (c) Land productivity Improved varieties Income sources Type I Type II Type III Type IV Labour force 100 80 60 40 20 0 SWC Improved varieties Productive assets Small ruminants Domestic assets Trees 100 80 60 40 20 0 Off farm income Net income Livestock assets Total area Diversity Vegetables Fertilizers Market orientation Type I Type II Type III Type IV III Extensive SWC 100 100 80 80 60 60 40 40 20 0 SWC IV Intensified Improved varieties Small ruminants Small ruminants Trees Improved varieties 20 0 Trees Diversity Vegetables Improved varieties Type I Type II Type III Type IV Fertilizers 1600 1400 1200 1000 800 600 400 200 0 -‐200 ▪ adopOon of adaptaOon strategies can improve the food security status of some household types, but not all: 14000 12000 10000 8000 100 80 60 Improved varieties Diversity Vegetables 6000 4000 2000 0 Small ruminants Trees 0.0 0.5 1.0 1.5 2.0 100 80 60 40 SWC 14000 20 0 12000 Energy produced (Mj/ha) Intensity of CAS practices Type II and IV meet their food needs by increasing their Type I Type II Type III Type IV none 50% decrease current 50% increase 100% increase 10000 8000 6000 4000 2000 0 0.0 0.5 1.0 1.5 2.0 Energy produced (Mj/ha) Intensity of CAS practices Type I Type II Type III Type IV average energy needed to have 100% of food secure Land productivity (MJ/ha) Intensity of practice of adaptation strategies adapta/on strategies ▪ soil and water conservaOon ▪ agroforestry ▪ small ruminants ▪ crop diversity ▪ dry season vegetable producOon ▪ improved crop varieOes ▪ mineral ferOlizer ▪ household survey: 200 households per site, 3 sites ▪ ‘IMPACTlite’ survey methodology and quesOonnaire ▪ four household types: Diversity Vegetables Fertilizers Type I Type II Type III Type IV 40 20 Fertilizers 100 80 60 40 20 ▪ no one-‐size-‐fits-‐all solu/ons: different farm types = different ‘climate-‐smart’ adapta/on strategies ▪ farm typology = a good entry point to analyse which prac/ces should be targeted to which type of farmers ▪ quan/fica/on of the effect of adapta/on strategies on household food security → scale out prac/ces to reduce vulnerability 0 Productive assets Domestic assets Off farm income Net income Market orientation Type I Type II Type III Type IV 0 SWC Small ruminants Trees Diversity Vegetables Fertilizers Type I Type II Type III Type IV 0 SWC Small ruminants Trees Diversity Vegetables Fertilizers intensity of prac3ce even when doubling their prac3ces, Type I and III cannot become food secure ▪ as land area per capita ↓, ↑ food security = ↑ land producOvity ▪ contrasOng coping strategies for contrasOng types: -‐400 Oct Nov Dec Jan Feb Mar Apr May Jun Jul Aug Sep Cash flow (USD) Type I Type II Type III Type IV staple crops harvest vegetables harvest Rainy season Dry season staple crops planting vegetables planting Type III relies only on land area for food consump3on: although more food secure today, it is more vulnerable heps://cgspace.cgiar.org/handle/10568/10203 hep://data.ilri.org/portal/dataset?q=IMPACT+Lite Yatenga Lawra Kaffrine context This document is licensed for use under a CreaOve Commons AeribuOon –Non commercial-‐Share Alike 3.0 Unported License October 2014