
Recommended
Recommended
More Related Content
What's hot
What's hot (17)
Similar to Adsorption of Methylene blue and Malachite Green in Aqueous Solution using Jack Fruit Leaf Ash as Low Cost Adsorbent
Similar to Adsorption of Methylene blue and Malachite Green in Aqueous Solution using Jack Fruit Leaf Ash as Low Cost Adsorbent (20)
Recently uploaded
Recently uploaded (20)
Adsorption of Methylene blue and Malachite Green in Aqueous Solution using Jack Fruit Leaf Ash as Low Cost Adsorbent
- 1. International Journal of Environment, Agriculture and Biotechnology (IJEAB) Vol-2, Issue-3, May-Jun- 2017 http://dx.doi.org/10.22161/ijeab/2.3.45 ISSN: 2456-1878 www.ijeab.com Page | 1369 Adsorption of Methylene blue and Malachite Green in Aqueous Solution using Jack Fruit Leaf Ash as Low Cost Adsorbent Soumitra Banerjee1 , Dr. Anupam Debsarkar2 , Dr. Siddhartha Datta3 1 Research Scholar, Department of Chemical Engineering, Jadavpur University, Kolkata, India 2 Department of Civil Engineering, Jadavpur University, Kolkata, India 3 Department of Chemical Engineering, Jadavpur University, Kolkata, India Abstract— The adsorption of mixture of two basic dyes methylene blue and malachite green in aqueous solution onto jack fruit leaf ash in a batch system with respect to initial dye concentrations, pH, contact time, shaker speed and adsorbent doses was investigated.. The pseudo-first- order and pseudo-second- order kinetics model were used to describe the kinetic data. The rate constants at different pH values (3-9.1) were evaluated. The experimental data fitted well with the pseudo-second- order kinetic model. Equilibrium isotherms were analyzed by Langmuir, Freundlich and Temkin isotherm models. Maximum adsorption capacity was 20.41mg/g was achieved by Langmuir isotherm model. Error analysis was done to find the best model that described the experimental data well and it was the Langmuir model. The result indicated that jack fruit leaf ash could be fruitfully employed as low cost adsorbent for the removal of mixture of two basic dyes MB and MG from the wastewater. Keywords— adsorption, isotherm, jack fruit leaf ash, kinetic model, methylene blue, malachite green. I. INTRODUCTION The textile and other dye using industries consume large amount of water for its different operational phases. The use of huge water for their production purposes, it is inhabitable that they discharge a huge volume of wastewater which is rich in color. Due to more and more increasingly stringent restrictions, it is essential to eliminate dye contamination from wastewater before discharging to the open environment. There are various techniques such as adsorption, chemical oxidation, filtration, coagulation etc. have been used to remove dye pollutants from the wastewater. Among these different methods for the removal of colors, it has been well established that adsorption is the most useful and effective technique to remove dyes from the wastewater. The advantages of adopting this technique in wastewater treatment is because of its simple operation, higher efficiency and ability to separate wide range of chemical compounds. The use of commercially available activated carbon is better choice but it involves huge cost, makes adsorption process infeasible. So in the recent years research is mainly focused on utilizing natural agricultural by products such as jack fruit leaf, neem leaf, rice husk, bagasse fly ash etc. available as abundant materials in rural Bengal. The use of such waste materials as low cost adsorbent is a typical attempt for this purpose. The basic dyes methylene blue and malachite green are one of the important and widely used dyes in textile and other dye using industries. In practice the wastewater from industries contain mixture of dyes. However, no literature is available since last 20 years to remove mixture of dyes from the wastewater. Both the dyes MB and MG are water soluble and very difficult to remove from the wastewater by simple removal technique. So the adsorptive removal of mixture of basic dyes using jack fruit leaf ash (JFLA) as low cost adsorbent is a typical attempt of the present work to solve the real life problem. The effects of adsorbent doses, contact time, pH, shaker speed and initial concentration of the solution dyes were investigated. The Langmuir, Freundlich and Temkin isotherms were used to fit the equilibrium data. Pseudo- first-order and Pseudo-second-order kinetic models were attempted. II. MATERIAL AND METHODS Adsorbent The raw jack fruit leaf was collected locally in the Jadavpur University campus. The dry leaves washed with distilled water several times and dried for 8 hrs. in the woven. The dried leaves then put into the muffle furnace at 6000 C to make it ash. The JFLA sieved through 300 µsieve to eliminate the finer portion, and finally the adsorbent was prepared for the experiment. Dyes The dyes were collected from the local market of Kolkata and their chemical structure was illustrated in the figure 1.
- 2. International Journal of Environment, Agriculture and Biotechnology (IJEAB) Vol-2, Issue-3, May-Jun- 2017 http://dx.doi.org/10.22161/ijeab/2.3.45 ISSN: 2456-1878 www.ijeab.com Page | 1370 Methylene Blue (MB) and Malachite Green (MG) are two cationic dyes. Two dyes of equal proportion was taken to prepare stock solution of 1000mg/L. The working solution was prepared by diluting the stock solution to give the appropriate concentrations. Methylene Blue Malachite Green Fig.1: Chemical structure of MB and MG Batch adsorption experiments All adsorption experiments were carried out by agitating the jack fruit leaf ash of required amount with 200 mL dye solution of different concentrations as required in a 250 mL bottle at constant room temperature in a shaker at 120 rpm except during varying shaker speed observation. The experiment was carried out for various JFLA dosage, initial concentrations, shaker speed and pH. At the end of the predetermined shaking time the samples were withdrawn and centrifuged at 5000 rpm for 10 minutes. The resulting supernatant was then analyzed using spectrophotometer. The amount of adsorption at equilibrium, qe (mg/g), was computed as follows: 𝑞 𝑒 = (𝐶0 − 𝐶𝑒)𝑉 𝑚 𝑠 − − − − − − − −(1) where, C0 and Ce are the initial and equilibrium solution concentrations (mg/L) respectively, V is the volume of the solution (L), and ms is the weight of JFLA used (g). In the experiments of batch kinetic adsorption, 200 mL of the chosen desired concentration of the stock solution of two dyes in mixture (1:1) were placed in the measuring bottle of 250 mL together with 5 gm JFLA and agitated by shaker at room temperature (300 C) and at normal pH. At predicted intervals of times, samples were taken, and their concentrations were determined by spectrophotometer. III. RESULTS AND DISCUSSION 3.1 Effect of adsorbent dosage The effect of JFLA dosage on the amount of dyes adsorbed was investigated by containing 200mL of dye solution with initial concentration of each dyes 12.5mg/L, mixing equally (1:1) to make 25mg/L at room temperature 300 C at 120 rpm. Different amount of JFLA (0.1 to 12 gm) for methylene blue and malachite green were applied. The result showed that when the adsorbent dosage increased from 0.1 gm to 5gm the removal of two dyes increased from 15.83 to 90.49% and then reached a plateau. It is reported that the larger adsorption surface caused higher adsorption of dyes. Therefore, for convenience the adsorbent dosage for the present study was selected as 5 gm as equilibrium dosage. The plot of dye removal (%) versus adsorbent dosage (g/L) is shown in the fig.2. Fig.2: Effect of adsorbent dosage on adsorption onto JFLA 3.2 Effect of contact time The effect of contact time for adsorption of mixed dye solution MB and MG onto JFLA was shown in the fig.3. The adsorbent dose was taken as 5gm, initial concentrations of mixed dye solution as 25mg/L, shaker speed as 120 rpm. The experiment was done for 6 hrs. It can be seen that the rate of adsorption under various fixed other operating conditions, the percentage removal increased rapidly for initial 10 to 165 mins and beyond that contact time no noticeable change in the percentage removal was observed. As the equilibrium time is also function of initial dye concentration, 165 min is sufficient to reach equilibrium study. The percentage removal at 165 min was noticed as 95.72%, and considered to be the optimal contact time for the adsorption study. Fig.3: Effect of contact time on adsorption onto JFLA 3.3 Effect of initial dye concentrations The influence of varying the initial concentrations of mixed dyes was assessed (Fig.4).The percentage removal 0 50 100 0 20 40 60 80 % r e m o v a l Adfsorbent dose, gm/l Natural pH Shaker speed = 120 rpm Contact Time 3 hrs. Initial dye concenttration 25 mg/l 0 50 100 150 0 100 200 300 400 % r e m o v a l Contact time (min) Natural pH Shaker speed = 120 rpm Adsorbent dose = 25mg Initial concentration od dyes = 25mg/l
- 3. International Journal of Environment, Agriculture and Biotechnology (IJEAB) Vol-2, Issue-3, May-Jun- 2017 http://dx.doi.org/10.22161/ijeab/2.3.45 ISSN: 2456-1878 www.ijeab.com Page | 1371 at initial concentration 25mg/L was 88.53% and that decreased to 58.25% at concentration of 150mg/L, under fixed other operating conditions. It can be concluded that the percentage removal is decreased by increasing the initial concentrations of dye mixture. Fig.4: Effect of initial dye concentration on adsorption onto JFLA 3.4 Effect of shaker speed The effect of shaker speed on the percentage removal of dye mixture was studied (fig. 5) under the various other fixed operating conditions. It can be seen that percentage removal increased initially 96.28 to 98.46 as the shaker speed increased from 30 to 120 rpm and beyond that it reached a constant value. Fig.5: Effect of shaker speed on adsorption onto JFLA 3.5 Effect of pH of the initial solution of dyes The effect of initial pH on the adsorption of mixed dyes MB and MG onto JFLA is shown in the figure 6.As these two are cationic dyes, adsorbed onto the JFLA effectively at higher pH. The removal efficiency increased from 94.87 to 99.18 % as the pH of the solution increased from 3.0 to 9.1. Fig.6: Effect of initial pH on adsorption onto JFLA 3.6 Adsorption kinetics The mechanism of solute sorption onto a sorbent can be expressed by different kinetic models. To explore the fast and effective model the different parameters of adsorption mechanism such as chemical reaction, diffusion control and mass transfer to be evaluated by these kinetic model equations. 3.6.1 Pseudo-first-order equation Pseudo-first-order equation is generally represented as 𝑑𝑞𝑡 𝑑𝑡 = 𝑘1(𝑞 𝑒 − 𝑞𝑡) − − − − − − − − − (1) where qe is the amount of dye adsorbed at equilibrium, qt the amount of dye adsorbed at time t and k1 is the equilibrium rate constant of pseudo-first-order kinetics. Integrating the equation (1), applying boundary condition qt=0 at t=0 and qt= qt at t=t, it becomes log(𝑞 𝑒 − 𝑞𝑡) = 𝑙𝑜𝑔(𝑞 𝑒) − 𝑘1 2.303 𝑡 − − − − − − − − − −(2) From the straight line plots of log(qe-qt) versus t for the adsorption of mixture of two dyes MB and MG onto JFLA at different pH (3.0 to 9.1), the rate parameters were evaluated. Values of K1, qe and correlation coefficient (R2 ) were given in the Table-1. 3.6.2 Pseudo-second-order equation The Ho and Makay’s pseudo-second-order chemi- sorption kinetic rate equation is expressed as 𝑑𝑞𝑡 𝑑𝑡 = 𝑘2(𝑞 𝑒 − 𝑞𝑡) − − − − − − − − − (3) where, qe and qt are the amount of dye adsorbed at equilibrium and any time t respectively. K2 is the rate constant of pseudo-second-order model. Integrating the equation (3) we get 𝑡 𝑞𝑡 = 1 𝑘2 𝑞 𝑒 2 + 1 𝑞 𝑒 𝑡 − − − − − − − − − − − −(4) From the plot of t/qt versus t, under different pH values the constant were evaluated and was given in the Table-1. 0 50 100 0 2 4 6 8 % r e m o v a l Concentration (mg/L) Natural pH Shaker speed 120 rpm Initial Conc. 25 mg/L 92 93 94 95 96 97 98 99 0 50 100 150 % r e m o v a l Shaker speed(r.p.m.) Natural pH Contact time = 190 min. Adsorbent dose =25gm/L Adsorbate= 20gm/L 94 95 96 97 98 99 100 0 5 10 % r e m o v a l pH Shaker speed= 120rpm Contact time= 165min Adsorbent dose= 5gm Initial conc.= 25mg/L
- 4. International Journal of Environment, Agriculture and Biotechnology (IJEAB) Vol-2, Issue-3, May-Jun- 2017 http://dx.doi.org/10.22161/ijeab/2.3.45 ISSN: 2456-1878 www.ijeab.com Page | 1372 Table 1: Constants of pseudo-first-order and pseudo- second-order model pseudo-first-order model pseudo-second-order model K1 qe R2 K2 qe R2 0.037 1.49 0.629 0.474 1.58 0.999 From the above table, adsorption kinetics of dye mixture was studied and the rates of sorption were found to be confirmed to pseudo-second-order kinetics with good correlation coefficient value. 3.7 Adsorption isotherm Design optimization of an adsorption system for the adsorption of adsorbate appropriate correlation for the equilibrium curve is very important. Langmuir, Freundlich and Temkin isotherm were tested in the present investigation. 3.7.1 Langmuir isotherm In this theory the basic assumption is that the sorption takes place at specific homogeneous sites within the adsorbent. The equation can be written as 𝑞 𝑒 = 𝑄 𝑚 𝐾𝐿 𝐶𝑒 1 + 𝐾𝐿 𝐶𝑒 − − − − − − − − − (5) where, qe is the amount of dye adsorbed onto JFLA at equilibrium concentration of solution dyes, KL the equilibrium constant and Qm is the maximum adsorption capacity. The linear form of the equation (5) is 1 𝑞 𝑒 = 1 𝑄 𝑚 + ( 1 𝑄 𝑚 𝐾 𝐿 ) 1 𝐶 𝑒 − − − − − − − − − −(6) The essential characteristic of the Langmuir isotherm can be expressed by the dimensionless constant called equilibrium parameter, RL, defined by 𝑅 𝐿 = 1 1 + 𝐾𝐿 𝐶0 − − − − − − − − − − − − − (7) Where, kL is the Langmuir constant and C0 is the initial solution of the mixture of two dyes, RL value indicates the type of isotherm to be irreversible (RL=0), favourable (0<RL<1), linear (RL=1) or unfavourable (RL>1). The isotherm constants were determined from the linear plot of 1/qe versus 1/Ce (Figure-7) and the isotherm data fitted well with Langmuir equation (R2 = 0.994). The values of different parameters are given in the Table2. Fig.7: Langmuir isotherm equation Table.2: Langmuir constants qm (mg/g) KL (L/mg) R2 20.41 0.13 0.994 3.7.2 Freundlich isotherm The Freundlich isotherm is derived by assuming a heterogeneous surface with a non-uniform distribution of heat of adsorption over the surface. Freundlich isotherm can be expressed as 𝑞 𝑒 = 𝐾𝐹 𝐶𝑒 1 𝑛 − − − − − − − − − − − − − (8) Where, KF is the adsorption capacity at unit concentration and 1/n is adsorption intensity. 1/n values indicate the type of isotherm to be irreversible (1/n=0), favourable (0 <1/n <1) or unfavourable (1/n> 1). To examine the acceptance of the model with respect to the experimental data, the plot of logCe versus log qe plotted. From the Figure 8 Freundlich constants KF and 1/n were evaluated and are given in the Table-3. Fig. 8: Freundlich isotherm equation Table.3: Freundlich constants KF (L/mg) 1/n R2 3.639 0.197 0.954 3.7.3 Temkin isotherm This isotherm contains a factor that explicitly taking into the account of adsorbent-adsorbate interactions. This model assumes that the heat of adsorption of all molecules in the layer would decrease linearly rather than y = 0.3783x + 0.0497 R² = 0.9944 0 0.05 0.1 0.15 0.2 0 0.2 0.4 1/qe 1/Ce y = 0.1972x + 0.5619 R² = 0.9541 0 0.2 0.4 0.6 0.8 1 1.2 1.4 0 2 4 logqe logCe
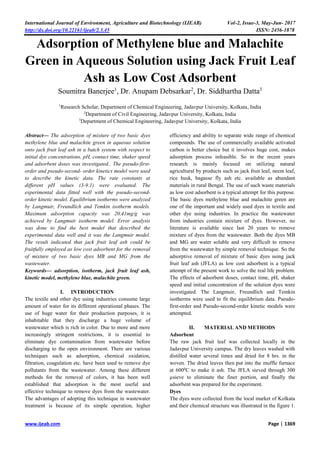
- 5. International Journal of Environment, Agriculture and Biotechnology (IJEAB) Vol-2, Issue-3, May-Jun- 2017 http://dx.doi.org/10.22161/ijeab/2.3.45 ISSN: 2456-1878 www.ijeab.com Page | 1373 logarithmic change. The mathematical expression for the model is given as 𝑞 𝑒= 𝑅𝑇 𝑏 ln 𝐶 𝑒 − − − − − − − − − − − (9) The linearized form of the equation is given as 𝑞 𝑒= 𝑅𝑇 𝑏 ln 𝐴+ 𝑅𝑇 𝑏 ln 𝐶 𝑒 − − − − − − − − − (10) where, r= gas constant (8.314 J/mol/K), T= Temperature in ‘K’ and B1= RT/b. From the plot of qe versus log Ce (Fig. 9) the isotherm constants were evaluated and are given in the Table-4. Fig. 9: Temkin isotherm equation Table.3: Temkin constants KT(L/mg) B1 R2 0.097 0.021 0.972 3.8 Statistical analysis The statistical analysis is employed in the present work due to inherent bias resulting from linearization. Five different error functions (Table-4) for statistical analysis were carried out to find the optimum isotherm model which best fited with the data obtained from the experimental run. The another type of statistical analysis named chi-square (X2 ) test was also carried out to explore the significance of the effects of the parameters on present investigation of mixed dye removal and the residual concentrations of dye mixture at equilibrium. Table.4: Different error functions Statistical analysis Formulae Sum of the squares of the errors (SSE) ∑(𝑞 𝑒 𝑐𝑎𝑙 − 𝑞 𝑒 𝑚𝑒𝑎𝑠)𝑖 2 𝑛 𝑖=1 Sum of the absolute error (SAE) ∑ | (𝑞 𝑒 𝑚𝑒𝑎𝑠 − 𝑞 𝑒 𝑐𝑎𝑙) 𝑞 𝑒 𝑚𝑒𝑎𝑠 | 𝑖 𝑛 𝑖=1 Average relative error (ARE) 100 𝑛 ∑ | (𝑞 𝑒 𝑚𝑒𝑎𝑠 − 𝑞 𝑒 𝑐𝑎𝑙) 𝑞 𝑒 𝑚𝑒𝑎𝑠 | 𝑖 𝑛 𝑖=1 Hybrid fractional error function (HYBRID) 100 𝑛 − 𝑝 ∑ [ (𝑞 𝑒 𝑚𝑒𝑎𝑠 − 𝑞 𝑒 𝑐𝑎𝑙) 𝑞 𝑒 𝑚𝑒𝑎𝑠 ] 𝑖 𝑛 𝑖=1 Marquardt’s standard deviation (MPSD) 100√ 1 𝑛 − 𝑝 ∑ { (𝑞 𝑒 𝑚𝑒𝑎𝑠 − 𝑞 𝑒 𝑐𝑎𝑙) 𝑞 𝑒 𝑚𝑒𝑎𝑠 } 𝑖 2𝑛 𝑖=1 3.8.1 Selection of best isotherm model Since each of the error function produces a different set of isotherm parameters, it is difficult to identify directly an optimum set. Thus to find the best model a normalization of each parameter was employed. In the normalization processes first each error function was selected in turn and the results for each parameter set were determined. The normalized values of each isotherm against error analysis are given in the Table-5. Table.5: Error analysis of isotherm equations Isotherm Error analysis SSE SAE ARE HYBRID MPSD Langmuir 0.282 0.56 0.30 0.50 15.0 Freundlich 4.8 4.04 50 19.0 89.1 Temkin 22.7 9.03 95.8 191.2 270.2 The values from the Table clearly showed that Langmuir equation was best followed the equilibrium data, same as predicted by coefficient of regression (R2 ) value. In order to avoid such uncertainty in claiming a specific isotherm model, it is thus imperative to carry out a more normalized error analysis as elucidated earlier in the form of chi-square test. The calculated values of chi-square test under various isotherm models are given in the Table -6. It can be seen that the adsorption of the two dyes in mixed solution follows Langmuir isotherm very well. Table.6: Chi-square test value for different isotherms Isotherm model X2 value Langmuir 0.0001 Freundlich 1.73 Temkin 9.27 Feasibility of adsorption isotherm is necessary for characterizing the adsorption beyond determining the optimum isotherm. In order to check the feasibility for adsorption for the adsorbent, JFLA onto mixed dyes in solution a dimensionless constant RL was determined as given in the Table-7. Table.7: Feasibility study for the adsorption of JFLA Adsorbent RL Remarks JFLA 0.23 As 0<RL<1 adsorption is favourable y = 0.2101x - 0.049 R² = 0.9725 0 1 2 3 4 0 10 20 logCe qe
- 6. International Journal of Environment, Agriculture and Biotechnology (IJEAB) Vol-2, Issue-3, May-Jun- 2017 http://dx.doi.org/10.22161/ijeab/2.3.45 ISSN: 2456-1878 www.ijeab.com Page | 1374 IV. CONCLUSION Equilibrium and kinetic studies were done for the adsorption of mixture of two basic dyes methylene blue and malachite green onto jack fruit leaf ash. The biosorbent exhibited high sorption capacities towards the mixture of two dyes. The kinetic studies of dye mixture on JFLA were performed based on pseudo-first-order and pseudo-second-order rate mechanism. The data indicate that the adsorption kinetics followed pseudo-second-order rate expression at the pH values of 3.0 to 9.1. The equilibrium data using Langmuir, Freundlich and Temkin isotherms and the characteristic parameters for each isotherm have been determined. The results showed that the experimental results were correlated reasonably well by Langmuir adsorption model. Error analysis was conducted and established Langmuir model more appropriate over the other two models. Results of the adsorption showed that jack fruit leaf ash can effectively used as a biosorbents for the removal of model cationic dyes methylene blue and malachite green from the mixture of aqueous solution. ACKNOWLEDGEMENTS The authors are thankful to Dr. Anirban K. Chowdhury Ex-Research Scholar of School of Environmental Science, Jadavpur University, for his full support during the entire experimental work. The authors are also grateful to all laboratory staff members of Civil Engineering Department, Jadavpur University for their technical support. REFERENCES [1] A. Demirbas, “Agricultural based activated carbons for the removal of dyes from the aqueous solution,” J. Haz. Mat., vol.167, 2009, pp. 1-9. [2] A.E. Ofomaja, “Sorptive removal of Methylene blue from aqueous solution using palm kernel fibre:effect of fibre dose,” Biochem. Engg., 2008 vol.40 pp.88- 96. [3] B.H. Hameed, D.K. Mmahmoud, a.L. ahmad,”sorption of basic dyes from aqueous solution by pomelo peel in a batch system,” 2008, vol.316, pp78-84. [4] D. Khalid, M. Amran, W. Azlina,” Batch adsorption of basic dye using acid treated fibre char: Equilibrium, kinetic and thermodynamic studies,” Chem Engg. J.,2011, pp. 449-457. [5] D. Kavitha , C. Namasivayam, “Experimental and kinetic studies on methylene blue adsorption by coir pitch carbon,” Bioresource. Tech., 2007, vol.-98, pp. 14-21. [6] E.l.K Mui, W.H. Cheung, G.C. Mckay,”Tyre char preparation from waste tyre rubber for dye removal from effluents,” j.Haz. Mat., 2010 vol. 175 pp. 151- 158. [7] F. Banat, S. Al-Asheh, R. Al-Ahmad,”Bench-scale and packed bed sorption of methylene blue using treated olive pomace and charcoal,” Bioresource Tech., 2007, vol. 98, pp. 3017-3025. [8] I.D. Mall, V.C. Srivastava, N.K. agrawal,” Removal of Orange-G Methyl Violet dyes by adsorption onto fly ash-kinetic study and equilibrium isotherm analyses,” Dyes and Pigments, 2006, vol. 69, pp. 210-223. [9] K. Vasanth Kumar, “Linear and non-linear regression analysis for the sorption kinetics of methylene blue onto activated carbon,” J. H.Mat., 2006, vol. 137, pp. 1538-1544. [10]Md. Tamez uddin, Md. Rukanuzzaman, Md. Maksudur rahaman,” Adsorption of methylene blue from aqueous solution by jack fruit leaf powder: A fixed-bed column study,” Journal of Env. Management, 2009, vol. 90, pp. 3443-3450. [11]T.K. Sen, M.T. Yagub, S. Afroze,” Dye and its removal from aqueous solution by adsorption: A review,” Colld. and Int. Sci., 2014, vol. 209, pp. 172- 184.