samsungbiologics 207940 Algorithm Investment Report
•
0 likes•115 views

samsungbiologics 207940 Algorithm Investment Report
![[Price for scheduled purchasing]
Arbitrarily made
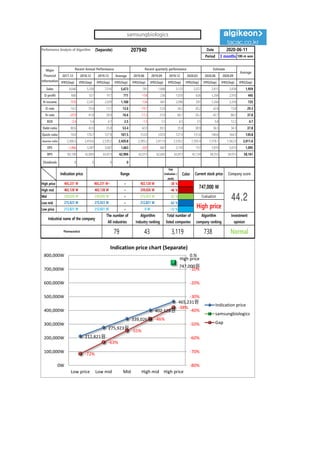
Algorithm stocks Trading Strategies (Separate) 207940 Date
Period
Gap
(Indication /
stock)
Color
2020-06-11
3 months
Current stock price Evaluation
Stock price rise
probability score
Investment opinion Prospective purchase amount
747,000 W High price 57.4 Normal 1,950,000 W
Suggested Purchase
Amount 726,740 W
Number of stocks
purchased 1
Indication price Range Buying / Selling Buying / Selling [Stocks]
High price 465,231 W 465,231 W~ ~ 402,128 W -38 % 274,127 W 1
High mid 402,128 W 402,128 W ~ 339,026 W -46 % 335,519 W 1
Mid 339,026 W 339,026 W ~ 275,923 W -55 % 396,910 W 1
Low mid 275,923 W 275,923 W ~ 212,821 W -63 % 458,301 W 2
low price 212,821 W 212,821 W ~ 0 W -72 % 519,692 W 2
2020.01.15 2020.02.14 2020.03.13 2020.04.10 2020.05.14 2020.06.11
22.1 31.5 47.4
Stock price rise
probability score
A Sector 53.3 44.9 50.9 49.9 45.1 46.8
57.4B Sector 44.6 38.3 49.9 49.9 17.9 47.9
Total average 49.0 41.6 39.4
30 % 34 %
2020.02.14 2020.03.13 2020.04.10 2020.05.14 2020.06.11
Total of
increase rate
Total score
A Sector -19 % 12 % -2 % -11 % 4 %
-8 % 44.7B Sector -16 % -37 % 44 % -179 % 63 %
Total average -18 % -6 % -78 %
-19%
12%
-2% -11%
4%
-16%
-37%
44%
-179%
63%
-18%
-6%
-78%
30% 34%
-200%
-150%
-100%
-50%
0%
50%
100%
2020.02.14 2020.03.13 2020.04.10 2020.05.14 2020.06.11
Increase rate of stock price rise
A sector
B sector
Total average
samsungbiologics
53
45
51 50
45 4745
38
28
50
18
4849
42 39
22
32
47
0
10
20
30
40
50
60
2020.01.15 2020.02.14 2020.03.13 2020.04.10 2020.05.14 2020.06.11
Stock price rise probability score
A sector
B sector
Total average](data:image/gif;base64,R0lGODlhAQABAIAAAAAAAP///yH5BAEAAAAALAAAAAABAAEAAAIBRAA7)
Recommended
Recommended
More Related Content
What's hot
What's hot (20)
Similar to samsungbiologics 207940 Algorithm Investment Report
Similar to samsungbiologics 207940 Algorithm Investment Report (20)
More from 알고리즘 기업분석 컨설팅-알기컨,algikeon
More from 알고리즘 기업분석 컨설팅-알기컨,algikeon (20)
Recently uploaded
Recently uploaded (20)
samsungbiologics 207940 Algorithm Investment Report
- 1. Performance Analysis of Algorithm (Separate) 207940 Date Period 3 months 100-m won 2017.12 2018.12 2019.12 Average 2019.06 2019.09 2019.12 2020.03 2020.06 2020.09 IFRS(Sep) IFRS(Sep) IFRS(Sep) IFRS(Sep) IFRS(Sep) IFRS(Sep) IFRS(Sep) IFRS(Sep) IFRS(Sep) IFRS(Sep) IFRS(Sep) Sales 4,646 5,358 7,016 5,673 781 1,848 3,133 2,072 2,815 3,838 1,959 O-profit 660 557 917 711 -154 236 1,070 626 1,204 2,910 445 N-income -970 2,241 2,029 1,100 -134 441 2,090 501 1,204 3,318 725 O-rate 14.2 10.4 13.1 12.6 -19.7 12.8 34.2 30.2 42.8 75.8 29.3 N-rate -20.9 41.8 28.9 16.6 -17.2 23.9 66.7 24.2 42.7 86.5 37.8 ROE -2.4 5.4 4.7 2.5 -1.3 1.5 6.5 3.5 5.8 12.2 4.7 Debt-ratio 80.6 43.9 35.8 53.4 42.0 39.5 35.8 38.9 36.5 34.3 37.8 Quick-ratio 18.0 176.7 127.9 107.5 153.0 120.9 127.9 131.6 140.6 164.5 139.8 reserve-ratio 2,306.5 2,416.6 2,539.2 2,420.8 2,385.2 2,411.9 2,539.2 1,595.4 1,576.1 1,562.0 2,011.6 EPS -1,466 3,387 3,067 1,663 -203 667 3,159 757 1,819 5,015 1,095 BPS 60,100 62,805 65,813 62,906 62,013 62,683 65,813 42,134 38,355 34,915 58,161 Dividends 0 0 0 0 2020-06-11 Major Financial Information Recent Annual Performance Recent quarterly performance Estimate Average Gap (Indication / stock) Color High price ~ -38 % High mid ~ -46 % Mid ~ -55 % Low mid ~ -63 % Low price ~ -72 % Indication price Range Current stock price Company score 402,128 W 402,128 W 339,026 W 339,026 W 339,026 W 275,923 W Evaluation 465,231 W 465,231 W~ 402,128 W 747,000 W 44.2275,923 W 275,923 W 212,821 W High price Normal 212,821 W 212,821 W 0 W Industrial name of the company The number of All industries Algorithm Industry ranking Total number of listed companies Algorithm company ranking Investment opinion Pharmaceutical 79 43 3,119 738 212,821원 275,923원 339,026원 402,128원 465,231원 High price 747,000원 -72% -63% -55% -46% -38% -80% -70% -60% -50% -40% -30% -20% -10% 0.% 0W 100,000W 200,000W 300,000W 400,000W 500,000W 600,000W 700,000W 800,000W Low price Low mid Mid High mid High price Indication price chart (Separate) Indication price samsungbiologics Gap samsungbiologics
- 2. [Price for scheduled purchasing] Arbitrarily made Algorithm stocks Trading Strategies (Separate) 207940 Date Period Gap (Indication / stock) Color 2020-06-11 3 months Current stock price Evaluation Stock price rise probability score Investment opinion Prospective purchase amount 747,000 W High price 57.4 Normal 1,950,000 W Suggested Purchase Amount 726,740 W Number of stocks purchased 1 Indication price Range Buying / Selling Buying / Selling [Stocks] High price 465,231 W 465,231 W~ ~ 402,128 W -38 % 274,127 W 1 High mid 402,128 W 402,128 W ~ 339,026 W -46 % 335,519 W 1 Mid 339,026 W 339,026 W ~ 275,923 W -55 % 396,910 W 1 Low mid 275,923 W 275,923 W ~ 212,821 W -63 % 458,301 W 2 low price 212,821 W 212,821 W ~ 0 W -72 % 519,692 W 2 2020.01.15 2020.02.14 2020.03.13 2020.04.10 2020.05.14 2020.06.11 22.1 31.5 47.4 Stock price rise probability score A Sector 53.3 44.9 50.9 49.9 45.1 46.8 57.4B Sector 44.6 38.3 49.9 49.9 17.9 47.9 Total average 49.0 41.6 39.4 30 % 34 % 2020.02.14 2020.03.13 2020.04.10 2020.05.14 2020.06.11 Total of increase rate Total score A Sector -19 % 12 % -2 % -11 % 4 % -8 % 44.7B Sector -16 % -37 % 44 % -179 % 63 % Total average -18 % -6 % -78 % -19% 12% -2% -11% 4% -16% -37% 44% -179% 63% -18% -6% -78% 30% 34% -200% -150% -100% -50% 0% 50% 100% 2020.02.14 2020.03.13 2020.04.10 2020.05.14 2020.06.11 Increase rate of stock price rise A sector B sector Total average samsungbiologics 53 45 51 50 45 4745 38 28 50 18 4849 42 39 22 32 47 0 10 20 30 40 50 60 2020.01.15 2020.02.14 2020.03.13 2020.04.10 2020.05.14 2020.06.11 Stock price rise probability score A sector B sector Total average
- 3. may ded by Compliance notice ① The information provided by The Algorithm Company Analysis Consulting is obtained through reliable data and information and The Algorithm Company Analysis Program (TACAP), but its accuracy or completeness are not guaranteed. Furthermore, it may change over time.Therefore, we are not legally responsible for the results of the data provided by The Algorithm Company Analysis Consulting because of information errors or omissions. ② The Algorithm Company Analysis Consulting and all the information provided on it site are reference materials for investment decisions and the final responsibility of investment is up to users utilizing this information. ③ The Algorithm Company Analysis Consulting and its site do not do anything that violates the related laws such as discretionary transaction. ④ Users can not reallocate and recycle the information provided by The Algorithm Company Analysis Consulting firm let alone the information provided by its Site. ⑤ Be sure to know about application period of this algorithm analysis report in order to improve its accuracy. Tel : 070 - 4667 - 5009 Email : tacac@tacac.co.kr Homepage : tacac.co.kr Blog : tacac.blog.me SERVICES M&A, IPO, RECOVER, CORPORATE RESTRUCTURING, MANAGEMENT OF TECHNOLOGY, BUSINESS STRATEGY, FAMILY BUSINESS Request : http://tacac.co.kr/?page_id=1374