
Recommended
More Related Content
Similar to Exercises-OEE+-+kopie.pdf
Similar to Exercises-OEE+-+kopie.pdf (20)
Recently uploaded
Recently uploaded (20)
Exercises-OEE+-+kopie.pdf
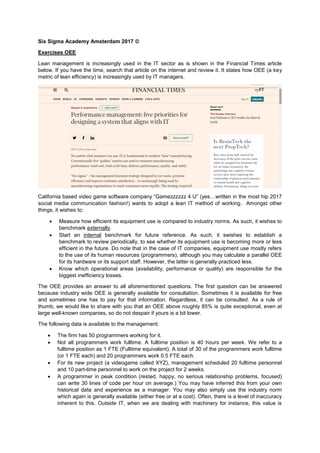
- 1. Six Sigma Academy Amsterdam 2017 © Exercises OEE Lean management is increasingly used in the IT sector as is shown in the Financial Times article below. If you have the time, search that article on the internet and review it. It states how OEE (a key metric of lean efficiency) is increasingly used by IT managers. California based video game software company “Gamezzzzzz 4 U” (yes…written in the most hip 2017 social media communication fashion!) wants to adopt a lean IT method of working. Amongst other things, it wishes to: Measure how efficient its equipment use is compared to industry norms. As such, it wishes to benchmark externally. Start an internal benchmark for future reference. As such, it swishes to establish a benchmark to review periodically, to see whether its equipment use is becoming more or less efficient in the future. Do note that in the case of IT companies, equipment use mostly refers to the use of its human resources (programmers), although you may calculate a parallel OEE for its hardware or its support staff. However, the latter is generally practiced less. Know which operational areas (availability, performance or quality) are responsible for the biggest inefficiency losses. The OEE provides an answer to all aforementioned questions. The first question can be answered because industry wide OEE is generally available for consultation. Sometimes it is available for free and sometimes one has to pay for that information. Regardless, it can be consulted. As a rule of thumb, we would like to share with you that an OEE above roughly 85% is quite exceptional, even at large well-known companies, so do not despair if yours is a bit lower. The following data is available to the management: The firm has 50 programmers working for it. Not all programmers work fulltime. A fulltime position is 40 hours per week. We refer to a fulltime position as 1 FTE (Fulltime equivalent). A total of 30 of the programmers work fulltime (or 1 FTE each) and 20 programmers work 0.5 FTE each. For its new project (a videogame called XYZ), management scheduled 20 fulltime personnel and 10 part-time personnel to work on the project for 2 weeks. A programmer in peak condition (rested, happy, no serious relationship problems, focused) can write 30 lines of code per hour on average.) You may have inferred this from your own historical data and experience as a manager. You may also simply use the industry norm which again is generally available (either free or at a cost). Often, there is a level of inaccuracy inherent to this. Outside IT, when we are dealing with machinery for instance, this value is
- 2. more simple to come by and is more objective and reliable. Often, it is provided by the supplier of your equipment. In your case, on average, 20 lines were written per hour. During the project, one of the fulltime programmers and one part-time programmer fell ill halfway the project and remained ill throughout the project. The ill programmers had to have his work distributed over other members of the project. People outside the project could not be used as they had their own projects and/or lacked the expertise. This entailed a total of 20 hours of briefing the replacing programmers. Upon final review, you find that roughly 3% of the code contained errors and had to be recoded by a separate beta testing team. Assignment: Calculate the OEE with the data you have. Interpret it and determine the biggest source(s) of efficiency loss. See next age for solution.
- 3. Answers: Planned output: (20 fulltime * 40 hrs + 10 part-time * 20 hours) * 2 weeks = 2,000 hrs Gross output: 2,000 hours - breakdown - set-up and changeover time. The fulltime programmer was absent for 40 hrs and the parttime programmer for 20 hrs. This is referred to as ‘breakdown.’ We need to subtract the 20 hrs spent on briefing from the gross output. The 20 hrs of briefing fall in the category of changeover and set up time. As such, gross output = 2,000 hrs – 40 hrs – 20 hrs – 20 hrs = 1,920 hours. Net output: The remaining work was done at 2/3 speed (20 lines instead of the 30 lines) and as such, we have 33% speed loss. As such, Net output = gross output – speed loss which comes to 1,920 * 0.67 = 1,286 hours. Valuable output = net output – scrap. Since we know that 3% of the code needed rework, we need to reduce the net output by 3%. As such, 1,286 – 3% = 1,286 * 0.97 = 1,247 hours. Do note that this assumes that the coding was done homogenously through time. This is not really an unrealistic assumption in general. Now it is just a matter of plugging the found values in the following formulas and obtain the OEE. Availability rate or a = Gross output / planned output 0.96 = 1,920 / 2,000 Performance rate or p = Net output / gross output 0.67 = 1,286 / 1,920 Quality rate or q = Valuable output / net output 0.97 = 1,247 / 1,286 OEE = a * p * q 0.62 = 0.96 * 0.67 * 0.97 As such, our OEE is 62%. An OEE of 100% means that you use your equipment as much as you planned, that it performs as planned and produces no defects. Yours is substantially lower than the perfect score. We can now use this as an internal and external benchmark. It is certainly not a performance rate to be proud of as there seems a long potential for improvement. Finally, we can infer from this that our biggest efficiency loss (67% performance) can be attributed to our performance rate. Our programmers’ sub-optimal speed is the first thing to target when trying to improve our OEE. Common causes for reduced speed in human resources are: Poor directions which leads to confusion Poor performance management including reward system which leads to a drop in moral Poor general training/education of staff Worker is involved in too many projects and cannot focus The crowd effect. Large teams typically allow people to hide their performance. It also means that they are less confident that any extra effort will be noticed by anyone. As such, they reduce their norms and just try to fit in the crowd…..nothing more….nothing less.