On Dalton, Evaporation and the hydrological cycle - a brief journey to scientific discovery
•
1 gostou•347 visualizações

John Dalton established quantitative hydrology in 1799 by creating a water balance for England and Wales using rainfall and river flow data. He attributed the origin of springs to rainfall, rejecting long-held myths and laying the foundation for the modern understanding of the hydrological cycle. Recent work has focused on understanding soil evaporation dynamics at the pore scale, finding that as the soil surface dries, the spacing between pores increases, leading to higher evaporative flux per pore that can maintain an overall constant evaporation rate despite a decreasing surface area. This pore-scale model provides insights into evaporation rates, surface resistance, and energy partitioning during drying.

Recomendados
Mais conteúdo relacionado
Mais procurados
Mais procurados (17)
Semelhante a On Dalton, Evaporation and the hydrological cycle - a brief journey to scientific discovery
Semelhante a On Dalton, Evaporation and the hydrological cycle - a brief journey to scientific discovery (20)
Mais de Riccardo Rigon
Mais de Riccardo Rigon (20)
Último
Último (20)
On Dalton, Evaporation and the hydrological cycle - a brief journey to scientific discovery
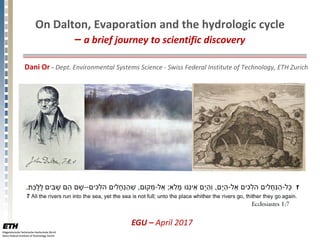
- 1. On Dalton, Evaporation and the hydrologic cycle – a brief journey to scientific discovery Dani Or - Dept. Environmental Systems Science - Swiss Federal Institute of Technology, ETH Zurich EGU – April 2017
- 2. ETH 2016 ETH 2009 The people behind the science ETH 2011 UConn 2004
- 3. Special thanks to my mentors and colleagues Eshel Bresler (1930-1991) John Hanks (1927-2014) Hannes Flühler Rainer Schulin Shmuel Assouline Peter Lehmann Experimental Farm Upper Galilee 1979
- 4. Outline - a brief journey to scientific discovery • A bit about our research group and activities (1 slide only…) • The magic of the hydrological cycle – myths and milestones • Dalton’s view of the hydrological cycle and quantitative hydrology • A timeline of evaporation history and modern context • New insights into soil evaporation (our recent work): o Soil determines evaporation dynamics and stage transition o Evaporation from pores – why is this important? • Reflections and lessons on scientific discovery…
- 5. A snapshot of research activities @ETH-STEP (2017) www.eyeofscience.com Evaporation from porous surfaces Biophysics of soil microbial life Landslide triggering Pore & grain scale acoustic emissions Spatial statistics and inventories Soil structure restoration
- 6. The magic of the hydrological cycle – early views • The existence of a natural water cycle has been known to the ancient Greeks, Egyptians, and appears in the bible • Key concepts related to conservation of mass, evaporation (sun and wind) have been formulated by the Greeks • The myth (“magic”): two competing theories regarding the origins of springs and rivers date back to Aristoteles: (1) water flowing back from the sea into the ground leaving salts behind (”sea filtration”) ; (2) the existence of large subterranean reservoirs that supply springs (Mundus subterraneus) Athanasius Kircher Mundus subterraneus (1665)
- 7. The hydrological cycle in ancient Greece (Google…)
- 8. Great thinkers… • “Facts are meaningless, you could use them to prove anything that's even remotely true!” • “Words empty as the wind are best left unsaid” Homer (800–701 BC) Homer Simpson (1987 – present) • “The same, spread out before the sun, will dry; Yet no one saw how sank the moisture in, Nor how by heat off-driven. Thus we know, That moisture is dispersed about in bits Too small for eyes to see” Lucretius Caro (99-55 BC) De Rerum Natura Aristotle (384-322) Meteorology (c.350 B.C.) On evaporation:
- 9. Early views of the hydrological cycle – Lucretius (99-55 BC) • The work of Lucretius Caro (a roman philosopher) was influenced by the scientific school of Epicurus – no magic, everything is governed by laws of nature • His book “On the Nature of Things” (De Rerum Natura) describes some of the fundamental modern physics (atomistic theory) to the roles of sun and wind in the hydrological cycle Whence may the water-springs, beneath the sea, Or inland rivers, far and wide away, Keep the unfathomable ocean full? And now, since I have taught that things cannot Be born from nothing, nor the same, when born, To nothing be recalled, doubt not my words, Because our eyes no primal germs perceive; A Florentine bibliophile named Poggio Braccionlini, who, in 1417, stumbled upon a 500-year-old copy of De Rerum Natura in a German monastery
- 10. The origins of quantitative hydrology Mariotte Halley • Edmond Halley (1656-1742) was active in a generation immediately following Pierre Perrault (1608-1680) and Edmé Mariotte (1620-1684) – the founders of quantitative hydrology James C. Dooge (1998 John Dalton medalist – EGS)
- 11. John Dalton (1766-1844) – background and contributions • John Dalton was born in Cumberland in 1766 – the son of a weaver and smallholder • At age 15 he became assistant teacher at a Quaker boarding school in Kendal; at age 19 joint principle with his brother • He summarized some of his early interest in hydro-meteorological observations in “Meteorological Observations and Essays” in 1793 as he left Kendal to Manchester • Dalton kept a life long interest in meteorological observations until his death in 1844 • Dalton’s scientific legacy is often associated with modern atomic theory, gas laws, color blindness • Dalton’s contributions to hydrology and chemistry are linked by his keen interest in gases, temperature and water vapor: “from a background of interest in the atmosphere (and hence the gases which compose it) and in deductive, predictive mathematical science that Dalton went on to think about atomic theory in chemistry” Knight 2012
- 12. The birth of quantitative hydrological cycle (1) • In 1799 Dalton established a water balance for England and Wales using rain gauges, defined catchments for river flow estimates (scaled to the Thames), and evaporation experiments from a lysimeter – to establish whether rainfall was sufficient to explain runoff & evaporation
- 13. 'The origin of springs may still therefore be attributed to rain… and it becomes unnecessary to controvert the other two opinions respecting this subject.' • Dalton thus closed a 2300 years old debate regarding the origins of springs by rejecting the myths of “Mundus subterraneus” and “sea water filtration” theories, and attributing these to rainfall, hence laying the foundation for modern hydrological cycle we now take for granted The birth of quantitative hydrological cycle (2)
- 14. Evaporation - scientific timeline Halley 1687 Schmidt 1915 Slatyer and McIlroy (1961) Lucretius 99 BC Sea water is rendered potable by evaporation; wine and other liquids can be submitted to the same process, for, after having been converted into vapours, they can be condensed back into liquids Aristotle Meteorology (c. 350 B.C.) "Essay on Evaporation” Dalton’s equation: E = f(u)*(e0-ea) where f(u) a function of wind speed, e0 is saturation vapor pressure, and ea is the vapor pressure of the air
- 15. Global evaporation – modern context and numbers… • Globally, evaporation consumes ~ 25% of solar energy input (40K TW); 50% of solar radiation goes to heating surfaces/oceans • About 60% of global terrestrial precipitation (111x103 km3/ yr) return to the atmosphere via transpiration (40%) or direct soil evaporation (20%) • The atmosphere represents an “unlimited” sink for vapor exerting large driving forces for evaporation Fluxes in: 1000 km3/year
- 16. Our recent work – evaporation from terrestrial surfaces • Evaporation is often described from atmospheric point of view - we seek to understand the role of soil (& terrestrial surfaces) in evaporation dynamics • Soil evaporation rates exhibit abrupt changes linked with soil internal transport mechanisms – the characteristics are not fully understood • Evaporation from terrestrial surfaces is significantly different than from free water surfaces (drying, capillarity, opacity) • Interactions between surface drying and mass exchange rates from discrete pores across air BL introduce nonlinearities that affect drying dynamics and surface energy partitioning
- 17. (1) What controls the transition in evaporation rates from stage 1 (high) to stage 2 (low)? To quantify effects of capillary and porous media properties on evaporation characteristics (2) What keeps evaporation rate during stage-1 constant even as the surface gradually dries? We seek a pore scale model for vapor exchange across a boundary layer that considers evaporative (diffusive) fluxes from discrete pores while the porous surface gradually dries Research questions - Evaporation dynamics • Assumption - energy input is constant • Stage 1 is defined by vaporization plane at the surface (1) (2)
- 18. Modeling concepts: evaporation from discrete pores • Vapor transfer from an evaporating porous surface to flowing air above occurs across a viscous sublayer (BL) of thickness δ (varies with air velocity) • Unlike the drying of uniformly moist surfaces (or free water surfaces) – soil evaporation takes place from discrete pores of different sizes • Theory shows that air BL thickness δ affects: (i) average vapor gradient (higher air velocity → thinner δ→ higher rate), and (ii) the space for diffusive vapor shells forming above active pores • Surface pores empty at a particular sequence due to capillary forces (largest empty first) resulting in increased spacing between surviving pores δ Shahraeeni et al. WRR 2012 Gradual drying of a porous surface (red – smallest pores)
- 19. Modeling evaporation from discrete pores 2r δ Schlünder (1988)Suzuki and Maeda (1968) Key ingredients – previous models 1. Suzuki and Maeda (1968) and Schlünder (1988) ADE-based models were extended to consider a wide range of pore sizes that are sequentially invaded during drying 2. In addition to capillary pore invasion we solve for force balance at the menisci and capillary flow to supply surface evaporation Shahraeeni et al. WRR 2012 Haghighi et al. WRR 2013
- 20. (E/E0) Evaporation from pores: pore size and spacing effects • As the surface gradually dries, the evaporative flux per pore increases (diffusion field 1D→3D) and may compensate for reduced evaporating area (i.e., lower surface water content) • The boundary layer (BL) thickness (δ) defines: mean vapor gradients and the space for 3-D diffusion vapor shells forming over individual pores Shahraeeni et al. WRR 2012 • For a surface with regularly spaced pores of equal size (drying = larger spacing); three critical lengths: pore size and pore spacing relative to BL thickness δ jointly determine flux compensation efficiency and drying curve shape (E/E0 vs. surface saturation)
- 21. Pore size & spacing affect per-pore evaporative flux • Evaporation rate per pore increases with increased pore spacing as the diffusion field becomes 3-D. The increased flux may compensate for loss in evaporating area (drying surface) 1.0 Increased flux per pore Relative(per-pore)evaporationrate Surface relative saturation 1
- 22. increased flux per pore Pore scale model – so how a “constant rate” is maintained? • Evaporative flux per pore increases with increased spacing between active pores as soil surface dries (during stage-1 = vaporization plane at surface) • Increased “per pore” flux could compensate for reduced evaporating area resulting in constant evaporation rate (while energy input remains constant) Surface drying (larger spacing) Increased evaporative flux per pore Epore/E0[-] Relative surface saturation Shahraeeni et al. WRR 2012
- 23. Applications of pore-based evaporation model: surface resistance • The pore-scale evaporation model was used to estimate surface evaporative resistance as a function of water content (θsurf) and mean pore size <Rp> • The physically-based representation of the nonlinear surface resistance is critical for remote sensing of soil evaporation (reducing empiricism) van de Griend and Owe (1994 WRR) Haghighi et al. WRR 2013 D fR r surfPm BLS )(θδ ><+ =+ ( ) −= 1 44 2 θ π θ π π θf
- 24. Injecting surface energy balance into the pore-based (“atomistic”) view of evaporation enables: 1. Analytical links between evaporation rates and surface temperature - pore scale coupled energy balance (PCEB) and surface drying feedback 2. The model permits prediction of energy partitioning during surface drying (i.e., Bowen Ratio β or Priestley-Taylor α in predictive mode for various climatic conditions) to improve remote sensing of surface fluxes Energy partitioning on evaporating surfaces Aminzadeh and Or (2013, WRR) Aminzadeh and Or (2014, J. Hydrol.) Aminzadeh, Roderick and Or (2016, WRR) 3. New insights into energy, evaporation and temperatures of surfaces enabling generalization of the complementary relationship (CR) for estimating actual evaporation from large areas Aminzadeh & Or (2017, Int. J. Heat Mass Trans.)
- 25. Lessons and reflections: (1) on data and models • The statement above should not be interpreted as superiority of data over theory – both are essential ingredients of the scientific method • In defense of a good theory - clearly experiment serve as the sole judge, yet, don’t rush to judgment and allow for a deliberate appeal process • Big data is becoming extremely useful (machine learning, etc.), yet without a paradigm or a theory no generalization is possible (& nothing to “judge”) Dalton’s mass (im)balance Big data models
- 26. Lessons and reflections: (2) scientific history and cultural bias • The Chinese, Mayan, Egyptian, Russian accounts of the origins and scientific history of the hydrological cycle are likely different than the Euro-centric tales we’ve just heard • It is interesting and rewarding to look at scientific developments from different cultural angles to gain appreciation of their impacts in different societies and at different times Yu the Great 2205 to 2197 BC The hydrological cycle - Olmec culture, Mesoamerica, 800 BC Hapi – source of the Nile Dujiangyan irrigation system 256 BC
- 27. Nima Stan Ebrahim Uri Erfan Shmuel Dani Hans Peter Mike Milad KlausRainer Mina Martina
- 28. • Evaporative losses from reservoirs and other water bodies may exceed 20% of water used in irrigated agriculture (in some regions >40%) • A useful option for reducing evaporative losses from reservoirs is based on self-assembling floating covers – do we want large or small “pores” for floating covers? Water losses from partially covered reservoirs Assouline, Narkis & Or (WRR 2010; 2011) Evaporating surface area (m2 m-2) Relativeevaporationrate Larger “pores” more efficient cover! δ=2 mm 91% of area covered R=20 mm
- 29. The origins of the CR asymmetry Aminzadeh, Roderick & Or (2016, WRR) • The surface temperature range on the horizontal axis is defined by surface properties and climatic variables determine the origins of the CR asymmetry (thus different values of the parameter b) where surface properties define the temperature range and the energy input the location (position) of hatched area Input energy Surface properties
- 30. Pore size and spacing affect per-pore evaporative flux “thick” boundary layer
- 31. Global evaporation – some numbers… • Globally, evaporation consumes ~ 25% of solar energy input (40K TW); 50% of solar radiation goes to heating surfaces/oceans • About 60% of global terrestrial precipitation (111x103 km3/ yr) returns to the atmosphere via transpiration (40%) or direct soil evaporation (20%) • The atmosphere represents an “unlimited” sink for vapor exerting large driving forces for evaporation Fluxes in: 1000 km3/year Horton (1931) – defending the creation of hydrology section of the AGU (previously rejected as “active scientific interest in the U.S. did not justify a separate section of scientific hydrology within the AGU” (National Research Council 1991, 40)