3. response secondary to the induction of experimental hy-
pertension, we chronically infused angiotensin II into 2
lines of genetically engineered mice harboring point mu-
tations that specifically inactivate either the N- or the
C-terminal catalytic domain of ACE; these mice are
termed N-KO and C-KO, respectively.13,14 In these mouse
models, the genetic mutations have no effect on the tissue
distribution or levels of ACE expression. Under basal
conditions, N-KO and C-KO mice have normal and equiv-
alent blood pressures and plasma levels of angiotensin II.
Thus, the N-KO and C-KO mice permit investigation of
ACE domain-specific functions independent of secondary
effects of basal blood pressure changes, a typical bias
introduced with either ACE inhibitors or the genetic
elimination of all ACE expression.
Methods
The systolic blood pressure of N-KO, C-KO, and WT mice was
repeatedly measured by tail-cuff plethysmography for 2 or 3 weeks
during the infusion of 980 ng/kg per minute of angiotensin II by
osmotic minipump. For the blood pressure analysis, at least 21
animals per group were studied. For in vivo experiments in which
POP was inhibited, N-KO and wild-type (WT) mice received 2
weeks of angiotensin II (980 ng/kg per minute) by minipump and
received daily intraperitoneal (IP) injections of 10 mg/kg of S-17092.
Blood pressure was measured as described above. At least 9 mice per
group were studied.
For in vitro production of cytokines, peritoneal macrophages
from N-KO, C-KO, and WT mice were collected after thiogly-
collate injection. After purification, cells were cultured overnight
with 1 mg/mL lipopolysaccharide (LPS). Supernatant concentra-
tion of TNF␣, IL-12, and IL-10 were measured by ELISA. To
measure in vivo production of TNF␣, N-KO, C-KO, and WT mice
were injected IP with 45 mg/kg of LPS, and sera levels of TNF␣
were measured by ELISA. For all figures showing cytokine
production, the number of mice studied is indicated by individual
data points.
To examine the role of AcSDKP in blood pressure control, WT
or N-KO mice received 980 ng/kg per minute of angiote-
nsin II for 2 weeks. Groups of 10 WT mice received 0, 0.5, 1.5,
or 3.0 mg/kg per day AcSDKP beginning 1 week before the start
of angiotensin II infusion and continuing throughout the experi-
ment. Blood pressure was repeatedly measured as described
above. In a separate experiment, all N-KO mice received daily IP
injections of 10 mg/kg of S-17092 in addition to angiotensin II.
Five N-KO mice also received 1.5 mg/kg per day of AcSDKP by
osmotic minipumps. Blood pressure was repeatedly measured. A
full description of the Materials, Methods, and Statistics is
found in the online Data Supplement (available at
http://hyper.ahajournals.org).
Results
Under basal conditions, the systolic blood pressures of the
N-KO, C-KO, and WT mice averaged 111Ϯ2 mm Hg,
105Ϯ2 mm Hg, and 112Ϯ1 mm Hg. The mice were
implanted with osmotic minipumps that delivered 980
ng/kg per minute of angiotensin II for 2 weeks. The blood
pressure was determined 3, 5, 7, 10, 12, and 14 days after
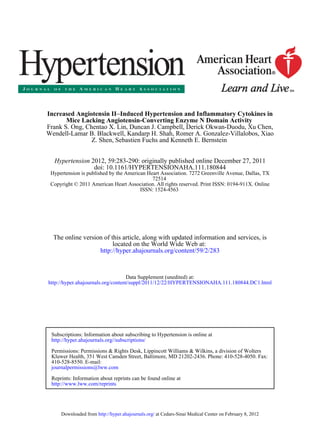
the start of angiotensin II infusion (Figure 1).15 At day 5,
the blood pressures of both N-KO and C-KO mice were
significantly higher than WT mice. The blood pressures of
the C-KO mice reached a peak at day 7 (164Ϯ5 mm Hg)
and then decreased so that by day 14, the pressures of these
mice were virtually identical to WT. In contrast, the blood
pressures of the N-KO mice remained significantly above
the WT animals from day 5 onward and at day 14 averaged
173Ϯ5 mm Hg (PϽ0.001 for N-KO versus WT or C-KO).
Thus, after a 2-week infusion of angiotensin II, N-KO mice
had systolic blood pressures that averaged 26 and
27 mm Hg greater than C-KO or WT mice.
To investigate if the pressure differences between N-KO
mice, C-KO and WT mice were sustained, smaller numbers
of mice were infused with angiotensin II for 21 days. On days
19 and 21, the N-KO mice averaged 200Ϯ5 and
190Ϯ4 mm Hg (nϭ5), whereas WT averaged 147Ϯ5 and
147Ϯ4 mm Hg (nϭ4, PՅ0.001). C-KO mice averaged
142Ϯ8 and 127Ϯ10 mm Hg (nϭ3, PϽ0.001). Thus, the
sustained elevation of blood pressure in the N-KO group was
maintained in the 3rd week of angiotensin II infusion.
To understand the difference in blood pressure response
between the N-KO, C-KO, and WT mice, we measured
blood and kidney angiotensin peptides under basal condi-
tions and after 14 days of angiotensin II infusion (Figure
2). Under basal conditions, the 3 groups had similar levels
of angiotensin II in the blood; kidney levels were also
equivalent among the 3 groups. Infusion of angiotensin II
significantly elevated blood angiotensin II in all mice, but
among the groups there were no significant differences. At
14 days, kidney angiotensin II levels were also markedly
higher than basal levels. However, whereas levels in C-KO
and WT mice were virtually identical, renal levels of
N-KO
WT
C-KO
100
110
120
130
140
150
160
170
180
190
0 3 5 7 10 12 14
Days
BloodPressure(mmHg)
N vs WT
C vs WT
** ** *
**
*****
***
*** ns ns ns
N vs C ns ns ns *
Figure 1. Blood pressure response to an-
giotensin II infusion. On day 0, blood pres-
sure was determined and the mice were
implanted with an osmotic minipump
delivering angiotensin II. Blood pressure
was determined on the indicated days.
nϭ30, 21, and 30 for N-knockout (KO),
C-KO and wild-type (WT), respectively.
The significance of the data were exam-
ined by 1-way ANOVA with Tukey correc-
tion and is indicated beginning on day 5
for N-KO vs WT (N vs WT), C-KO vs WT
(C vs WT), and N-KO vs C-KO (N vs C).
*Pϭ0.05–0.01, **Pϭ0.01–0.001, and
***PϽ0.001.
284 Hypertension February 2012
at Cedars-Sinai Medical Center on February 8, 2012http://hyper.ahajournals.org/Downloaded from
4. angiotensin II in the N-KO mice were 1.5-fold those of the
other two groups (nՆ14 per group; PϽ0.015).
Previously, we reported that basal blood angiotensin I
levels were elevated in C-KO mice.14 This is also true for
renal angiotensin I levels and reflects the elevated renin found
in this model (Figure 2).
Angiotensin 1–7 is reported as an N-terminal–specific
substrate of ACE.16 Thus, we wondered if the level of this
peptide would be elevated in the N-KO mice, similar to the
elevated levels of the N terminal substrate AcSDKP. How-
ever, under basal conditions, no significant differences in
blood or renal angiotensin 1–7 were found in WT, N-KO, or
C-KO mice (Supplemental Figure 1). With the infusion of
angiotensin II, there was a rise in angiotensin 1–7 levels, with
the slope of the rise being greatest for the N-KO group.
However, by 2-way ANOVA, taking into account time and
genotype, there was no group significance. Finally, at 14
days, there were no significant differences by 1-way
ANOVA. Bradykinin showed no significant differences be-
tween the groups (Supplemental Figure 1).
To understand the role of inflammation in the blood
pressure response of the N-KO mice, we first studied a
simple model of inflammatory cytokine release in response
to LPS. In this experiment, there was no angiotensin II
infusion. Four days after IP injection of thioglycollate,
peritoneal macrophages from N-KO, C-KO, and WT mice
were collected and cultured overnight with LPS (a model
activator of macrophages). TNF␣ levels in the superna-
tants were then measured (Figure 3A). To our surprise,
there was a marked difference in cytokine profile; macro-
phages derived from N-KO mice produced far more TNF␣
than either C-KO or WT mice (N-KO versus C-KO or WT,
PϽ0.001). Study of the time course of TNF␣ protein
expression showed that as early as 4 hours after LPS
addition, there were differences between N-KO and WT
cells; by 8 hours, the differences were pronounced (Sup-
plemental Figure 2).
To investigate whether differences in TNF␣ expression
also exist in vivo, groups of N-KO and WT mice were
injected IP with LPS. Maximum blood levels of TNF␣ were
found 90 minutes after the LPS injection (Figure 3B). At this
point, TNF␣ levels in the N-KO mice were nearly double
those of the WT mice (PϽ0.005). In contrast, the same
experiment performed with C-KO mice showed a rise of
TNF␣ virtually identical to WT. Thus, both in vitro and in
vivo data show that in the absence of ACE N-terminal
catalytic activity, TNF␣ expression was increased.
Thioglycollate-elicited macrophages were also exam-
ined for LPS-stimulated expression of other cytokines.
IL-12, a proinflammatory cytokine, showed a pattern
0
200
400
600
800
1000
1200
1400
1600
1800
2000
41yad0yad
fmol/g
C-KO
WT
N-KO
Blood Ang I
Kidney Ang I
0
5
10
15
20
25
30
35
40
45
50
41yad0yad
fmol/ml
N-KO
C-KO
WT
Blood Ang II
Kidney Ang II
*
0
20
40
60
80
100
120
140
160
180
41yad0yad
fmol/g
N-KO
C-KO
WT
0
20
40
60
80
100
120
140
41yad0yad
fmol/ml
N-KO
C-KO
WT
**
**
Figure 2. Angiotensin (Ang) peptide levels. Angiotensin I and angiotensin II were measured in the blood and kidney of N-knockout (KO),
C-KO, and wild-type (WT) mice before and after infusion of angiotensin II for 14 days. Blood and kidney angiotensin I levels were sig-
nificantly elevated in C-KO mice on day 0 (**PϽ0.01, nϭ12, 6, and 12 for N-KO, C-KO, and WT, respectively). In contrast, there was no
significant difference in blood or kidney angiotensin II levels between the 3 groups of mice. After the 14-day infusion, blood angiotensin
II levels were increased, but there was no significant difference between groups. However on day 14, there was a significant increase of
kidney levels of angiotensin II in N-KO mice (*PϽ0.015, nՆ14 per group).
Ong et al Ang II Hypertension in Mice Lacking ACE N Domain 285
at Cedars-Sinai Medical Center on February 8, 2012http://hyper.ahajournals.org/Downloaded from
5. similar to TNF␣, namely after culture for 18 hours with
LPS, N-KO derived macrophages made 3-fold the cytokine
levels of WT cells (PϽ0.02) and 8-fold the cytokine levels
of C-KO cells (PϽ0.005) (Supplemental Figure 3A). In
contrast, expression of the anti-inflammatory cytokine
IL-10 by N-KO cells was only about half that produced by
either WT or C-KO macrophages (Supplemental Figure
3B). In summary, the inflammatory response of macro-
phages from N-KO mice was substantially different from
that of either WT or C-KO derived cells; in response to
LPS, N-KO cells produced cytokines typical of a strong
proinflammatory response. In contrast, C-KO–derived
cells resembled WT.
The above data examined N-KO mice for TNF␣ expres-
sion after LPS. To study the effects of angiotensin II,
N-KO and WT mice were infused with the peptide for 14
days. When the animals were killed, peritoneal cells were
collected, treated with brefeldin A to inhibit protein
secretion, then stained for surface expression of F4/80 (a
macrophage marker), fixed, permeabilized, and stained for
cytoplasmic TNF␣, which was analyzed by flow cytom-
etry. Representative data are shown in Figure 4A, where
the top panel shows data from an N-KO mouse and a WT
is shown on the bottom. The percentage of F4/80ϩ
/
TNF␣high
cells versus total F4/80ϩ
cells is shown in the
box. Combining data from at least 9 mice per group, N-KO
mice averaged 40.3Ϯ4.7% F4/80ϩ
/TNF␣high
, whereas WT
averaged 19.8Ϯ2.8% (PϽ0.002) (Figure 4B). Cumula-
tively, our data establish a compelling case for differences
in cytokine expression; to our knowledge, no other group
0
5
10
15
20
25
30
35
TNF(ng/ml)
WT N-KO C-KO
0
1
2
3
4
5
6
WT
60 min
NKO
TNF(ng/ml)
CKO WT
120 min
NKO CKOWT
90 min
NKO CKO
A B
Figure 3. Macrophage tumor necrosis factor-␣ (TNF␣) production in response to lipopolysaccharide (LPS). A, Peritoneal macrophages
from N-knockout (KO), C-KO, and wild-type (WT) mice were collected after thioglycollate injection. After purification, the macrophages
were cultured with LPS for 18 hours and TNF␣ was measured. Each dot represents data from 1 mouse. Group means and SEM are
also shown (PϽ0.001 for N-KO vs either C-KO or WT). Cells from N-KO mice produced far more TNF␣ than the equivalent cells from
the other groups. B, N-KO, C-KO, and WT mice received a single IP injection of LPS. After 60, 90, and 120 minutes, plasma concentra-
tions of TNF␣ were determined. Each dot is data from a single mouse. Group means and SEM are also shown. At 90 minutes, levels of
TNF␣ are significantly higher in N-KO mice compared with the 2 other groups (PϽ0.005).
30.1%
F4/80intensity
N-KO
N-KO
0
10
20
30
40
50
60
70
%F4/80
+
TNFα
high
cells
WT
103
102
101
100
100
101
102
103
A B
12.8%
F4/80intensity
WT
103
102
101
100
100
101
102
103
TNF α intensity
Figure 4. Macrophage production of tumor necro-
sis factor-␣ (TNF␣) in response to angiotensin II.
After mice received angiotensin II for 14 days,
peritoneal cells were collected by lavage. The cells
were then stained with fluorescent-tagged anti-
body to F4/80 and TNF␣. Fluorescence intensity
was measured by FACS. A, Typical results from an
N-KO (top) and WT mouse (bottom). The percent-
age of F4/80ϩ
/TNF␣high
cells vs total F4/80ϩ
cells
is shown in the box. B, This percentage is shown
for 9 WT and 10 N-KO mice. The group mean and
SEM are also indicated (PϽ0.002).
286 Hypertension February 2012
at Cedars-Sinai Medical Center on February 8, 2012http://hyper.ahajournals.org/Downloaded from
6. has ever identified differences in the inflammatory re-
sponse as a function of ACE N- or C-domain catalytic
activity.
Part of the reason why N-KO mice have higher blood
pressures in angiotensin II–induced hypertension may be
the differences in the inflammatory response discussed
above. Further, we wondered if these differences might be
a consequence of the known increased AcSDKP in the
N-KO model, as AcSDKP can influence the inflammatory
response. To test this, we blocked formation of AcSDKP in
N-KO and WT mice by injection of the POP inhibitor
S-17092 for 4 days before the collection of thioglycollate-
induced peritoneal macrophages.17,18 Macrophages were
then cultured overnight with LPS, and TNF␣ levels in the
supernatants were measured (Figure 5A). These data
showed that POP inhibition reduced N-KO macrophage
production of TNF␣ to levels equivalent to those of cells
from WT mice. Further, the effect of S-17092 was limited
to the N-KO mice. Thus, these data indicate that POP
activity affects in vitro macrophage production of TNF␣.
To test the effects of POP in vivo, and specifically whether
this contributes to the increased blood pressure response to
angiotensin II, groups of N-KO and WT mice were treated
with the POP inhibitor S-17092 by daily IP injection begin-
ning 3 days before implantation of the minipumps delivering
angiotensin II (Figure 5B). Blood pressure was then measured
during the 14 day angiotensin II infusion. S-17092 had little
effect on WT mice. However, N-KO mice treated with
S-17092 increased blood pressure in response to angiotensin
II significantly less than N-KO mice without S-17092
(PϽ0.001 on day 14). Or, put differently, the 25 mm Hg
average difference in blood pressure between N-KO and WT
mice treated with angiotensin II was completely eliminated
by blocking POP.
Although AcSDKP is produced by POP, it is only one of
several peptide end-products of this peptidase. To directly
investigate the effect of AcSDKP on blood pressure, we
infused this peptide by minipump in WT mice. The mice
were treated with 1 of 3 doses of AcSDKP (0.5, 1.5 or 3.0
mg/kg per day) beginning 1 week before the start of
angiotensin II infusion, and AcSDKP infusion was contin-
ued through the 14 day angiotensin II infusion period.
Blood pressure was measured at several time points
throughout the experiment. At no time did the mice
receiving AcSDKP show a significant difference in blood
pressure from that observed in WT mice treated with
angiotensin II in the absence of AcSDKP (Supplemental
Figure 4).
The lack of blood pressure effects observed with
AcSDKP infusion may be due to the large amount of ACE
in WT mice and the ability of this enzyme (which has
N-terminal activity) to degrade AcSDKP. To address
this, we studied N-KO mice treated with angiotensin II
in which POP activity was blocked by daily S-17092
injection but in which AcSDKP levels were increased by
minipump infusion of 1.5 mg/kg per day of peptide, a dose
consistent with previous studies.19 These mice were com-
pared with equivalent N-KO mice treated with angiotensin
II and S-17092 but without AcSDKP supplementation
(Figure 6). No significant elevation of blood pressure was
found with AcSDKP infusion. Further, FACS analysis of
TNF␣ production by peritoneal macrophages showed no
effect with AcSDKP infusion, as compared with mice
treated with angiotensin II and S-17092 but without
AcSDKP supplementation (Supplemental Figure 5). Thus,
these data do not indicate a role of AcSDKP in the elevated
blood pressure or inflammation of N-KO mice treated with
angiotensin II.
0
5
10
15
20
25
TNFα(ng/ml)
WT N-KO
S-17092
WT
S-17092
N-KO
90
100
110
120
130
140
150
160
170
180
0 5 7 10 14
Days
Bloodpressure(mmHg)
N-KO
N-KO
S-17092
WT
WT
S-17092
A B
Figure 5. Effect of prolyl oligopeptidase (POP) inhibition on cytokine production and blood pressure. A, N-knockout (KO) and wild-type
(WT) macrophages were collected 4 days after IP thioglycollate. Some animals received a daily IP injection of S-17092 during this
period. After culture with lipopolysaccharide (LPS) for 18 hours, the concentration of tumor necrosis factor-␣ (TNF␣) was measured.
The figure shows results from individual mice, as well as group means and SEM. Treatment with S-17092 markedly reduced TNF␣ lev-
els in cells from N-KO mice (PϽ0.001). B, N-KO and WT mice were treated for 14 days with angiotensin II. Groups of these mice were
pretreated with daily IP injection of S-17092 for 4 days before minipump implantation and continued to receive daily S-17092 during
the length of the experiment. Blood pressure was measured on days 5, 7 10, and 14 after minipump implantation. The figure shows the
group means and SEM for each time point. Treatment of N-KO mice with S-17092 reduced the blood pressure elevation to that of WT
mice. nϭ10, 10, 9, and 10 for WT, N-KO, WT/S-17092, and N-KO/S-17092, respectively.
Ong et al Ang II Hypertension in Mice Lacking ACE N Domain 287
at Cedars-Sinai Medical Center on February 8, 2012http://hyper.ahajournals.org/Downloaded from
7. Discussion
ACE inhibitors are widely used to treat hypertension and
heart disease. The goal of such therapy is blocking all ACE
activity and these inhibitors appropriately block both ACE
domains. However, the clinical emphasis on the role of
ACE in cardiovascular disease often obscures the implica-
tions of an enzyme that has maintained 2 independent
catalytic sites throughout millions of years of evolution.
These domains can be individually studied in the N-KO
and C-KO mice; perhaps the most important conclusion
from these mice is that they establish beyond doubt that the
2 ACE catalytic domains are different. In vivo, it is the
ACE C-terminal domain that normally produces the sub-
stantial majority of angiotensin II.14 In the C-KO mouse,
typical concentrations of blood angiotensin II are only
maintained through marked compensatory elevations of
renin and angiotensin I levels. In contrast, N-KO mice
have blood renin and angiotensin I levels that are essen-
tially equivalent to those of WT animals.13
Further evidence for the asymmetry of ACE domain
activity is the behavior of N-KO and C-KO mice when each
strain was infused for 2 weeks with angiotensin II. C-KO
mice demonstrated a very marked elevation of blood pressure
during the first week of peptide infusion. This peaked at 7
days and then diminished slowly during the second week to
levels equivalent to those of WT mice. Although C-KO mice
have a basal elevation of angiotensin I and renin, we do not
know whether this contributes to the exaggerated blood
pressure 7 days after the start of angiotensin II infusion.
In contrast to the C-KO model, the N-KO mouse shows
an initial elevation of blood pressure that is greater than
that of WT and that continues to increase and to maintain
the pressure differential with WT mice for at least 21 days.
At the end of the infusion period, N-KO mice have blood
pressures that averaged approximately 25 mm Hg higher
than those seen in C-KO or WT mice. Our studies present
2 possible reasons for this difference in blood pressure
response to angiotensin II. One possibility reflects the
asymmetrical accumulation of angiotensin II within the
kidneys of the N-KO mice, as compared with WT or C-KO
animals. The increased renal angiotensin II in the N-KO
model may partly explain the elevated blood pressure,
since previous work has demonstrated that elevated renal
levels of angiotensin II are critical for the hypertensive
response to angiotensin II.20,21 Both previous study of
N-KO mice, and the data presented in the present report,
show no significant difference in blood levels of angioten-
sin II in N-KO versus WT mice.13 Thus, some other
mechanism must be responsible for enhanced renal accu-
mulation of angiotensin II in a low renin environment. One
possibility, suggested by the literature, is differences in
intratubular generation of angiotensin II.22,23
In addition to the contribution of renal angiotensin II, we
believe an additional influence is differences in the inflam-
matory milieu present in N-KO versus C-KO or WT mice.
N-KO mice show both in vitro and in vivo evidence for
elevated production of TNF␣ and other cytokines gener-
ally associated with an increased inflammatory response.
This was seen in response to in vitro stimulation with LPS
and also in peritoneal macrophages collected after the
2-week infusion of angiotensin II. There is now substantial
evidence that a significant part of blood pressure elevation
seen in response to angiotensin II infusion is due to
immune activation.9 Thus, the enhanced macrophage pro-
inflammatory cytokine production in N-KO mice exposed
to angiotensin II is a second physiological explanation for
why these mice have an exaggerated blood pressure
response.
One obvious difference between N-KO and WT mice is
that N-KO mice have chronically elevated AcSDKP lev-
els.13 AcSDKP is 1 of 4 peptides reported to be specific
substrates of the ACE N-domain (AcSDKP, angiotensin
1–7, LH-RH, amyloid 1–42).24,25 AcSDKP is produced
by the enzyme POP, which can be inhibited by the
pharmaceutical S-17092, a very specific POP inhibitor.6
We treated N-KO mice with S-17092, using conditions
previously shown to reduce plasma AcSDKP levels to WT
levels.19 With POP inhibition, N-KO macrophage produc-
tion of TNF␣ in response to LPS was restored to WT
levels. Further, POP inhibition reduced the angiotensin
II–mediated elevation of blood pressure in N-KO mice to
the levels seen in WT mice. However, we were unable to
establish that AcSDKP was the cause of the N-KO pheno-
type. Specifically, when N-KO mice were treated with
90
100
110
120
130
140
150
160
170
180
0 5 7 10 14
Day
Bloodpressure(mmHg)
N-KO Ang II + S-17092
N-KO Ang II + S-17092 + AcSDKP
Figure 6. Effects of acetyl-SerAspLysPro
(AcSDKP) on blood pressure and inflammation.
N-knockout (KO) mice were all treated with angio-
tensin (Ang) II and S-17092. One group also
received 1.5 mg/kg per day AcSDKP by mini-
pump. nϭ5 per group. By Student t test, PϾ0.05
for all days.
288 Hypertension February 2012
at Cedars-Sinai Medical Center on February 8, 2012http://hyper.ahajournals.org/Downloaded from
8. angiotensin II, S-17092, and AcSDKP, no increase in the
blood pressure response was observed as compared with
mice treated with angiotensin II and S-17092 but without
AcSDKP. Further, AcSDKP supplementation did not af-
fect peritoneal macrophage production of TNF␣. Previous
published work showed that the short term administration
of AcSDKP was associated with a reduced fibrotic re-
sponse and not with any type of proinflammatory re-
sponse.26 Thus, our data and previous published findings
are consistent in indicating that the elevated AcSDKP
levels in N-KO mice are not the primary cause of the
N-KO phenotype. Of the other known ACE N-terminal–
specific substrates, none appear to be good candidates to
explain the N-KO data. Angiotensin 1–7 is generally
considered a vasodilator. LH-RH and  amyloid are not
suspected of influencing blood pressure effects.
POP is a 710-residue serine endopeptidase that is widely
distributed in tissues.18 The renal cortex is particularly rich
in this enzyme. Although POP was discovered in human
uterus through its ability to degrade oxytocin, the enzyme
is thought to be active on several peptides, including
angiotensin I and angiotensin II (releasing angiotensin
1–7), bradykinin, and vasopressin. Several studies have
implicated POP in central nervous system function, includ-
ing learning and memory, and this has led to the develop-
ment of several specific and high-affinity inhibitors.6 For
example, S-17092 was shown to have a Ki for POP of 1.3
nmol/L in the rat and to not inhibit several other pepti-
dases, including aminopeptidase M, dipeptidylpeptidase
IV, neprilysin, endopeptidases 3.4.24.15 and 3.4.24.16,
calpains, and ACE. Although there has been some specu-
lation about a role of POP in blood pressure control, there
has been little experimentation addressing this topic.27
POP knockout mice have been created, but their blood
pressure was not reported.28 Our data are notable for the
difference in effect between N-KO and WT mice treated
with a POP inhibitor; the blood pressure–lowering effect is
far more pronounced in the N-KO. To us, this implies an
important balance between the actions of POP and ACE.
One well-recognized product of POP is AcSDKP, which is
destroyed by ACE. However, this does not appear to be the
cause of the N-KO phenotype. We conclude that other POP
products must also interact with the ACE N-terminus.
Perspectives
The lack of ACE N-terminal activity is associated with an
exaggerated blood pressure response to angiotensin II, and an
increased proinflammatory immune response to lipopolysac-
charide or angiotensin II, as compared with WT or C-KO
mice. These data underline important physiologic differences
in the function of the 2 catalytic domains of ACE, a novel
finding. All commonly used ACE inhibitors block catalytic
activity of both ACE domains; once we understand the
actions of the ACE N- and C-terminal domains, there may be
clinical implications of ACE site-specific inhibition, which
may ultimately translate into new treatment strategies using
site-specific ACE inhibitors.
Acknowledgments
We thank Dr Denis Guedin, Institut de Recherche Servier, France,
for his generous gift of S-17092. Ellen A. Bernstein, Tea Janjulia,
and Brian L. Taylor provided technical assistance. F.S.O. thanks Dr
Jane Z. Kuo for technical and statistical assistance.
Sources of Funding
This work was supported by National Institutes of Health grant T32
DK007770 (F.S.O., W.-L.B.B.), F32 HL105036 (F.S.O.), K99
HL088000 (S.F.), K99 DK083455 (R.A.G.-V.), R01 DK039777, and
R01 HL110353 (K.E.B.). D.C. is recipient of a Senior Research
Fellowships from the National Health and Medical Research Council
of Australia (Grant ID 395508).
Disclosures
None.
References
1. Soubrier F, Alhenc-Gelas F, Hubert C, Allegrini J, John M, Tregear G,
Corvol P. Two putative active centers in human angiotensin I-converting
enzyme revealed by molecular cloning. Proc Natl Acad Sci U S A. 1988;
85:9386–9390.
2. Bernstein KE, Martin BM, Edwards AS, Bernstein EA. Mouse angioten-
sin I-converting enzyme is a protein composed of two homologous
domains. J Biol Chem. 1989;264:11945–11951.
3. Wei L, Alhenc-Gelas F, Corvol P, Clauser E. The two homologous
domains of human angiotensin I-converting enzyme are both catalytically
active. J Biol Chem. 1991;266:9002–9008.
4. Rousseau A, Michaud A, Chauvet MT, Lenfant M, Corvol P. The hemo-
regulatory peptide N-acetyl-Ser-Asp-Lys-Pro is a natural and specific
substrate of the N-terminal active site of human angiotensin-converting
enzyme. J Biol Chem. 1995;270:3656–3661.
5. Sosne G, Qiu P, Goldstein AL, Wheater M. Biological activities of thymosin
beta4 defined by active sites in short peptide sequences. FASEB J. 2010;24:
2144–2151.
6. Lawandi J, Gerber-Lemaire S, Juillerat-Jeanneret L, Moitessier N. Inhib-
itors of prolyl oligopeptidases for the therapy of human diseases: defining
diseases and inhibitors. J Med Chem. 2010;53:3423–3438.
7. Harrison DG, Vinh A, Lob H, Madhur MS. Role of the adaptive immune
system in hypertension. Curr Opin Pharmacol. 2010;10:203–207.
8. Shi P, Diez-Freire C, Jun JY, Qi Y, Katovich MJ, Li Q, Sriramula S,
Francis J, Sumners C, Raizada MK. Brain microglial cytokines in neu-
rogenic hypertension. Hypertension. 2010;56:297–303.
9. Guzik TJ, Hoch NE, Brown KA, McCann LA, Rahman A, Dikalov S,
Goronzy J, Weyand C, Harrison DG. Role of the T cell in the genesis of
angiotensin II induced hypertension and vascular dysfunction. J Exp Med.
2007;204:2449–2460.
10. Harrison DG, Guzik TJ, Lob HE, Madhur MS, Marvar PJ, Thabet SR,
Vinh A, Weyand CM. Inflammation, immunity, and hypertension.
Hypertension. 2011;57:132–140.
11. Sriramula S, Haque M, Majid DS, Francis J. Involvement of tumor
necrosis factor-alpha in angiotensin II-mediated effects on salt appetite,
hypertension, and cardiac hypertrophy. Hypertension. 2008;51:
1345–1351.
12. Lee DL, Sturgis LC, Labazi H, Osborne JB Jr, Fleming C, Pollock JS,
Manhiani M, Imig JD, Brands MW. Angiotensin II hypertension is
attenuated in interleukin-6 knockout mice. Am J Physiol Heart Circ
Physiol. 2006;290:H935–HH940.
13. Fuchs S, Xiao HD, Adams JW, Frenzel K, Keshelava G, Capecchi MR,
Corvol P, Bernstein KE. Role of the N-terminal catalytic domain of ACE
investigated by targeted inactivation in mice. J Biol Chem. 2004;279:
15946–15953.
14. Fuchs S, Xiao HD, Michaud A, Campbell DJ, Hubert C, Capecchi MR,
Corvol P, Bernstein KE. The ACE C-terminal catalytic domain is the
main site of angiotensin I cleavage in vivo. Hypertension. 2008;51:
267–274.
15. Kawada N, Imai E, Karber A, Welch WJ, Wilcox CS. A mouse model of
angiotensin II slow pressor response: role of oxidative stress. J Am Soc
Nephrol. 2002;13:2860–2868.
16. Deddish PA, Marcic B, Jackman HL, Wang HZ, Skidgel RA, Erdo¨s EG.
N-domain-specific substrate and C-domain inhibitors of angiotensin-
converting enzyme: angiotensin-(1–7) and keto-ACE. Hypertension.
1998;31:912–917.
Ong et al Ang II Hypertension in Mice Lacking ACE N Domain 289
at Cedars-Sinai Medical Center on February 8, 2012http://hyper.ahajournals.org/Downloaded from
9. 17. Barelli H, Petit A, Hirsch E, Wilk S, De Nanteuil G, Morain P, Checler
F. S 17092–1, a highly potent, specific and cell permeant inhibitor of
human proline endopeptidase. Biochem Biophys Res Commun. 1999;257:
657–661.
18. Szeltner Z, Polga´r L. Structure, function and biological relevance of
prolyl oligopeptidase. Curr Protein Pept Sci. 2008;9:96–107.
19. Li P, Xiao HD, Xu J, Ong FS, Kwon M, Roman J, Gal A, Bernstein KE,
Fuchs S. Angiotensin-converting enzyme N-terminal inactivation alle-
viates bleomycin-induced lung injury. Am J Pathol. 2010;177:
1113–1121.
20. Crowley SD, Gurley SB, Herrera MJ, Ruiz P, Griffiths R, Kumar AP,
Kim HS, Smithies O, Le TH, Coffman TM. Angiotensin II causes hyper-
tension and cardiac hypertrophy through its receptors in the kidney. Proc
Natl Acad Sci U S A. 2006;103:17985–17990.
21. Gonzalez-Villalobos RA, Satou R, Seth DM, Semprun-Prieto LC, Kat-
surada A, Kobori H, Navar LG. Angiotensin-converting enzyme-derived
angiotensin II formation during angiotensin II-induced hypertension.
Hypertension. 2009;53:351–355.
22. Gonzalez-Villalobos RA, Billet S, Kim C, Satou R, Fuchs S, Bernstein
KE, Navar LG. Intrarenal angiotensin-converting enzyme induces hyper-
tension in response to angiotensin I infusion. J Am Soc Nephrol. 2011;
22:449–459.
23. Navar LG, Kobori H, Prieto MC, Gonzalez-Villalobos RA. Intratubular
renin-angiotensin system in hypertension. Hypertension. 2011;57:
355–362.
24. Acharya KR, Sturrock ED, Riordan JF, Ehlers MR. ACE revisited: a new
target for structure-based drug design. Nat Rev Drug Discov. 2003;2:
891–902.
25. Zou K, Maeda T, Watanabe A, Liu J, Liu S, Oba R, Satoh Y, Komano H,
Michikawa M. Abeta42-to-Abeta40- and angiotensin-converting
activities in different domains of angiotensin-converting enzyme. J Biol
Chem. 2009;284:31914–31920.
26. Lin CX, Rhaleb NE, Yang XP, Liao TD, D’Ambrosio MA, Carretero OA.
Prevention of aortic fibrosis by N-acetyl-seryl-aspartyl-lysyl-proline in
angiotensin II-induced hypertension. Am J Physiol Heart Circ Physiol.
2008;295:H1253–HH1261.
27. Goossens F, De Meester I, Vanhoof G, Scharpe´ S. Distribution of prolyl
oligopeptidase in human peripheral tissues and body fluids. Eur J Clin
Chem Clin Biochem. 1996;34:17–22.
28. Di Daniel E, Glover CP, Grot E, Chan MK, Sanderson TH, White JH,
Ellis CL, Gallagher KT, Uney J, Thomas J, Maycox PR, Mudge AW.
Prolyl oligopeptidase binds to GAP-43 and functions without its pep-
tidase activity. Mol Cell Neurosci. 2009;41:373–382.
290 Hypertension February 2012
at Cedars-Sinai Medical Center on February 8, 2012http://hyper.ahajournals.org/Downloaded from
10. Online Supplement
INCREASED ANGIOTENSIN II INDUCED HYPERTENSION AND INFLAMMATORY
CYTOKINES IN MICE LACKING ANGIOTENSIN CONVERTING ENZYME N DOMAIN
ACTIVITY
Frank S. Ong1,2
, Chentao X. Lin1,3
, Duncan J. Campbell4
, Derick Okwan-Duodu 1
, Xu
Chen1,3
, Wendell-Lamar B. Blackwell1
, Kandarp H. Shah1
, Romer A. Gonzalez-Villalobos1,5
,
Xiao Z. Shen1,5
, Sebastien Fuchs*1,5
and Kenneth E. Bernstein*1,5
1
Dept of Biomedical Sciences; 2
Medical Genetics Institute, and 5
Dept of Pathology and
Laboratory Medicine, Cedars-Sinai Medical Center, Los Angeles, CA 90048; 3
Current
address: Department of Immunology, Institute of Biotechnology, Fujian Academy of
Agricultural Sciences, Fuzhou, Fujian, 350003, China; 4
St. Vincent’s Institute of Medical
Research and the Department of Medicine, University of Melbourne, St. Vincent's Health,
Fitzroy, Australia.
*denotes equal corresponding authorship
Corresponding author and reprint request: Kenneth E. Bernstein, MD, Cedars-Sinai
Medical Center, Rm 2021 Davis Bldg, 110 N George Burns Rd, Los Angeles CA 90048.
E-mail: Kenneth.Bernstein@cshs.org. Tel: 310-423-7562, Fax: 310-423-7331
at Cedars-Sinai Medical Center on February 8, 2012http://hyper.ahajournals.org/Downloaded from
11. Detailed Methods
Materials. LPS (Escherichia coli 055:B5) was from Sigma-Aldrich (St. Louis, MO). The
prolyl oligopeptidase inhibitor S-17092 was a generous gift from Servier (Suresnes,
France). Anti-mouse IL-10 functional grade purified antibody was from eBioscience (San
Diego, CA). Murine tumor necrosis factor α (TNFα), IL-10 and IL-12/p40 ELISA kits were
purchased from eBioscience (San Diego, CA) and used according to manufacturer's
instructions.
Mice. The generation of mice expressing site-inactivated ACE was previously described in
detail.1,2
Briefly, N-KO mice express a full length ACE protein where the N-terminal
catalytic site was inactivated by mutating the two zinc-binding histidines (395H and 399H)
to lysines. In the C-KO strain, 993H and 997H, which are responsible for the zinc binding
and catalytic activity of the C-terminal enzymatic site, were mutated to lysine. During the
back breeding of mice to C57BL/6, animals were selected for mating so that all mice
possess only a single renin gene (Ren-1c). 8 to 12-week old N-KO, C-KO or wild-type
littermates were used. Animal breeding and experimental procedures were approved by
Cedars-Sinai Medical Center Institutional Animal Care and Use Committee.
Peptide measurement. Mice were anesthetized and blood was collected from the inferior
vena cava directly into a syringe containing 5 ml of 4 mol/l guanidine thiocyanate using a
25-gauge needle. The left kidney was then rapidly removed and homogenized in 5 ml of 4
4 mol/l guanidine thiocyanate. The blood and tissue homogenates were frozen and stored
at -80°C until shipped on dry ice to St. Vincent's Institute of Medical Research, where
peptide measurements were performed. Peptides were measured using HPLC-based
radioimmunoassays, as previously described.3
Blood pressure. Systolic blood pressures were measured as previously described.4
Briefly, blood pressure was measured in conscious mice using a Visitech Systems
BP2000-automated tail-cuff system. Mice were trained for several days before data
aquisition. On each day that blood pressure was determined, 20 measurements were
collected and averaged to calculate the pressure.
Angiotensin II administration. Angiotensin II (Bachem AG) at the dose of 980 ng/kg/min
was infused via osmotic mini-pumps (Alzet model 1002). The mini-pumps were implanted
subcutaneously between the scapulas following manufacturer's instructions. Angiotensin II
was infused for either 14 or 21 day. At the end of the experiment, the mice were sacrificed
by CO2 inhalation and cervical dislocation.
Flow cytometry and cytokine determination. To measure cytokine expression,
peritoneal cells were collected and cultured for 5 hrs with 5 µg/ml brefeldin A. Cells were
surface-stained with FITC-conjugated anti-F4/80 (BioLegend) followed by intracellular
staining of APC-conjugated anti-TNFα (eBioscience) with fixation and permeabilization
buffer (eBioscience). The stained samples were analyzed on a Beckman Coulter CyAn
ADP and data were analyzed with FlowJo software.
Peritoneal macrophage extraction. Thioglycollate-elicited peritoneal exudates were
collected via peritoneal lavage 4 days after a 2 ml intraperitoneal injection of 3%
thioglycollate broth. 1x10⁶
/ml cells were cultured at 37°C, 5% CO2 in RPMI 1640 medium
enriched with 10% fetal calf serum, 50 µM 2-ME, 0.5 mM sodium pyruvate, 10 mM HEPES
buffer, 50 units/ml penicillin, 50 µg/ml streptomycin, and 2mM L-glutamine. For purification
of macrophages, peritoneal exudates were allowed to adhere for 2 h, after which
at Cedars-Sinai Medical Center on February 8, 2012http://hyper.ahajournals.org/Downloaded from
12. non-adherent cells were removed with phosphate buffered saline (PBS) to achieve a
>95% purity of macrophages. For flow cytometry assay, peritoneal exudates were cultured
in Costar low adherence culture plates. Then, the macrophages were cultured as above
with or without lipopolysaccharide (LPS, 1 mg/ml) for 18 h. The concentration of TNFα,
IL-10, and IL-12/p40 in the supernatant was determined by ELISA. In Fig. 6a, daily
intraperitoneal S-17092 (40 mg/kg) was given was given for 4 days.
POP inhibition with S-17092. The specific POP inhibitor S-17092 was administered daily
to mice IP at a dose of 10 mg/kg in normal saline from a freshly prepared solution. For in
vitro experiments, injection of S-17092 began 4 days before the collection of thioglycollate-
induced peritoneal macrophages. The macrophages were carefully counted to verify that
the yield of macrophages was not affected by S-17092. For in vivo inhibition of POP, S-
17092 administration began four days before angiotensin II mini-pump implantation and
continued daily until the mice were sacrificed.
In vivo LPS challenge. Mice were injected intraperitoneally with 45 mg/kg of LPS in
sterile PBS, and blood was collected 60 min, 90 min, and 120 min after injection. TNFα
concentration in sera was measured by ELISA.
Statistics. All results are expressed as mean ± SEM, with p<0.05 considered statistically
significant. Unless otherwise stated, one-way ANOVA analysis with a Tukey correction
was used to analyze significance between groups. For analysis of angiotensin 1-7 levels,
data was analyzed using two-way ANOVA taking into account the interaction between
genotype and time. Where indicated, we use a two tailed Student's t-test.
Online Supplement References
1. Fuchs S, Xiao HD, Adams JW, Frenzel K, Keshelava G, Capecchi MR, Corvol P,
Bernstein KE. Role of the N-terminal catalytic domain of ACE investigated by targeted
inactivation in mice. J Biol Chem. 2004;279:15946-15953.
2. Fuchs S, Xiao HD, Michaud A, Campbell DJ, Hubert C, Capecchi MR, Corvol P,
Bernstein KE. The ACE C-terminal catalytic domain is the main site of angiotensin I
cleavage in vivo. Hypertension. 2008;51:267-274.
3. Campbell, DJ, Kladis, A, Duncan, A-M, Lawrence AC, Strategies for measurement of
angiotensin and bradykinin peptides and their metabolites in central nervous system and
other tissues. Methods in Neurosciences. 1995;23:328-343.
4. Krege JH, Hodgin JB, Hagaman JR, Smithies O. A noninvasive computerized tail-cuff
system for measuring blood pressure in mice. Hypertension. 1995;25:1111-1115.
at Cedars-Sinai Medical Center on February 8, 2012http://hyper.ahajournals.org/Downloaded from
13. S1. Angiotensin 1-7 and bradykinin peptide levels.
S1. Angiotensin I-7 and bradykinin were measured in the blood and kidney of N-KO, C-KO
and WT mice before and after infusion of angiotensin II for 14 days.
On day 0, no significant differences in blood or renal angiotensin 1-7 were found in WT, N-
KO or C-KO mice. With the infusion of angiotensin II, there was a rise in angiotensin 1-7
levels, with the slope of the rise being greatest for the N-KO group. However, by 2-way
ANOVA, taking into account the interaction of time and genotype, there were no significant
differences between the groups. Also, on day 14, there were no significant differences by
1-way ANOVA. There was no significant difference in blood or kidney bradykinin levels
between the 3 groups of mice. For both angiotensin 1-7 and bradykinin, the number of
mice studied on day 0 was 12, 6 and 12 for N-KO, C-KO and WT, while for day 14 the
number of mice studied was 17, 12 and 15 for N-KO, C-KO and WT. Blood levels of
peptide are fmol/ml, while kidney levels are fmol/g.
0
2
4
6
8
10
day 0 day 14
fmol/ml
N-KO
Blood Ang I-7
C-KO
WT
Kidney Ang 1-7
0
20
40
60
80
100
120
140
160
day 0 day 14
fmol/g
N-KO
C-KO
WT
Blood BK 1-9
0
5
10
15
20
25
30
C-KO
N-KO
WT
Kidney BK 1-9
0
20
40
60
80
100
120
140
160
C-KO
N-KO
WT
day 0 day 14fmol/ml
day 0 day 14
fmol/g
at Cedars-Sinai Medical Center on February 8, 2012http://hyper.ahajournals.org/Downloaded from
14. S2. Time course of TNFα expression.
S2. Peritoneal macrophages from N-KO, C-KO and WT mice were collected after
thioglycollate injection and cultured with LPS. At the indicated times after LPS addition,
the concentration of TNFα was measured by ELISA (n=3 per point).
0
5
10
15
20
25
30
0h 1h 2h 4h 8h 12h 18h 24h
TNFαng/ml
N-KO
WT
C-KO
at Cedars-Sinai Medical Center on February 8, 2012http://hyper.ahajournals.org/Downloaded from
15. S3. Macrophage cytokine response to LPS
IL-12 IL-10
S3. Peritoneal macrophages from N-KO, C-KO and WT mice were collected after
thioglycollate injection. After purification, the macrophages were cultured with LPS for 18
hrs. The concentration of IL-12 (left) or IL-10 (right) was then determined. Cells from N-
KO mice make significantly more IL-12 than from the other groups (p<0.02). N-KO cells
make less of the inhibitory IL-10. While p values by Student’s t test were significant (N-KO
vs WT: 0.03; N-KO vs C-KO: 0.05), these values were not significant by one way ANOVA
with the Tukey correction (N-KO vs WT: 0.07; N-KO vs C-KO: 0.14).
0
5000
10000
15000
20000
WT N-KO C-KO
IL-12p40(pg/ml)
0
100
200
300
400
500
600
700
800
900
1000
IL-10(pg/ml)
WT N-KO C-KO
at Cedars-Sinai Medical Center on February 8, 2012http://hyper.ahajournals.org/Downloaded from
16. S4. Effect of AcSDKP on blood pressure in WT mice treated with angiotensin II
S4. WT mice were treated with angiotensin II (Ë), angiotensin II + 0.5 mg/kg/day AcSDKP
(#), angiotensin II + 1.5 mg/kg/day AcSDKP (•), and angiotensin II + 3.0 mg/kg/day
AcSDKP (!) via minipump. Blood pressure was measured on days 5, 7, 10, and 14 after
implantation. The figure shows the group means and SEM. No significant differences
were observed. n=10 per group.
90
100
110
120
130
140
150
160
170
180
0 5 7 10 14
Days
Bloodpressure(mmHg)
WT Ang IIWT Ang II+0.5 AcSDKP
WT Ang II+1.5 AcSDKP
WT Ang II+3.0 AcSDKP
at Cedars-Sinai Medical Center on February 8, 2012http://hyper.ahajournals.org/Downloaded from