SlideShare a Scribd company logo
1 of 4
Download to read offline
Heathrow**
+2%
16.4mn pax
East II ext.of the 407ETR
Financing & commercial close
CAD880mn investment
30Y maturity since opening (2017E).
IR Department e: ir@ferrovial.com -  +34 915862730 1
ferrovialResults - Executive summary
January – March 2015
Financing activity
Consolidated performance
Business performance
DIVIDENDS RECEIVED
ETR 407
€58mn
Heathrow
€26mn
BACKLOG
ETR 407*
+15%
CAD173mn
Services
+12%
€77mn
Heathrow*
+11%
£342mn
Construction
15%
€65mn
EBITDA
REVENUES
+10.4%
€2,147mn
EBITDA
+14.2%
€210mn
Ex-infrastructure net cash1
€1,583mn
Services: growth in all areas & magnitudes, helped by
FX (LfL revs +4.4%), with stable margins at 6.7%.
Backlog reached €23,5bn (incl JVs)
ETR407 & HAH confirm their resilience with EBITDA
+15% & +11% respectively.
Traffic at Heathrow +2.0%, at UK Regional airports
+9.3%. In toll roads, growth at all main US (Chicago
Skyway, SH130), European (Spain, Portugal & Ireland)
& Canadian toll roads (407ETR +2.4%).
NTE 1-2, opened Oct’14, In 1Q’15 reached 4m
transactions, +3.1% vs 4Q´14.
Construction saw revenues +11% mainly on the back
of Budimex (double digit growth in sales, EBITDA &
backlog). Bakclog at €8,600m (+6.3% vs Dec’14).
Solid results from good operating performance & FX
impact (€weakness). LfL revs+3% & EBITDA+6%.
Strong traffic growth in all airports & in toll roads
in Canada, US & Europe
Record high construction + services backlog at over
€32bn (including JVs).
Strong financial position & flexibility: Ferrovial has
reduced borrowing cost & extended its maturity profile.
• LHR issued c.£850mn: i.e. €750mn 15Y, 1.5%. Cost.
• ETR issued CAD150mn 30Y bonds at 3.30%.
• Increased/extended €1.3bn liquidity line (5Y, 50bps).
• Net cash (ex-infra projects) at €1,6bn.
Higher HAH & 407ETR dividends: HAH paid £75mn
(+11%), 407ETR paid CAD187.5mn (+7%). A combined
€85m for Ferrovial.
LIQUIDITY1
€4,468mn
TRAFFIC
ETR 407**
+2.4%
530mn vkt’000
1 Excluding infrastructure projects.
* Consolidated by equity method.
Services
+5%
€23,549mn
Construction
+6%
€8,600mn
Other events
Ocaña-la Roda
Deconsolidatedfrom the group
Indiana toll rad
Sold to IFM Investors
Bond issues
LHR £850mn
o/w €750mn (15Y & 1.5% coupon)
407ETR CAD150mn
(30Y, 3.30% coupon)
Shareholder remuneration
After the success of 2014 scrip dividend programme “Ferrovial Dividendo
Flexible”, it was again approved in March 2015 AGM. Ferrovial will make two
payments during 2015 equivalent to 2014 complementary and 2015 interim
dividends. The former, to be paid in May 2015, will amount to €0.304 per share.
In addition, the AGM approved a new share buy back program with a maximum of
€250mn or 18mn shares, to be executed from May 26th to November 18th 2015.
282 308
367
917
477 510
2009 2010 2011 2012 2013 2014
€million
AIRPORTSCONSTRUCTIONTOLL ROADS SERVICES
Liquidity line
Expansion and extension
€1,250mn
Cutting cost to 50pbs from the
80pbs of previous line (€750mn)
and maturity in 2020.
Glasgow
+13%
1,6mn pax
ferrovial
Revenues +12.5% mainly as a reflection of the GBP appreciation (LfL
+4.4%). EBITDA margins in line with 1Q’14. Backlog at record levels, +5.3%
vs Dec’14 (€23,549mn incl JVs)
Spain: Sales +6.7% from contracts won in 2H14 (waste collection Madrid). EBITDA
margins improved from higher contribution from contracts which began in 1Q’14.
Backlog including JV -1.6% at €6,625mn.
UK: 15% revenue growth driven by GBP appreciation (LfL +2,4%). EBITDA margin
(4.7%) in line with 1Q’14 though impacted by seasonality (bad weather in 1Q), new
project start-up costs & higher costs related to the finalization of the investment
phase in the Birmingham contract.Backlog including JV +8.2% at €16,554mn.
International: This division includes mainly Chile (€15mn), Portugal (€6mn) & Poland
(€4mn) showinga revenueincreaseof +43% (+35,6% LfL).
Services
Revenues
+12.5%
1,162mn
EBITDA
+12.0%
77mn/6.7%
Backlog
+5.3%
23,549mn
Toll roads
Airports
Double-digit growth in revenues (+24%), EBITDA (+29%) & EBIT (+30%),
reported & LfL. Solid traffic growth in key assets on better weather vs 1Q’14
(US & Canada), Easter holidays in March (Spain & Portugal), lower oil prices
& economic recovery since 2H’14. Growth in traffic despite strong increases
in tariffs at Chicago Skyway (+4,6% with +13,2% in tariffs) & ETR407
(+2,4% with c.+10% in tariffs).
NTE 1-2: 6 months in operation.Traffic +3%, revenues +47% vs 4Q’14.
ITR: sold to IFM Investors for $5,725mn ($50m inflow for Ferrovial in 2015E).
Ocaña-La Roda: deconsolidated from Ferrovial’s accounts with effect from
Feb’14 leading to a capital gain of €63.7mn (reversal of impairments).
Developingassets:
LBJ: 98% of constructionis now complete, opening expected Summer 2015.
NTE 35W:Work is on schedule,opening expected mid-2018.
407 East I: 58% of constructionis complete.
A66 Benavente-Zamora:95% of constructionis complete.
Revenues
+23.9%
113mn
EBITDA
+28.6%
71mn /62.6%
The contribution made by HAH to Ferrovial’s Equity-accounted results in
1Q’15 is €7mn vs €2mn in 2014.
Heathrow: Strongperformanceon traffic (+2.0%) on the back of Easter holidays
falling in March,an increasein the number of seatsin larger aircrafts & good
performanceof new destinations& routesstartedin 2014.
Revenues +8% from +9.3% aeronautical (tariffs up by +11.3% Jul’14) & +6,4% retail
revenues.EBITDA +7,2% with margins maintainedat 55%.
• Record passengersatisfaction(82% rate their experienceas very good or excellent).
• “Best Airport in WesternEurope” (2015)
• “Best Airport for Shopping” (2015 - 6th consecutiveyear)
• T5 “Best Airport Terminal in the World” (2015) by Skytrax World Airports Awards
UK Regional airports: traffic +9.3%, 2.8mn passengers. Revenues +7% and EBITDA
+12,9% to £11mn.
Revenues (HAH)
+8.3%
£623mn
EBITDA (HAH)
+11.0%
£342mn/54.9%
Ferrovial controls 25% of HAH (Heathrow) & 50% of AGS
Consolidated by equity method
Debt
£13.1bn
RAB £14.8bn
* Consolidated by equity method **Ausol I
Revenues +11.1% (+3.8% LfL), mainly due to strong growth at Budimex,
which also supported strong growth at LfL EBITDA (+7.7%). International
turnover represents 72% of revenues. Backlog +6.3% vs Dec’14 although
stable LfL, with 80% from Civil Works..
F. Agroman: Revenues Lfl +3,5% supported mainly by continuous growth in
traditional markets.
Budimex: Revenues & EBITDA LfL growths of +20.9% & +76.5%, respectively,
mainly on materials & subcontractors cost reduction, and disposal of non strategic
assets.Strong growth in Backlog (+10%, +4.7% LfL) to €1,568mn vs Dec’14.
Webber: revenues +7.6% or -13% LfL, mainly due to NTE managed lane finalization
& adverse weather conditions in Dallas. Profitability still at high levels although lower
than 2014. Lack of new large awards & high execution levels result in -10,5% fall in
Backlog (local FX).
Revenues
+11.1%
883mn
EBITDA
+15.1%
65mn/7.4%
Backlog
+6.3%
8,600mn
Construction
+15.1%
737mn
+43.0%
25mn
n.s.
2mn/6.4%
+6.7%
400mn
+7.6%
41mn/10.4%
Revenues EBITDA Backlog
+13.7%
34mn/4.7%
+10.7%
371mn
(1.6)%
6,625mn
+8.2%
16,554mn
Spain
UK
International
IR Department e: ir@ferrovial.com -  +34 915862730 2
Revenues EBITDA Backlog
+7.6%
149mn
(5.6)%
8mn/5.3%
+0.9%
889mn
+8.0%
524mn
+8.5%
45mn/8.5%
+6.2%
6,143mn
+22.5%
211mn
+79.4%
12mn/5.9%
+10.0%
1,568mn
F. Agroman (RoW)
Budimex (Poland)
Webber (USA)
Glasgow
Heathrow +2.0%
16.4mn
+8.0%
622mn
Traffic Revenues EBITDA
+7.2%
342mn/55.0%
+13.2%
1.6mn
+7.8%
20mn
+32.2%
5mn/26.0%
Aberdeen (0.7)%
0.8mn
+4.8%
15mn
+6.4%
5mn/32.8%
Southampton +16.5%
0.4mn
+10.0%
6mn
+87.4%
1mn/21.8%
Chicago Skyway (55%) 4.6%
34,006
1.3mn
Ausol** (80%) +11.5%
10,156
+13.9%
8mn
0.5mn
M4 (66%) +5.2%
25,444
+5.9%
5mn
0.1mn
407ETR* (43%) +2.4%
530mn VKT
+25.1%
153mn
4.5mn
Traffic Revenues EBITDA Net debt €
+46.6%
18mn
+ 16.2%
6mn/75.1%
+5.2%
4mn/69.2%
+24.3%
123mn/80.6%
+46.7%
15mn/83.5%
Algarve (85%) +11.7%
6,598
+2.5%
10mn
0.1mn+1.2%
9mn/88.7%
1Q’15
€mn
€mn
£ mn
• Net debt (cash) structure total
ferrovial
Fixed
Assets
20.3bn
Balance sheet
Current
Assets
6.6bn
26.9bn
Equity
6.3bn
Non current
Liabilities & others
14.2bn
Current
Liabilities
5.2bn
Gross cash (3.2)bn
• Ex.Infrastructure Projects
Net cash (1.6)bn
Gross debt 1.6bn
Ex.Infrastructure Projects (1.6)bn
Infrastructure Projects 8.0bn
Debt maturity calendarcorporate
55mn
2015
33mn
2016
10mn
2017
Liquidity position
Total cash
3.2bn
Total liquidity 4.5bn
Undrawn lines
1.3bn
1.5bn
2018+
Strong balance sheet and liquidity position to finance future
growth opportunities.
At the end of 1Q’15, Ferrovial’s net cash position, excluding
infrastructure projects, amounted to EUR1,583mn. The
dividends received from projects reached €90mn (€84mn in
1Q’14).
Corporate rating
IR Department e: ir@ferrovial.com -  +34 915862730
82%
Bonds
BBB / stableFitch (last upgrade July 2014)
BBB / stableStandard & Poor’s (last upgrade May 2013)
Total
Net debt 6.4bn
1Q’15
€mn
Deferred income
1.1bn
ferrovialHuman resources
Spain
54%
America
4%
UK
27%
Poland
6%
RoW
9%
Environment
Lower energy consumption
-38.6% Reduction of greenhouse gas emissions
2009 – 2014:
Management of
new business
opportunities
Priorities
Say on pay
IR Department e: ir@ferrovial.com -  +34 915862730 4
FER turnoverindex:3,6%.
8 /10 employees would recommend FER as a good company to work for.
• For the last 14 consecutive years, Ferrovial has been included in the DJSI (Dow
Jones SustainabilityIndex)
• Ferrovial has been included in Climate Performance Leadership Index (CPLI) &
Climate Disclosure Leadership Index (CDLI) from the Carbon Disclosure Project
(CDP), with the maximum mark (100A.)
• Ferrovial leads the Supplier Climate Performance Leadership Index (SCPLI), by CDP,
with a maximum A rating. CDP is investors’ main reference for evaluating how
companies deal with the risks and opportunitiesrelated to climate change.
Innovation
R&D Investment (€m)
2014 2013 2012 2011 2010
42.6 32.9 32.6 51.32 45
636
Participants
677
Ideas
45%
teams
MADRID SMART LAB
The City Competition Centre links as equals the local council, the entrepreneur and
the services company. As a result 59 proposals submitted: 31 Mobility proposals and
28 Quality of life
1
Risk management &
environmental
responsibility 2
FY2014
€mn
Increase of c.30% of R&D Investment in 2014, including the development of over
100 projects. This demonstrates Ferrovial’s commitment towards innovation as
sourceof growth and value creation
NATIONAL INNOVATION AWARD
Ferrovial was awarded the National Innovation and Design award, given by the
Economy and Competition ministry (Ministerio de Economía y Competitividad), who
valued the presence of innovation in Ferrovial’s fields of activity, its open innovation
model, its commitment to promoting talent and leadership in large international
projects
PROJECTS WITH MIT
The “System for Waste Separation and Evaluation” project started with the objective
of improving the operations and design of the urban waste separation and treatment
plants.
FERROVIAL INNOVATION AWARDS
Inviting its employees to offer solutions to four challenges ,one for each business unit.
The results of this secondedition are:
80.000
90.000
100.000
110.000
120.000
130.000
300.000
320.000
340.000
360.000
380.000
400.000
420.000
2009 2010 2011 2012 2013 2014
Fossil fuels Electricity
70%
MALE
30%
FEMALE
69,088
Workforce
43.3 43.8AVERAGE AGE
8.9 9.5YEARS OF SENIORITY
77% 81%PERMANENT CONTRACT
85% 15%MANAGEMENT
2.9% 0.6%ROTATION INDEX
67% 33%NEW RECRUITMENTS
Strong commitment to improve health & safety polices
Total TrainingHours 1,281,414
Hoursper employee 19
Investmentper employee 258 €
% of the Co revenue 0.20%
Talent management: Through
consolidated evaluation processes, such
as 360º feedback, competencies
assessment and talent management
reviews.
Succession Planning: 700 people
assessment to identify 264 successors for
133 key management positions.
Compensation:Total reward policy
equitable and competitive: Fixed and
variable remuneration plus long-term
incentives. Flexible remuneration
including products & services, subject to
employee personal & economic needs
Opportunities based on merit:
Distinguished Equal Opportunities
Company award in 2010, which
remainsin force until 2016.
Present in 22countries
Acknowledgements
17% of electricity consumed by Ferrovial came from renewable
sources (100% in the case of Amey)
2014: balanced contribution between fixed, variable
and long term incentives:
Metrics of The Long Term Incentive Grant 2014 are a mix of: EBITDA
/ Net Productive Asset , Cash Flow , TSR *
in comparisonwith 16 internationallisted companies:
*ACS, OHL, FCC, Abertis, Serco, Carrillion, Vinci, Skanska, Strabag, Eiffage, Balfour Beatty,
Bilfinger Berger, SNC Lavalin, Transurban, ADP, Fraport.
21%
Fixed
39%
Variable
40%
Long Term incentives
2011 Grant
Ferrovial compares with IBEX35 and is in the average
compensation of that group.
Euros
0 200,000 400,000
Percentile75
0-25%il
25-50%il
50-75%il
75-90%il
Percentile25 Percentile90
Mean
Media
ferrovial
Board remuneration non executive
President & CEO remuneration as executives
Source: Towers Watson
tCO2eqtCO2eq

More Related Content

What's hot

Ferrovial Integrated Annual Report 2015
Ferrovial Integrated Annual Report 2015Ferrovial Integrated Annual Report 2015
Ferrovial Integrated Annual Report 2015Ferrovial
 
Ferrovial Financial Results Jan Dec 2015
Ferrovial Financial Results Jan Dec 2015Ferrovial Financial Results Jan Dec 2015
Ferrovial Financial Results Jan Dec 2015Ferrovial
 
January - December 2012 results
January - December 2012 resultsJanuary - December 2012 results
January - December 2012 resultsFerrovial
 
Ferrovial: Investor Presentation Jan Jun 2014 | Presentación Inversores Ene J...
Ferrovial: Investor Presentation Jan Jun 2014 | Presentación Inversores Ene J...Ferrovial: Investor Presentation Jan Jun 2014 | Presentación Inversores Ene J...
Ferrovial: Investor Presentation Jan Jun 2014 | Presentación Inversores Ene J...Ferrovial
 
Renato Ravanelli - F2i Investor Meeting - Milan, November 19th 2015
Renato Ravanelli - F2i Investor Meeting - Milan, November 19th 2015Renato Ravanelli - F2i Investor Meeting - Milan, November 19th 2015
Renato Ravanelli - F2i Investor Meeting - Milan, November 19th 2015Renato Ravanelli
 
Ferrovial Investors Presentation Jan Sep 2014 | Presentación Inversores Ene S...
Ferrovial Investors Presentation Jan Sep 2014 | Presentación Inversores Ene S...Ferrovial Investors Presentation Jan Sep 2014 | Presentación Inversores Ene S...
Ferrovial Investors Presentation Jan Sep 2014 | Presentación Inversores Ene S...Ferrovial
 
4 q11 results presentation
4 q11 results presentation4 q11 results presentation
4 q11 results presentationTriunfoRi
 
2i Rete Gas - Infrastructure Day 2014
2i Rete Gas - Infrastructure Day 20142i Rete Gas - Infrastructure Day 2014
2i Rete Gas - Infrastructure Day 20142i Rete Gas
 
1 q11 results presentation
1 q11 results presentation1 q11 results presentation
1 q11 results presentationTriunfoRi
 
1 t08 eng 080512-v6
1 t08 eng   080512-v61 t08 eng   080512-v6
1 t08 eng 080512-v6TriunfoRi
 
10º Foro Latibex - Madrid
10º Foro Latibex - Madrid10º Foro Latibex - Madrid
10º Foro Latibex - MadridArteris S.A.
 
Public-Private participation to improve supply chains
Public-Private participation to improve supply chainsPublic-Private participation to improve supply chains
Public-Private participation to improve supply chainsTristan Wiggill
 
Etude PwC IPO Watch Europe Q1 2014
Etude PwC IPO Watch Europe Q1 2014Etude PwC IPO Watch Europe Q1 2014
Etude PwC IPO Watch Europe Q1 2014PwC France
 
News@Facts March 2014
News@Facts March 2014News@Facts March 2014
News@Facts March 2014Snam
 
Sopra Steria Group generated revenue of €845.8 million in the third quarter o...
Sopra Steria Group generated revenue of €845.8 million in the third quarter o...Sopra Steria Group generated revenue of €845.8 million in the third quarter o...
Sopra Steria Group generated revenue of €845.8 million in the third quarter o...Sopra Steria India
 
Transport for London - Low Emission Zones
Transport for London - Low Emission ZonesTransport for London - Low Emission Zones
Transport for London - Low Emission ZonesSTEP_scotland
 
Speech 3 q11 presentation
Speech   3 q11 presentationSpeech   3 q11 presentation
Speech 3 q11 presentationTriunfoRi
 
Industrial relations / Collective bargaining - Temporary agency work and coll...
Industrial relations / Collective bargaining - Temporary agency work and coll...Industrial relations / Collective bargaining - Temporary agency work and coll...
Industrial relations / Collective bargaining - Temporary agency work and coll...Eurofound
 

What's hot (20)

Ferrovial Integrated Annual Report 2015
Ferrovial Integrated Annual Report 2015Ferrovial Integrated Annual Report 2015
Ferrovial Integrated Annual Report 2015
 
Ferrovial Financial Results Jan Dec 2015
Ferrovial Financial Results Jan Dec 2015Ferrovial Financial Results Jan Dec 2015
Ferrovial Financial Results Jan Dec 2015
 
January - December 2012 results
January - December 2012 resultsJanuary - December 2012 results
January - December 2012 results
 
Ferrovial: Investor Presentation Jan Jun 2014 | Presentación Inversores Ene J...
Ferrovial: Investor Presentation Jan Jun 2014 | Presentación Inversores Ene J...Ferrovial: Investor Presentation Jan Jun 2014 | Presentación Inversores Ene J...
Ferrovial: Investor Presentation Jan Jun 2014 | Presentación Inversores Ene J...
 
Renato Ravanelli - F2i Investor Meeting - Milan, November 19th 2015
Renato Ravanelli - F2i Investor Meeting - Milan, November 19th 2015Renato Ravanelli - F2i Investor Meeting - Milan, November 19th 2015
Renato Ravanelli - F2i Investor Meeting - Milan, November 19th 2015
 
Ferrovial Investors Presentation Jan Sep 2014 | Presentación Inversores Ene S...
Ferrovial Investors Presentation Jan Sep 2014 | Presentación Inversores Ene S...Ferrovial Investors Presentation Jan Sep 2014 | Presentación Inversores Ene S...
Ferrovial Investors Presentation Jan Sep 2014 | Presentación Inversores Ene S...
 
4 q11 results presentation
4 q11 results presentation4 q11 results presentation
4 q11 results presentation
 
2i Rete Gas - Infrastructure Day 2014
2i Rete Gas - Infrastructure Day 20142i Rete Gas - Infrastructure Day 2014
2i Rete Gas - Infrastructure Day 2014
 
1 q11 results presentation
1 q11 results presentation1 q11 results presentation
1 q11 results presentation
 
1 t08 eng 080512-v6
1 t08 eng   080512-v61 t08 eng   080512-v6
1 t08 eng 080512-v6
 
10º Foro Latibex - Madrid
10º Foro Latibex - Madrid10º Foro Latibex - Madrid
10º Foro Latibex - Madrid
 
Public-Private participation to improve supply chains
Public-Private participation to improve supply chainsPublic-Private participation to improve supply chains
Public-Private participation to improve supply chains
 
Etude PwC IPO Watch Europe Q1 2014
Etude PwC IPO Watch Europe Q1 2014Etude PwC IPO Watch Europe Q1 2014
Etude PwC IPO Watch Europe Q1 2014
 
News@Facts March 2014
News@Facts March 2014News@Facts March 2014
News@Facts March 2014
 
Sopra Steria Group generated revenue of €845.8 million in the third quarter o...
Sopra Steria Group generated revenue of €845.8 million in the third quarter o...Sopra Steria Group generated revenue of €845.8 million in the third quarter o...
Sopra Steria Group generated revenue of €845.8 million in the third quarter o...
 
Icg prelim 14
Icg prelim 14Icg prelim 14
Icg prelim 14
 
ALSTOM Financial Analysis Report
ALSTOM Financial Analysis ReportALSTOM Financial Analysis Report
ALSTOM Financial Analysis Report
 
Transport for London - Low Emission Zones
Transport for London - Low Emission ZonesTransport for London - Low Emission Zones
Transport for London - Low Emission Zones
 
Speech 3 q11 presentation
Speech   3 q11 presentationSpeech   3 q11 presentation
Speech 3 q11 presentation
 
Industrial relations / Collective bargaining - Temporary agency work and coll...
Industrial relations / Collective bargaining - Temporary agency work and coll...Industrial relations / Collective bargaining - Temporary agency work and coll...
Industrial relations / Collective bargaining - Temporary agency work and coll...
 

Viewers also liked

Construction Futures Wales - CrossRail Event
Construction Futures Wales - CrossRail EventConstruction Futures Wales - CrossRail Event
Construction Futures Wales - CrossRail EventRae Davies
 
Ferrovial Presentación Inversores 2011
Ferrovial Presentación Inversores 2011Ferrovial Presentación Inversores 2011
Ferrovial Presentación Inversores 2011Ferrovial
 
Ferrovial 2010 Results Presentation
Ferrovial 2010 Results PresentationFerrovial 2010 Results Presentation
Ferrovial 2010 Results PresentationFerrovial
 
Results Presentation 2012 | Resultados Financieros 2012
Results Presentation 2012 | Resultados Financieros 2012Results Presentation 2012 | Resultados Financieros 2012
Results Presentation 2012 | Resultados Financieros 2012Ferrovial
 
Ferrovial Executive Summary Jan Dec 2014
Ferrovial Executive Summary Jan Dec 2014Ferrovial Executive Summary Jan Dec 2014
Ferrovial Executive Summary Jan Dec 2014Ferrovial
 
Planteamiento de Cespa en la gestión de residuos vegetales de invernadero
Planteamiento de Cespa en la gestión de residuos vegetales de invernaderoPlanteamiento de Cespa en la gestión de residuos vegetales de invernadero
Planteamiento de Cespa en la gestión de residuos vegetales de invernaderoFerrovial
 
January-March 2013 results
January-March 2013 resultsJanuary-March 2013 results
January-March 2013 resultsFerrovial
 
Informe Anual Integrado Ferrovial 2014
Informe Anual Integrado Ferrovial 2014Informe Anual Integrado Ferrovial 2014
Informe Anual Integrado Ferrovial 2014Ferrovial
 
Gestión integrada en Torrejón (Ferroser)
Gestión integrada en Torrejón (Ferroser)Gestión integrada en Torrejón (Ferroser)
Gestión integrada en Torrejón (Ferroser)Ferrovial
 
Five Principles for a Collaborative City
Five Principles for a Collaborative CityFive Principles for a Collaborative City
Five Principles for a Collaborative CityFerrovial
 
Integrated Annual Report Ferrovial 2014
Integrated Annual Report Ferrovial 2014Integrated Annual Report Ferrovial 2014
Integrated Annual Report Ferrovial 2014Ferrovial
 
Enterprise acquisition presentation
Enterprise acquisition presentationEnterprise acquisition presentation
Enterprise acquisition presentationFerrovial
 
Investors Presentation 2012 | Presentación Inversores 2012
Investors Presentation 2012 | Presentación Inversores 2012Investors Presentation 2012 | Presentación Inversores 2012
Investors Presentation 2012 | Presentación Inversores 2012Ferrovial
 
Junta General Accionistas 2012 (Español)
Junta General Accionistas 2012 (Español)Junta General Accionistas 2012 (Español)
Junta General Accionistas 2012 (Español)Ferrovial
 
JGA 2014 Presentación
JGA 2014 PresentaciónJGA 2014 Presentación
JGA 2014 PresentaciónFerrovial
 
Ferrovial Investors Presentation Jan Dec 2014 | Presentación Inversores Ene D...
Ferrovial Investors Presentation Jan Dec 2014 | Presentación Inversores Ene D...Ferrovial Investors Presentation Jan Dec 2014 | Presentación Inversores Ene D...
Ferrovial Investors Presentation Jan Dec 2014 | Presentación Inversores Ene D...Ferrovial
 
January-September results 2013
January-September results 2013January-September results 2013
January-September results 2013Ferrovial
 
Manual contra el despilfarro
Manual contra el despilfarroManual contra el despilfarro
Manual contra el despilfarroFerrovial
 
Ferrovial Financial Results Jan Sep 2015
Ferrovial Financial Results Jan Sep 2015Ferrovial Financial Results Jan Sep 2015
Ferrovial Financial Results Jan Sep 2015Ferrovial
 
Ferrovial Financial Results Jan Dec 2014
Ferrovial Financial Results Jan Dec 2014Ferrovial Financial Results Jan Dec 2014
Ferrovial Financial Results Jan Dec 2014Ferrovial
 

Viewers also liked (20)

Construction Futures Wales - CrossRail Event
Construction Futures Wales - CrossRail EventConstruction Futures Wales - CrossRail Event
Construction Futures Wales - CrossRail Event
 
Ferrovial Presentación Inversores 2011
Ferrovial Presentación Inversores 2011Ferrovial Presentación Inversores 2011
Ferrovial Presentación Inversores 2011
 
Ferrovial 2010 Results Presentation
Ferrovial 2010 Results PresentationFerrovial 2010 Results Presentation
Ferrovial 2010 Results Presentation
 
Results Presentation 2012 | Resultados Financieros 2012
Results Presentation 2012 | Resultados Financieros 2012Results Presentation 2012 | Resultados Financieros 2012
Results Presentation 2012 | Resultados Financieros 2012
 
Ferrovial Executive Summary Jan Dec 2014
Ferrovial Executive Summary Jan Dec 2014Ferrovial Executive Summary Jan Dec 2014
Ferrovial Executive Summary Jan Dec 2014
 
Planteamiento de Cespa en la gestión de residuos vegetales de invernadero
Planteamiento de Cespa en la gestión de residuos vegetales de invernaderoPlanteamiento de Cespa en la gestión de residuos vegetales de invernadero
Planteamiento de Cespa en la gestión de residuos vegetales de invernadero
 
January-March 2013 results
January-March 2013 resultsJanuary-March 2013 results
January-March 2013 results
 
Informe Anual Integrado Ferrovial 2014
Informe Anual Integrado Ferrovial 2014Informe Anual Integrado Ferrovial 2014
Informe Anual Integrado Ferrovial 2014
 
Gestión integrada en Torrejón (Ferroser)
Gestión integrada en Torrejón (Ferroser)Gestión integrada en Torrejón (Ferroser)
Gestión integrada en Torrejón (Ferroser)
 
Five Principles for a Collaborative City
Five Principles for a Collaborative CityFive Principles for a Collaborative City
Five Principles for a Collaborative City
 
Integrated Annual Report Ferrovial 2014
Integrated Annual Report Ferrovial 2014Integrated Annual Report Ferrovial 2014
Integrated Annual Report Ferrovial 2014
 
Enterprise acquisition presentation
Enterprise acquisition presentationEnterprise acquisition presentation
Enterprise acquisition presentation
 
Investors Presentation 2012 | Presentación Inversores 2012
Investors Presentation 2012 | Presentación Inversores 2012Investors Presentation 2012 | Presentación Inversores 2012
Investors Presentation 2012 | Presentación Inversores 2012
 
Junta General Accionistas 2012 (Español)
Junta General Accionistas 2012 (Español)Junta General Accionistas 2012 (Español)
Junta General Accionistas 2012 (Español)
 
JGA 2014 Presentación
JGA 2014 PresentaciónJGA 2014 Presentación
JGA 2014 Presentación
 
Ferrovial Investors Presentation Jan Dec 2014 | Presentación Inversores Ene D...
Ferrovial Investors Presentation Jan Dec 2014 | Presentación Inversores Ene D...Ferrovial Investors Presentation Jan Dec 2014 | Presentación Inversores Ene D...
Ferrovial Investors Presentation Jan Dec 2014 | Presentación Inversores Ene D...
 
January-September results 2013
January-September results 2013January-September results 2013
January-September results 2013
 
Manual contra el despilfarro
Manual contra el despilfarroManual contra el despilfarro
Manual contra el despilfarro
 
Ferrovial Financial Results Jan Sep 2015
Ferrovial Financial Results Jan Sep 2015Ferrovial Financial Results Jan Sep 2015
Ferrovial Financial Results Jan Sep 2015
 
Ferrovial Financial Results Jan Dec 2014
Ferrovial Financial Results Jan Dec 2014Ferrovial Financial Results Jan Dec 2014
Ferrovial Financial Results Jan Dec 2014
 

Similar to Ferrovial Executive Summary Jan Mar 2015

Results Presentation 2013 | Resultados Financieros 2013
Results Presentation 2013 | Resultados Financieros 2013Results Presentation 2013 | Resultados Financieros 2013
Results Presentation 2013 | Resultados Financieros 2013Ferrovial
 
Executive summary 2013 | Resumen Ejecutivo 2013
Executive summary 2013 | Resumen Ejecutivo 2013Executive summary 2013 | Resumen Ejecutivo 2013
Executive summary 2013 | Resumen Ejecutivo 2013Ferrovial
 
Investors Presentation 2013 | Presentación Inversores 2013
Investors Presentation 2013 | Presentación Inversores 2013Investors Presentation 2013 | Presentación Inversores 2013
Investors Presentation 2013 | Presentación Inversores 2013Ferrovial
 
Ferrovial Investors Presentation Jan Mar 2014 | Presentación Inversores Ene M...
Ferrovial Investors Presentation Jan Mar 2014 | Presentación Inversores Ene M...Ferrovial Investors Presentation Jan Mar 2014 | Presentación Inversores Ene M...
Ferrovial Investors Presentation Jan Mar 2014 | Presentación Inversores Ene M...Ferrovial
 
Ferrovial results-january-september-20151
Ferrovial results-january-september-20151Ferrovial results-january-september-20151
Ferrovial results-january-september-20151T Bone
 
Institutional presentation 4 q12
Institutional presentation   4 q12Institutional presentation   4 q12
Institutional presentation 4 q12TriunfoRi
 
Ferrovial Financial Results Jan-Sep 2014
Ferrovial Financial Results Jan-Sep 2014Ferrovial Financial Results Jan-Sep 2014
Ferrovial Financial Results Jan-Sep 2014Ferrovial
 
3M results 2010
3M results 2010 3M results 2010
3M results 2010 Ageas
 
2015 Combined meeting
2015 Combined meeting2015 Combined meeting
2015 Combined meetingvefinance
 
Leonardo 3Q/9M 2016 Results Presentation
Leonardo 3Q/9M 2016 Results PresentationLeonardo 3Q/9M 2016 Results Presentation
Leonardo 3Q/9M 2016 Results PresentationLeonardo
 
Finmeccanica 3 q 9m 2015 results presentation
Finmeccanica 3 q 9m 2015 results presentationFinmeccanica 3 q 9m 2015 results presentation
Finmeccanica 3 q 9m 2015 results presentationLeonardo
 
Finmeccanica First Quarter 2015 Result Presentation
Finmeccanica First Quarter 2015 Result PresentationFinmeccanica First Quarter 2015 Result Presentation
Finmeccanica First Quarter 2015 Result PresentationLeonardo
 
SEGRO plc 2020 Half Year Results
SEGRO plc 2020 Half Year ResultsSEGRO plc 2020 Half Year Results
SEGRO plc 2020 Half Year ResultsSEGRO plc
 
AT&S Quarterly Financial Report Q1 2018/19
AT&S Quarterly Financial Report Q1 2018/19AT&S Quarterly Financial Report Q1 2018/19
AT&S Quarterly Financial Report Q1 2018/19AT&S_IR
 
1Q 2015 Consolidated Results (6 Maggio 2015)
1Q 2015 Consolidated Results (6 Maggio 2015)1Q 2015 Consolidated Results (6 Maggio 2015)
1Q 2015 Consolidated Results (6 Maggio 2015)Terna SpA
 
FY2014 and 2015-2019 Strategic Plan (26 marzo 2015)
FY2014 and 2015-2019 Strategic Plan (26 marzo 2015)FY2014 and 2015-2019 Strategic Plan (26 marzo 2015)
FY2014 and 2015-2019 Strategic Plan (26 marzo 2015)Terna SpA
 
ACCIONA H1 2015 results
ACCIONA H1 2015 resultsACCIONA H1 2015 results
ACCIONA H1 2015 resultsacciona
 
Sopra Group India- Annual Results 2013
Sopra Group India- Annual Results 2013Sopra Group India- Annual Results 2013
Sopra Group India- Annual Results 2013Sopra Steria India
 
ACCIONA H1 2016 results
ACCIONA H1 2016 resultsACCIONA H1 2016 results
ACCIONA H1 2016 resultsacciona
 

Similar to Ferrovial Executive Summary Jan Mar 2015 (20)

Results Presentation 2013 | Resultados Financieros 2013
Results Presentation 2013 | Resultados Financieros 2013Results Presentation 2013 | Resultados Financieros 2013
Results Presentation 2013 | Resultados Financieros 2013
 
Executive summary 2013 | Resumen Ejecutivo 2013
Executive summary 2013 | Resumen Ejecutivo 2013Executive summary 2013 | Resumen Ejecutivo 2013
Executive summary 2013 | Resumen Ejecutivo 2013
 
Investors Presentation 2013 | Presentación Inversores 2013
Investors Presentation 2013 | Presentación Inversores 2013Investors Presentation 2013 | Presentación Inversores 2013
Investors Presentation 2013 | Presentación Inversores 2013
 
Ferrovial Investors Presentation Jan Mar 2014 | Presentación Inversores Ene M...
Ferrovial Investors Presentation Jan Mar 2014 | Presentación Inversores Ene M...Ferrovial Investors Presentation Jan Mar 2014 | Presentación Inversores Ene M...
Ferrovial Investors Presentation Jan Mar 2014 | Presentación Inversores Ene M...
 
Ferrovial results-january-september-20151
Ferrovial results-january-september-20151Ferrovial results-january-september-20151
Ferrovial results-january-september-20151
 
Institutional presentation 4 q12
Institutional presentation   4 q12Institutional presentation   4 q12
Institutional presentation 4 q12
 
Ferrovial Financial Results Jan-Sep 2014
Ferrovial Financial Results Jan-Sep 2014Ferrovial Financial Results Jan-Sep 2014
Ferrovial Financial Results Jan-Sep 2014
 
3M results 2010
3M results 2010 3M results 2010
3M results 2010
 
Tka q3 2015_presentation
Tka q3 2015_presentationTka q3 2015_presentation
Tka q3 2015_presentation
 
2015 Combined meeting
2015 Combined meeting2015 Combined meeting
2015 Combined meeting
 
Leonardo 3Q/9M 2016 Results Presentation
Leonardo 3Q/9M 2016 Results PresentationLeonardo 3Q/9M 2016 Results Presentation
Leonardo 3Q/9M 2016 Results Presentation
 
Finmeccanica 3 q 9m 2015 results presentation
Finmeccanica 3 q 9m 2015 results presentationFinmeccanica 3 q 9m 2015 results presentation
Finmeccanica 3 q 9m 2015 results presentation
 
Finmeccanica First Quarter 2015 Result Presentation
Finmeccanica First Quarter 2015 Result PresentationFinmeccanica First Quarter 2015 Result Presentation
Finmeccanica First Quarter 2015 Result Presentation
 
SEGRO plc 2020 Half Year Results
SEGRO plc 2020 Half Year ResultsSEGRO plc 2020 Half Year Results
SEGRO plc 2020 Half Year Results
 
AT&S Quarterly Financial Report Q1 2018/19
AT&S Quarterly Financial Report Q1 2018/19AT&S Quarterly Financial Report Q1 2018/19
AT&S Quarterly Financial Report Q1 2018/19
 
1Q 2015 Consolidated Results (6 Maggio 2015)
1Q 2015 Consolidated Results (6 Maggio 2015)1Q 2015 Consolidated Results (6 Maggio 2015)
1Q 2015 Consolidated Results (6 Maggio 2015)
 
FY2014 and 2015-2019 Strategic Plan (26 marzo 2015)
FY2014 and 2015-2019 Strategic Plan (26 marzo 2015)FY2014 and 2015-2019 Strategic Plan (26 marzo 2015)
FY2014 and 2015-2019 Strategic Plan (26 marzo 2015)
 
ACCIONA H1 2015 results
ACCIONA H1 2015 resultsACCIONA H1 2015 results
ACCIONA H1 2015 results
 
Sopra Group India- Annual Results 2013
Sopra Group India- Annual Results 2013Sopra Group India- Annual Results 2013
Sopra Group India- Annual Results 2013
 
ACCIONA H1 2016 results
ACCIONA H1 2016 resultsACCIONA H1 2016 results
ACCIONA H1 2016 results
 

More from Ferrovial

Ferrovial Informe Anual Integrado 2015
Ferrovial Informe Anual Integrado 2015Ferrovial Informe Anual Integrado 2015
Ferrovial Informe Anual Integrado 2015Ferrovial
 
Ferrovial Investors Presentation Jan Jun 2015
Ferrovial Investors Presentation Jan Jun 2015Ferrovial Investors Presentation Jan Jun 2015
Ferrovial Investors Presentation Jan Jun 2015Ferrovial
 
Ferrovial Financial Results Jan Jun 2015
Ferrovial Financial Results Jan Jun 2015Ferrovial Financial Results Jan Jun 2015
Ferrovial Financial Results Jan Jun 2015Ferrovial
 
Ferrovial Financial Results Jan Mar 2015
Ferrovial Financial Results Jan Mar 2015Ferrovial Financial Results Jan Mar 2015
Ferrovial Financial Results Jan Mar 2015Ferrovial
 
Ferrovial Overview 2014
Ferrovial Overview 2014Ferrovial Overview 2014
Ferrovial Overview 2014Ferrovial
 
January-June 2014 Financial Results
January-June 2014 Financial ResultsJanuary-June 2014 Financial Results
January-June 2014 Financial ResultsFerrovial
 
Resumen Ejecutivo Ferrovial 2013
Resumen Ejecutivo Ferrovial 2013Resumen Ejecutivo Ferrovial 2013
Resumen Ejecutivo Ferrovial 2013Ferrovial
 

More from Ferrovial (7)

Ferrovial Informe Anual Integrado 2015
Ferrovial Informe Anual Integrado 2015Ferrovial Informe Anual Integrado 2015
Ferrovial Informe Anual Integrado 2015
 
Ferrovial Investors Presentation Jan Jun 2015
Ferrovial Investors Presentation Jan Jun 2015Ferrovial Investors Presentation Jan Jun 2015
Ferrovial Investors Presentation Jan Jun 2015
 
Ferrovial Financial Results Jan Jun 2015
Ferrovial Financial Results Jan Jun 2015Ferrovial Financial Results Jan Jun 2015
Ferrovial Financial Results Jan Jun 2015
 
Ferrovial Financial Results Jan Mar 2015
Ferrovial Financial Results Jan Mar 2015Ferrovial Financial Results Jan Mar 2015
Ferrovial Financial Results Jan Mar 2015
 
Ferrovial Overview 2014
Ferrovial Overview 2014Ferrovial Overview 2014
Ferrovial Overview 2014
 
January-June 2014 Financial Results
January-June 2014 Financial ResultsJanuary-June 2014 Financial Results
January-June 2014 Financial Results
 
Resumen Ejecutivo Ferrovial 2013
Resumen Ejecutivo Ferrovial 2013Resumen Ejecutivo Ferrovial 2013
Resumen Ejecutivo Ferrovial 2013
 

Recently uploaded

Osisko Gold Royalties Ltd - Corporate Presentation, April 10, 2024
Osisko Gold Royalties Ltd - Corporate Presentation, April 10, 2024Osisko Gold Royalties Ltd - Corporate Presentation, April 10, 2024
Osisko Gold Royalties Ltd - Corporate Presentation, April 10, 2024Osisko Gold Royalties Ltd
 
Mandalay Resources 2024 April IR Presentation
Mandalay Resources 2024 April IR PresentationMandalay Resources 2024 April IR Presentation
Mandalay Resources 2024 April IR PresentationMandalayResources
 
Corporate Presentation Probe April 2024.pdf
Corporate Presentation Probe April 2024.pdfCorporate Presentation Probe April 2024.pdf
Corporate Presentation Probe April 2024.pdfProbe Gold
 
Collective Mining | Corporate Presentation - April 2024
Collective Mining | Corporate Presentation - April 2024Collective Mining | Corporate Presentation - April 2024
Collective Mining | Corporate Presentation - April 2024CollectiveMining1
 
the 25 most beautiful words for a loving and lasting relationship.pdf
the 25 most beautiful words for a loving and lasting relationship.pdfthe 25 most beautiful words for a loving and lasting relationship.pdf
the 25 most beautiful words for a loving and lasting relationship.pdfFrancenel
 
Q1 Probe Gold Quarterly Update- April 2024
Q1 Probe Gold Quarterly Update- April 2024Q1 Probe Gold Quarterly Update- April 2024
Q1 Probe Gold Quarterly Update- April 2024Probe Gold
 
Leveraging USDA Rural Development Grants for Community Growth and Sustainabil...
Leveraging USDA Rural Development Grants for Community Growth and Sustainabil...Leveraging USDA Rural Development Grants for Community Growth and Sustainabil...
Leveraging USDA Rural Development Grants for Community Growth and Sustainabil...USDAReapgrants.com
 
slideshare_2404_presentation materials_en.pdf
slideshare_2404_presentation materials_en.pdfslideshare_2404_presentation materials_en.pdf
slideshare_2404_presentation materials_en.pdfsansanir
 
Q1 Quarterly Update - April 16, 2024.pdf
Q1 Quarterly Update - April 16, 2024.pdfQ1 Quarterly Update - April 16, 2024.pdf
Q1 Quarterly Update - April 16, 2024.pdfProbe Gold
 
Collective Mining | Corporate Presentation | April 2024
Collective Mining | Corporate Presentation | April 2024Collective Mining | Corporate Presentation | April 2024
Collective Mining | Corporate Presentation | April 2024CollectiveMining1
 
Corporate Presentation Probe April 2024.pdf
Corporate Presentation Probe April 2024.pdfCorporate Presentation Probe April 2024.pdf
Corporate Presentation Probe April 2024.pdfProbe Gold
 

Recently uploaded (12)

Osisko Gold Royalties Ltd - Corporate Presentation, April 10, 2024
Osisko Gold Royalties Ltd - Corporate Presentation, April 10, 2024Osisko Gold Royalties Ltd - Corporate Presentation, April 10, 2024
Osisko Gold Royalties Ltd - Corporate Presentation, April 10, 2024
 
Mandalay Resources 2024 April IR Presentation
Mandalay Resources 2024 April IR PresentationMandalay Resources 2024 April IR Presentation
Mandalay Resources 2024 April IR Presentation
 
Corporate Presentation Probe April 2024.pdf
Corporate Presentation Probe April 2024.pdfCorporate Presentation Probe April 2024.pdf
Corporate Presentation Probe April 2024.pdf
 
Collective Mining | Corporate Presentation - April 2024
Collective Mining | Corporate Presentation - April 2024Collective Mining | Corporate Presentation - April 2024
Collective Mining | Corporate Presentation - April 2024
 
the 25 most beautiful words for a loving and lasting relationship.pdf
the 25 most beautiful words for a loving and lasting relationship.pdfthe 25 most beautiful words for a loving and lasting relationship.pdf
the 25 most beautiful words for a loving and lasting relationship.pdf
 
Q1 Probe Gold Quarterly Update- April 2024
Q1 Probe Gold Quarterly Update- April 2024Q1 Probe Gold Quarterly Update- April 2024
Q1 Probe Gold Quarterly Update- April 2024
 
Leveraging USDA Rural Development Grants for Community Growth and Sustainabil...
Leveraging USDA Rural Development Grants for Community Growth and Sustainabil...Leveraging USDA Rural Development Grants for Community Growth and Sustainabil...
Leveraging USDA Rural Development Grants for Community Growth and Sustainabil...
 
slideshare_2404_presentation materials_en.pdf
slideshare_2404_presentation materials_en.pdfslideshare_2404_presentation materials_en.pdf
slideshare_2404_presentation materials_en.pdf
 
Korea District Heating Corporation 071320 Algorithm Investment Report
Korea District Heating Corporation 071320 Algorithm Investment ReportKorea District Heating Corporation 071320 Algorithm Investment Report
Korea District Heating Corporation 071320 Algorithm Investment Report
 
Q1 Quarterly Update - April 16, 2024.pdf
Q1 Quarterly Update - April 16, 2024.pdfQ1 Quarterly Update - April 16, 2024.pdf
Q1 Quarterly Update - April 16, 2024.pdf
 
Collective Mining | Corporate Presentation | April 2024
Collective Mining | Corporate Presentation | April 2024Collective Mining | Corporate Presentation | April 2024
Collective Mining | Corporate Presentation | April 2024
 
Corporate Presentation Probe April 2024.pdf
Corporate Presentation Probe April 2024.pdfCorporate Presentation Probe April 2024.pdf
Corporate Presentation Probe April 2024.pdf
 

Ferrovial Executive Summary Jan Mar 2015

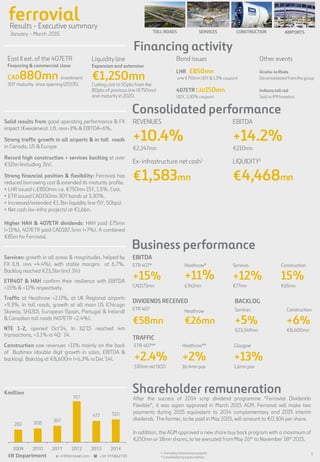
  • 1. Heathrow** +2% 16.4mn pax East II ext.of the 407ETR Financing & commercial close CAD880mn investment 30Y maturity since opening (2017E). IR Department e: ir@ferrovial.com -  +34 915862730 1 ferrovialResults - Executive summary January – March 2015 Financing activity Consolidated performance Business performance DIVIDENDS RECEIVED ETR 407 €58mn Heathrow €26mn BACKLOG ETR 407* +15% CAD173mn Services +12% €77mn Heathrow* +11% £342mn Construction 15% €65mn EBITDA REVENUES +10.4% €2,147mn EBITDA +14.2% €210mn Ex-infrastructure net cash1 €1,583mn Services: growth in all areas & magnitudes, helped by FX (LfL revs +4.4%), with stable margins at 6.7%. Backlog reached €23,5bn (incl JVs) ETR407 & HAH confirm their resilience with EBITDA +15% & +11% respectively. Traffic at Heathrow +2.0%, at UK Regional airports +9.3%. In toll roads, growth at all main US (Chicago Skyway, SH130), European (Spain, Portugal & Ireland) & Canadian toll roads (407ETR +2.4%). NTE 1-2, opened Oct’14, In 1Q’15 reached 4m transactions, +3.1% vs 4Q´14. Construction saw revenues +11% mainly on the back of Budimex (double digit growth in sales, EBITDA & backlog). Bakclog at €8,600m (+6.3% vs Dec’14). Solid results from good operating performance & FX impact (€weakness). LfL revs+3% & EBITDA+6%. Strong traffic growth in all airports & in toll roads in Canada, US & Europe Record high construction + services backlog at over €32bn (including JVs). Strong financial position & flexibility: Ferrovial has reduced borrowing cost & extended its maturity profile. • LHR issued c.£850mn: i.e. €750mn 15Y, 1.5%. Cost. • ETR issued CAD150mn 30Y bonds at 3.30%. • Increased/extended €1.3bn liquidity line (5Y, 50bps). • Net cash (ex-infra projects) at €1,6bn. Higher HAH & 407ETR dividends: HAH paid £75mn (+11%), 407ETR paid CAD187.5mn (+7%). A combined €85m for Ferrovial. LIQUIDITY1 €4,468mn TRAFFIC ETR 407** +2.4% 530mn vkt’000 1 Excluding infrastructure projects. * Consolidated by equity method. Services +5% €23,549mn Construction +6% €8,600mn Other events Ocaña-la Roda Deconsolidatedfrom the group Indiana toll rad Sold to IFM Investors Bond issues LHR £850mn o/w €750mn (15Y & 1.5% coupon) 407ETR CAD150mn (30Y, 3.30% coupon) Shareholder remuneration After the success of 2014 scrip dividend programme “Ferrovial Dividendo Flexible”, it was again approved in March 2015 AGM. Ferrovial will make two payments during 2015 equivalent to 2014 complementary and 2015 interim dividends. The former, to be paid in May 2015, will amount to €0.304 per share. In addition, the AGM approved a new share buy back program with a maximum of €250mn or 18mn shares, to be executed from May 26th to November 18th 2015. 282 308 367 917 477 510 2009 2010 2011 2012 2013 2014 €million AIRPORTSCONSTRUCTIONTOLL ROADS SERVICES Liquidity line Expansion and extension €1,250mn Cutting cost to 50pbs from the 80pbs of previous line (€750mn) and maturity in 2020. Glasgow +13% 1,6mn pax
  • 2. ferrovial Revenues +12.5% mainly as a reflection of the GBP appreciation (LfL +4.4%). EBITDA margins in line with 1Q’14. Backlog at record levels, +5.3% vs Dec’14 (€23,549mn incl JVs) Spain: Sales +6.7% from contracts won in 2H14 (waste collection Madrid). EBITDA margins improved from higher contribution from contracts which began in 1Q’14. Backlog including JV -1.6% at €6,625mn. UK: 15% revenue growth driven by GBP appreciation (LfL +2,4%). EBITDA margin (4.7%) in line with 1Q’14 though impacted by seasonality (bad weather in 1Q), new project start-up costs & higher costs related to the finalization of the investment phase in the Birmingham contract.Backlog including JV +8.2% at €16,554mn. International: This division includes mainly Chile (€15mn), Portugal (€6mn) & Poland (€4mn) showinga revenueincreaseof +43% (+35,6% LfL). Services Revenues +12.5% 1,162mn EBITDA +12.0% 77mn/6.7% Backlog +5.3% 23,549mn Toll roads Airports Double-digit growth in revenues (+24%), EBITDA (+29%) & EBIT (+30%), reported & LfL. Solid traffic growth in key assets on better weather vs 1Q’14 (US & Canada), Easter holidays in March (Spain & Portugal), lower oil prices & economic recovery since 2H’14. Growth in traffic despite strong increases in tariffs at Chicago Skyway (+4,6% with +13,2% in tariffs) & ETR407 (+2,4% with c.+10% in tariffs). NTE 1-2: 6 months in operation.Traffic +3%, revenues +47% vs 4Q’14. ITR: sold to IFM Investors for $5,725mn ($50m inflow for Ferrovial in 2015E). Ocaña-La Roda: deconsolidated from Ferrovial’s accounts with effect from Feb’14 leading to a capital gain of €63.7mn (reversal of impairments). Developingassets: LBJ: 98% of constructionis now complete, opening expected Summer 2015. NTE 35W:Work is on schedule,opening expected mid-2018. 407 East I: 58% of constructionis complete. A66 Benavente-Zamora:95% of constructionis complete. Revenues +23.9% 113mn EBITDA +28.6% 71mn /62.6% The contribution made by HAH to Ferrovial’s Equity-accounted results in 1Q’15 is €7mn vs €2mn in 2014. Heathrow: Strongperformanceon traffic (+2.0%) on the back of Easter holidays falling in March,an increasein the number of seatsin larger aircrafts & good performanceof new destinations& routesstartedin 2014. Revenues +8% from +9.3% aeronautical (tariffs up by +11.3% Jul’14) & +6,4% retail revenues.EBITDA +7,2% with margins maintainedat 55%. • Record passengersatisfaction(82% rate their experienceas very good or excellent). • “Best Airport in WesternEurope” (2015) • “Best Airport for Shopping” (2015 - 6th consecutiveyear) • T5 “Best Airport Terminal in the World” (2015) by Skytrax World Airports Awards UK Regional airports: traffic +9.3%, 2.8mn passengers. Revenues +7% and EBITDA +12,9% to £11mn. Revenues (HAH) +8.3% £623mn EBITDA (HAH) +11.0% £342mn/54.9% Ferrovial controls 25% of HAH (Heathrow) & 50% of AGS Consolidated by equity method Debt £13.1bn RAB £14.8bn * Consolidated by equity method **Ausol I Revenues +11.1% (+3.8% LfL), mainly due to strong growth at Budimex, which also supported strong growth at LfL EBITDA (+7.7%). International turnover represents 72% of revenues. Backlog +6.3% vs Dec’14 although stable LfL, with 80% from Civil Works.. F. Agroman: Revenues Lfl +3,5% supported mainly by continuous growth in traditional markets. Budimex: Revenues & EBITDA LfL growths of +20.9% & +76.5%, respectively, mainly on materials & subcontractors cost reduction, and disposal of non strategic assets.Strong growth in Backlog (+10%, +4.7% LfL) to €1,568mn vs Dec’14. Webber: revenues +7.6% or -13% LfL, mainly due to NTE managed lane finalization & adverse weather conditions in Dallas. Profitability still at high levels although lower than 2014. Lack of new large awards & high execution levels result in -10,5% fall in Backlog (local FX). Revenues +11.1% 883mn EBITDA +15.1% 65mn/7.4% Backlog +6.3% 8,600mn Construction +15.1% 737mn +43.0% 25mn n.s. 2mn/6.4% +6.7% 400mn +7.6% 41mn/10.4% Revenues EBITDA Backlog +13.7% 34mn/4.7% +10.7% 371mn (1.6)% 6,625mn +8.2% 16,554mn Spain UK International IR Department e: ir@ferrovial.com -  +34 915862730 2 Revenues EBITDA Backlog +7.6% 149mn (5.6)% 8mn/5.3% +0.9% 889mn +8.0% 524mn +8.5% 45mn/8.5% +6.2% 6,143mn +22.5% 211mn +79.4% 12mn/5.9% +10.0% 1,568mn F. Agroman (RoW) Budimex (Poland) Webber (USA) Glasgow Heathrow +2.0% 16.4mn +8.0% 622mn Traffic Revenues EBITDA +7.2% 342mn/55.0% +13.2% 1.6mn +7.8% 20mn +32.2% 5mn/26.0% Aberdeen (0.7)% 0.8mn +4.8% 15mn +6.4% 5mn/32.8% Southampton +16.5% 0.4mn +10.0% 6mn +87.4% 1mn/21.8% Chicago Skyway (55%) 4.6% 34,006 1.3mn Ausol** (80%) +11.5% 10,156 +13.9% 8mn 0.5mn M4 (66%) +5.2% 25,444 +5.9% 5mn 0.1mn 407ETR* (43%) +2.4% 530mn VKT +25.1% 153mn 4.5mn Traffic Revenues EBITDA Net debt € +46.6% 18mn + 16.2% 6mn/75.1% +5.2% 4mn/69.2% +24.3% 123mn/80.6% +46.7% 15mn/83.5% Algarve (85%) +11.7% 6,598 +2.5% 10mn 0.1mn+1.2% 9mn/88.7% 1Q’15 €mn €mn £ mn
  • 3. • Net debt (cash) structure total ferrovial Fixed Assets 20.3bn Balance sheet Current Assets 6.6bn 26.9bn Equity 6.3bn Non current Liabilities & others 14.2bn Current Liabilities 5.2bn Gross cash (3.2)bn • Ex.Infrastructure Projects Net cash (1.6)bn Gross debt 1.6bn Ex.Infrastructure Projects (1.6)bn Infrastructure Projects 8.0bn Debt maturity calendarcorporate 55mn 2015 33mn 2016 10mn 2017 Liquidity position Total cash 3.2bn Total liquidity 4.5bn Undrawn lines 1.3bn 1.5bn 2018+ Strong balance sheet and liquidity position to finance future growth opportunities. At the end of 1Q’15, Ferrovial’s net cash position, excluding infrastructure projects, amounted to EUR1,583mn. The dividends received from projects reached €90mn (€84mn in 1Q’14). Corporate rating IR Department e: ir@ferrovial.com -  +34 915862730 82% Bonds BBB / stableFitch (last upgrade July 2014) BBB / stableStandard & Poor’s (last upgrade May 2013) Total Net debt 6.4bn 1Q’15 €mn Deferred income 1.1bn
  • 4. ferrovialHuman resources Spain 54% America 4% UK 27% Poland 6% RoW 9% Environment Lower energy consumption -38.6% Reduction of greenhouse gas emissions 2009 – 2014: Management of new business opportunities Priorities Say on pay IR Department e: ir@ferrovial.com -  +34 915862730 4 FER turnoverindex:3,6%. 8 /10 employees would recommend FER as a good company to work for. • For the last 14 consecutive years, Ferrovial has been included in the DJSI (Dow Jones SustainabilityIndex) • Ferrovial has been included in Climate Performance Leadership Index (CPLI) & Climate Disclosure Leadership Index (CDLI) from the Carbon Disclosure Project (CDP), with the maximum mark (100A.) • Ferrovial leads the Supplier Climate Performance Leadership Index (SCPLI), by CDP, with a maximum A rating. CDP is investors’ main reference for evaluating how companies deal with the risks and opportunitiesrelated to climate change. Innovation R&D Investment (€m) 2014 2013 2012 2011 2010 42.6 32.9 32.6 51.32 45 636 Participants 677 Ideas 45% teams MADRID SMART LAB The City Competition Centre links as equals the local council, the entrepreneur and the services company. As a result 59 proposals submitted: 31 Mobility proposals and 28 Quality of life 1 Risk management & environmental responsibility 2 FY2014 €mn Increase of c.30% of R&D Investment in 2014, including the development of over 100 projects. This demonstrates Ferrovial’s commitment towards innovation as sourceof growth and value creation NATIONAL INNOVATION AWARD Ferrovial was awarded the National Innovation and Design award, given by the Economy and Competition ministry (Ministerio de Economía y Competitividad), who valued the presence of innovation in Ferrovial’s fields of activity, its open innovation model, its commitment to promoting talent and leadership in large international projects PROJECTS WITH MIT The “System for Waste Separation and Evaluation” project started with the objective of improving the operations and design of the urban waste separation and treatment plants. FERROVIAL INNOVATION AWARDS Inviting its employees to offer solutions to four challenges ,one for each business unit. The results of this secondedition are: 80.000 90.000 100.000 110.000 120.000 130.000 300.000 320.000 340.000 360.000 380.000 400.000 420.000 2009 2010 2011 2012 2013 2014 Fossil fuels Electricity 70% MALE 30% FEMALE 69,088 Workforce 43.3 43.8AVERAGE AGE 8.9 9.5YEARS OF SENIORITY 77% 81%PERMANENT CONTRACT 85% 15%MANAGEMENT 2.9% 0.6%ROTATION INDEX 67% 33%NEW RECRUITMENTS Strong commitment to improve health & safety polices Total TrainingHours 1,281,414 Hoursper employee 19 Investmentper employee 258 € % of the Co revenue 0.20% Talent management: Through consolidated evaluation processes, such as 360º feedback, competencies assessment and talent management reviews. Succession Planning: 700 people assessment to identify 264 successors for 133 key management positions. Compensation:Total reward policy equitable and competitive: Fixed and variable remuneration plus long-term incentives. Flexible remuneration including products & services, subject to employee personal & economic needs Opportunities based on merit: Distinguished Equal Opportunities Company award in 2010, which remainsin force until 2016. Present in 22countries Acknowledgements 17% of electricity consumed by Ferrovial came from renewable sources (100% in the case of Amey) 2014: balanced contribution between fixed, variable and long term incentives: Metrics of The Long Term Incentive Grant 2014 are a mix of: EBITDA / Net Productive Asset , Cash Flow , TSR * in comparisonwith 16 internationallisted companies: *ACS, OHL, FCC, Abertis, Serco, Carrillion, Vinci, Skanska, Strabag, Eiffage, Balfour Beatty, Bilfinger Berger, SNC Lavalin, Transurban, ADP, Fraport. 21% Fixed 39% Variable 40% Long Term incentives 2011 Grant Ferrovial compares with IBEX35 and is in the average compensation of that group. Euros 0 200,000 400,000 Percentile75 0-25%il 25-50%il 50-75%il 75-90%il Percentile25 Percentile90 Mean Media ferrovial Board remuneration non executive President & CEO remuneration as executives Source: Towers Watson tCO2eqtCO2eq