1. Detection of Microplastics in Water and Wastewater Streams Using Fluorescence Spectroscopy
Introduction
Cari Campbell*, Amy Bigelow*, Loren Miller, Kyle Nelson, Federick Pinongcos, Alexa Zapata, Natalie Mladenov
Department of Civil, Construction, and Environmental Engineering, San Diego State University, 5500 Campanile Dr., San Diego, CA 92182
*Lead authors: carimay05@yahoo.com, amybigelow@hotmail.com
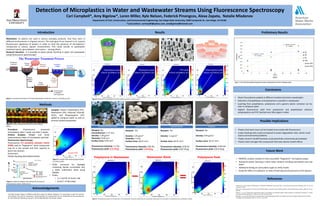
Results Preliminary Results
References
Conclusions
• Plastic fluorophores peaked at different excitation/emission wavelengths
• Detection of polyethylene and polystyrene is possible in wastewater
• Leaching from polyethylene, polystyrene and a generic plastic container can be
seen in ultrapure water
• Highest fluorescence yield from polystyrene and polyethylene whereas
polypropylene and PVC leached very little organic matter
Browne, M. A. Accumulation of Microplastic on Shorelines Worldwide: Sources and Sinks. Environmental Science and Technology, 2011, Vol. 45, No
21, pp 9175–9179
Coble, P. G. Characterization of marine and terrestrial DOM in seawater using excitation-emission matrix spectroscopy. Elsevier, 1996, Vol. 52, pp.
325–346.
Fellman, J. B., et al. Fluorescence spectroscopy opens new windows into dissolved organic matter dynamics in freshwater ecosystems: A review.
Limnology and Oceonography, Inc, 2010, Vol. 55, No 6, pp. 2452–2462.
McKnight, D., et al. Spectrofluorometric Characterization of Dissolved Organic Matter for Indication of Precursor Organic Material and Aromaticity.
Limnology and Oceanography, 2001, Vol. 46, No. 1, pp. 38-48.
Acknowledgements
Future Work
The SDSU student chapter of AWWA would like to thank Dr. Natalie Mladenov for supervising us with this research
and Professor Tom Zink for reviewing it. Harshad Kulkarni for assisting with the use of Mathlab and the aqualog and
Dr. Julio Valdes for allowing our group to use the high definition microscope camera.
• PARAFAC analysis needed to more accurately “fingerprint” microplastic peaks.
• Testing for plastic leaching in other water streams including stormwater and river
water.
• Additional testing on same plastic types to verify results.
• Study the effect of irradiation on rates of leaching and fluorescence from plastics.
Buoyant: Yes
Circumference: 1.77 mm
Density: 1.38 g/cm3
Diameter: 0.64 mm
Surface Area: 0.99 mm2
Fluorescence Intensity: 1.1 RU
Fluorescence yield: 0.51 RU/g
Buoyant: Yes
Density: 1.05 g/cm3
Diameter: 3 mm
Surface Area: 28.27 mm2
Fluorescence Intensity: 0.82 RU
Fluorescence yield: 5.54 RU/g
Buoyant: Yes
Density: 0.95 g/cm3
Surface Area: 50.27 mm2
Fluorescence Intensity: 0.035 RU
Fluorescence yield: 0.012 RU/g
Buoyant: Yes
Density: 1.2 g/cm3
Surface Area: 20.27 mm2
Fluorescence Intensity: 0.06 RU
Fluorescence yield: 0.047 RU/g
Figure 7: Two of the four plastics showed an increase in dissolution over time in ultrapure water
y = 0.0221x + 0.354
R² = 0.7752
y = 0.0494x + 0.1041
R² = 0.9999
0
0.1
0.2
0.3
0.4
0.5
0.6
0.7
0.8
0.9
0 2 4 6 8 10 12 14 16
Intensity
(ru)
Time
(days)
PE
PP
PS
PVC
Linear (PE)
Linear (PS)
Figure 5: Fluorescence peak locations from four plastics leached in ultrapure water
PVC peak
273nm ex/298nm em
Polypropylene peak
255nm ex/335nm em
Polyethylene peak
270nm ex/296nm em
Polystyrene peak
246nm ex/303nm em
Polystyrene PeakPolystyrene in Wastewater Wastewater Blank
Figure 6: The polystyrene peak can be detected in the wastewater stream by subtracting the wastewater blank peak from the peaks in a polystyrene plus wastewater sample
Motivation: As plastics are used in various everyday products, how they react in
different environments is of great concern. The main goal of our research is to acquire
fluorescence signatures of plastics in order to track the presence of microplastics’
compounds in various aquatic environments. This could include in wastewater
treatment plants, groundwater, and oceans – among others.
Research Question: Is it possible to detect plastic leaching in water and wastewater
using fluorescence spectroscopy?
Methods
Procedure: Fluorescence measured
immediately, after 1 week, and after 2 weeks
Particle Analysis: Weight and linear
measurements taken of microplastic particles
Fluorescence Spectroscopy:
Fluorescence 3-D excitation emission matrix
(EEM) used to “fingerprint” what compounds
may be in the sample and their capacity to
leach into solution
Instrument:
Horiba Aqualog Spectrofluorometer
Jablonski Diagram
Sample EEM
Samples: Plastics Polyethylene (PE),
Polystyrene (PS), Polyvinyl Chloride
(PVC), and Polypropylene (PP)
added to ultrapure water as well as
primary treated wastewater
Figure 1: Example Schematics of Primary Wastewater Treatment. Source: civil.engr.siu.edu
Figure 2: Plastic samples with Ultra Pure and Waste
Water.
Figure 3: Sample EEM showing typical peaks
in surface water.
Microplastics
float and remain
in stream
Figure 4: Jablonski diagram illustrating the concept of
Fluorescence. Source: web.uvic.ca
• EEMs corrected for Rayleigh
scattering, Raman normalized, and
a blank subtraction done using
Matlab
• Peaks:
• A, C and M Humic Like
• B and T Microbial
Possible Implications
• Plastics that leach more can be tracked more easily with fluorescence
• Lower leaching rates could correspond to slower degradation rates, which could
lead to environmental problems
• Plastics found in landfill leachate could potentially contaminate groundwater
• Plastics leach estrogen-like compounds that have adverse health effects