Transport for Sustainable Cities by Emmerson Richardson and Peter Newman
•
1 gostou•3,957 visualizações


Recomendados
Recomendados
Mais conteúdo relacionado
Mais procurados
Mais procurados (20)
Destaque
Destaque (8)
Semelhante a Transport for Sustainable Cities by Emmerson Richardson and Peter Newman
Semelhante a Transport for Sustainable Cities by Emmerson Richardson and Peter Newman (20)
Mais de Engineers Australia
Mais de Engineers Australia (20)
Último
Último (20)
Transport for Sustainable Cities by Emmerson Richardson and Peter Newman
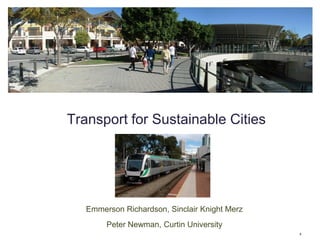
- 1. Transport for Sustainable Cities Emmerson Richardson, Sinclair Knight Merz Peter Newman, Curtin University 1
- 2. A Definition of Sustainable Transport > A sustainable transport system: o Allows the basic access needs of individuals and societies to be met safely in a manner consistent with human ecosystem health, and within and between generations o Is affordable, operates efficiently, offers choice of transport mode, and supports a vibrant economy o Limits emissions and waste within the planet’s ability to absorb them, minimises consumption of non-renewable resources, limits consumption of renewable resources to the sustainable yield level, reuses and recycles its components, and minimises the use of land and the production of noise 2
- 3. Liveable/ Sustainable Cities > Great places for social, cultural and business exchange > Great public places – to walk around or stay a while > Diverse mixed uses – leisure, education, retail, employment and a mix of housing types > Preserve heritage and create new urban art > A human scale of urban design – active interesting streets > Easy to access and move around 3
- 4. Transport for Sustainable Cities > Complement and fit the urban form > High capacity access without high numbers of cars > A walkable city – safe, secure, comfortable and convenient > A transit city – more than a city with transit 4
- 5. What are the Drivers for Change? > Climate change > Road congestion > Health and fitness > Affordable living > Road safety > Peak oil Less dependence on and use of cars 5
- 6. Transport and Climate Change > Currently 14% of emissions for transport > High growth in transport emissions in Australia: o 28.4% growth (1990 – 2004) o 60.5% estimated growth (1990- 2020) under BAU > UK + 26.4% (1990 – 2002) > USA + 27.6% (1990 – 2004) 6
- 7. Transport and Climate Change – International Comparisons AUSTRALIA UK USA Population 20.1 million 60.3 million 296.4 million Total greenhouse gas 565 mt/yr 656 mt/yr 7147 mt/yr emissions Total greenhouse gas 28.1 t/yr 10.9 t/yr 24.1 t/yr emissions per person 100% 39% 86% Greenhouse gas from 2.07 t/yr 1.04 t/yr 3.95 t/yr cars per person 100% 50% 191% Analysis of data supplied under UN Framework on Climate Change, 2004 7
- 8. Melbourne/ London Comparison Source: Bus Association Victoria Transport Emissions Report 8
- 9. Impact of Road Building on Delay – America’s 20 Biggest Cities Source: Urban Transport Monitor (1999) 9
- 10. Impact of Public Transport on Travel Demand – America’s 50 Biggest Cities Increase/Decrease Compared to Bus Only System Cities Large Rail System Small Rail System Bus Only System Indicator ( 7 cities ) ( 16 cities ) ( 27 cities ) Public Transport Ridership + 500% + 50% 0% (kms per person) Car Driver Travel - 20% - 10% 0% (kms per person) Traffic Safety (Deaths per 100,000 - 35% - 15% 0% persons) Source: Rail Transit in America – A Comprehensive Evaluation of Benefits; Litman, T (2004) 10
- 11. Road Safety > Worldwide, over one million people die each year from road crashes and many millions more are injured > More Australian lives lost in road crashes than the more than 100,000 Australians killed in wars 11
- 12. Peak Oil > Driving up prices and impacting on affordability > Impact on house prices and the economy > Could result in real shortages – rationing Australia Petroleum Trade Deficit (12 month running totals), June 2002 to March 2008 Source: A Road Map for Alternative Fuels in Australia: Ending our Dependence on Oil. Report of Jamieson Group to NRMA Motoring Services, July 2008 12
- 13. Implementing a Sustainable Transport Plan > High Capacity/ High Frequency Public Transport > Mixed Use/ High Density Around Transit Nodes (TODs) > Sustainable Mobility Management of Road Traffic > Changing Vehicles and Fuels > Radical Restructure of the Transport Budget 13
- 14. Public transport 14
- 15. A Paradigm Shift for Public Transport – A Transit City Approach > High speed rail on major corridors > Light rail in inner areas and day activity corridors > Deliver capacity to move 4 times passengers by 2030 > High frequency (less than 10 minutes) all day > Integrated bus/ rail systems > More people in walking distance of major routes > Major investment required 15
- 16. Potential Travel Scenario – Perth Year 2008 Year 2030 Change in Trips/ Day Population 1.5M 2.2M Total Trips/ Day 5.25M 7.7M 2,450,000 Car Driver Trips 3.05M (58%) 2.80M (36.4%) (250,000) Car Passenger Trips 1.05M (20%) 1.16M (15%) 110,000 Public Transport Trips 0.32M (6%) 1.28M (16.6%) 960,000 Walking & Cycling Trips 0.84M (16%) 2.47M (32%) 1,630,000 16
- 17. PUBLIC TRANSPORT PASSENGER KILOMETRES PER CAPITA VERSUS CAR PASSENGER KILOMETRES PER CAPITA Lifestyles and 30,000 city form change with Annual car passenger kilometres per capita 25,000 y = -4576Ln(x) + 40753 20,000 2 R = 0.4973 it... 15,000 10,000 5,000 - 0.0 2000.0 4000.0 6000.0 8000.0 Annual per capita public transport passenger kilometres per capita
- 19. People living in TODs have 50% less car use and save 20% of their household income due to one less car. Value retained in down times and good in up times.
- 20. Annual Vehicle Km per Household, 2004 Outer suburbs residents, particularly those away from rail lines, drive much more than inner suburbs 2.3 – 7.6 7.6 – 10.1 residents. 10.1 – 12.6 12.6 – 15.0 15.0 – 18.4 18.4 – 24.5 24.5 – 39.0 20
- 27. 27
- 28. 28
- 34. TRAVEL SMART - Creating a more resilient transport culture.... • Developed from German Werner Brog, applied first in Perth, then UK now US..... • Individualised marketing based on direct intervention with householders receiving educational materials on alternatives to the car. • Bikers and bus drivers become eco-coaches...
- 35. 35
- 39. Biofuels for farmers.... Eg from OIL MALLEE Carbon Accredited
- 40. Good for remote freight and ecotourism
- 41. Only option for heavy vehicles; CNG buses have shown how to do it. Australian technology used to convert Mumbai and Chenai buses. Australia has 77% of its population on natural gas distribution system. Can convert biomass to natural gas. Leads into Hydrogen economy.
- 45. 45
- 47. 4,400 tonnes ghg $86 million infrastructure savings($86,000 per block) $250 million in annualised transport savings over 50 years. Health savings... 47
- 50. 50