Building a Montana Organic Livestock Industry
•
1 gostou•363 visualizações

Building a Montana Organic Livestock Industry

Recomendados
Recomendados
Mais conteúdo relacionado
Mais procurados
Mais procurados (18)
Semelhante a Building a Montana Organic Livestock Industry
Semelhante a Building a Montana Organic Livestock Industry (20)
Mais de ElisaMendelsohn
Mais de ElisaMendelsohn (20)
Último
Último (20)
Building a Montana Organic Livestock Industry
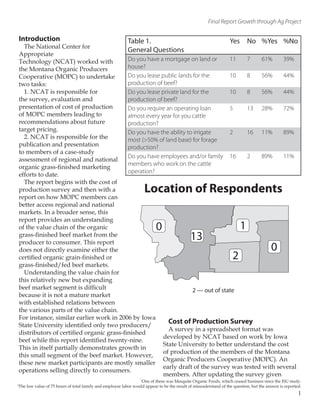
- 1. Final Report Growth through Ag Project Introduction Table 1. Yes No %Yes %No The National Center for General Questions Appropriate Technology (NCAT) worked with Do you have a mortgage on land or 11 7 61% 39% the Montana Organic Producers house? Cooperative (MOPC) to undertake Do you lease public lands for the 10 8 56% 44% two tasks: production of beef? 1. NCAT is responsible for Do you lease private land for the 10 8 56% 44% the survey, evaluation and production of beef? presentation of cost of production Do you require an operating loan 5 13 28% 72% of MOPC members leading to almost every year for you cattle recommendations about future production? target pricing. Do you have the ability to irrigate 2 16 11% 89% 2. NCAT is responsible for the most (>50% of land base) for forage publication and presentation production? to members of a case-study Do you have employees and/or family 16 2 89% 11% assessment of regional and national members who work on the cattle organic grass-finished marketing operation? efforts to date. The report begins with the cost of production survey and then with a Location of Respondents report on how MOPC members can better access regional and national markets. In a broader sense, this report provides an understanding of the value chain of the organic 0 1 grass-finished beef market from the producer to consumer. This report 13 does not directly examine either the 0 certified organic grain-finished or 2 grass-finished/fed beef markets. Understanding the value chain for this relatively new but expanding beef market segment is difficult 2 — out of state because it is not a mature market with established relations between the various parts of the value chain. For instance, similar earlier work in 2006 by Iowa State University identified only two producers/ Cost of Production Survey A survey in a spreadsheet format was distributors of certified organic grass-finished developed by NCAT based on work by Iowa beef while this report identified twenty-nine. State University to better understand the cost This in itself partially demonstrates growth in of production of the members of the Montana this small segment of the beef market. However, Organic Producers Cooperative (MOPC). An these new market participants are mostly smaller early draft of the survey was tested with several operations selling directly to consumers. members. After updating the survey given 1 One of these was Mesquite Organic Foods, which ceased business since the ISU study. 2 The low value of 75 hours of total family and employee labor would appear to be the result of misunderstand of the question, but the answer is reported. 1
- 2. Building a Montana Organic Livestock Industry responses from the early testers, Table 2. the survey was mailed to all members of the cooperative. The General Questions Average Median High Low survey was sent loaded on a CD How many total hours do fam- 2,535 3,000 6,000 75 by NCAT and results were either ily members and employees returned as print outs or sent work per year? electronically by email. Of the What percentage of your total 27 20 75 2 27 mailed 18 were returned for a labor time is engaged in “man- response rate of 67%. The answers agement”? to the questions are based on 2007 What live weight price for your $1.38 $1.40 $1.90 $1.02 production year data. cattle would you estimate you need to be profitable? General Questions What rate of return on invested 9.6% 9% 20% 2% The first part of the survey capital and assets do you con- asked several general questions sider a fair rate of return? and answers are reported in What % of your total family 47% 36% 100% 8% Table 1 and 2. A majority of those income is derived from beef responding had mortgages on land cattle operations? or house, leased public and/or private land for grazing, did not have significant ability to irrigate Table 3. forage and employed family and/ Cost of grass Average Median High Low or additional labor. Total organic acres grazed 2,608 915 11,056 375 Family and employed labor Total current value of $123,529 $80,000 $315,00 $15,000 averaged 2535 hours per year and machinery used on whole survey respondents indicated that farmer ranch (reasonable on average 27% of their time was replacement value) engaged in what they self-defined Total annual costs of $13,802 $8,100 $40,000 $1,000 as “management.”2 The average machinery operation (fuel, live weight price for cattle that repair, etc.) respondents viewed as profitable Estimated value of fencing $59,535 $20,000 $466,488 $1,500 was $1.38 per pound. An average (replacement cost) return on invested capital and assets of 9.6% was considered a Estimated % of total labor 27% 20% 70% 10% “fair” return. An average of 47% hours on grass/pasture of the total family income was maintenance derived from cattle operations. Finally, 13 of 18 respondents operations, range of beef prices and return on resided in region 2 of 5 identified regions of investment and assets. Clearly, the members the state of Montana. Two respondents were that responded reflect a wide range of diversity members that resided outside the state. Table 2 and have varied expectations from their cattle and the map below present these results. operations. Finally the average live weight price It is important to note the range of answers needed to be profitable is below that received by to these questions particularly in relation to the members last year ($1.38 vs. $1.40/lb.). However, importance of family income from beef cattle ten respondents had price expectations above the 3 This is indicated by a distribution of values that are not evenly dispersed as noted by the 2 differences between the average and median values.
- 3. Final Report Growth through Ag Project more and higher valued machinery Table 4. assets that can be used in both Cost of grass per acre Average Median High Low crop and cattle operations. Finally, Fixed machinery costs there is a wide variation in how Organic fertilizer application $0.02 $0 $0.13 $0 respondents view their allocation of Weed control $0.05 $0.03 $0.19 $0 labor time between different aspects Variable/operating machinery of their livestock enterprises.4 costs Further calculations estimated total annual costs per acre of Organic fertilizer application $0.02 $0 $0.18 $0 producing grass. These were Weed control $0.07 $0.02 $0.37 $0 divided into fixed and variable Variable/operating soil fertility $28.03 $7.04 $171.08 $0 cost categories. Fixed costs were Variable fence maintenance $6.07 $3 $48 $0.30 calculated for machinery used Fixed land charge (rental rate) $33.55 $15 $125 $5 in land fertility effort and weed control. Also, the opportunity Variable annual organic $2.12 $0.83 $17.14 $0.15 cost of land based on respondent certification estimates of land rental rates for grazing are reported. Table 5. Variable costs of producing grass Grass costs totals Average Median High Low include annual operating costs of Variable costs per acre per year $35.82 $7.34 $192.01 $0.26 machinery for pasture management, Fixed costs per acre per year $35.36 $17.14 $125.63 $5.20 fertility management, weed control Total costs per acre per year $71.76 $55.53 $207.03 $5.46 and fence maintenance. Table 4 provides information of these Grass productivity 2,829 2,000 11,000 300 calculations. Dry matter (DM) lbs per acre There is substantial variation per year between respondents’ costs. Part Grass price, DM $ per lb $0.05 $0.02 $0.30 $0.006 of the differences can be explained because these are per acre estimates. live weight price received last year ($1.40/lb.). For instance, organic certification costs spread across larger farms and ranches gives a lower Cost of Grass per-acre cost of certification. The average cost per The second part of the survey was designed to farm was $1,215 (median $672, high of $6,000 and understand the cost of producing grass which low of $500). Also, one might expect that larger then becomes part of costs of producing calves farms or ranches may not undertake extensive and/or raising calves to finish weight. Table 3 fertility and/or weed control. Indeed, there indicates the range of diversity represented by were eight enterprises that did not have fertility the respondents’ enterprises.3 The range of values expenses in 2007 and two that did not undertake between respondents is quite wide. This seems weed control of any kind. Fence maintenance to suggest a diversity of operations between varies also because the cost was calculated based those with extensive land operations and those on the respondents’ value of the labor for this who raise cattle more “land” intensively. The activity which varied from a low of $8.00 per range of current values of machinery is probably hour to a high of $30.00 per hour. The variation accounted for in part by the fact that some of the in land rental rate is surprising though it may respondents are mixed operations of cattle and reflect the fact that some respondents’ farms/ crop enterprises. Thus crop farms probably carry 4 The high estimate of 70% of time spent on grass management appears to be a misunderstanding of the question, while the low value could be accurate as there are a few operations in the cooperative measurement that are quite small in terms of number of cattle produced and acres 3
- 4. Building a Montana Organic Livestock Industry land extensive (large Table 6. total acreage) the lower Cow-calf costs general questions Average Median High Low per acre productivity is How many cow-calf pairs did you raise? 102 100 205 37 compensated by more How many calves did not make it to weaning 4 3 15 0 acres. For the relative (deaths)? land intensive (smaller How many replacement heifers did you raise? 22 20 74 1 total acreage) farms How many days to raise calves to weaning? 223 222 300 145 and ranches it appears the grass productivity What is your average stocking rate (how many 1.46 2 2 .06 is higher. Two of cow units per acre)? the respondents did indicate that they had Table 7. the ability to irrigate more then 50% of their Cow-calf costs Average Median High Low pastures and this seems Variable costs per cow unit to account for some Pasture $76.76 $77.11 $336.26 $0.08 of the higher average Supplements and minerals $11.94 $4.33 $50 $0.43 grass productivity. Fed hay $137.18 $114.36 $461.25 $1.77 The average grass Veterinary $10.21 $6.88 $27.03 $4 price suggests a cost of production of about Machinery operation $19.48 $5 $72 $1.50 $100 per ton of organic Insurance $15.73 $10.71 $116.63 $0 hay which is realistic to Property taxes $11.78 $6.43 $26.06 $0.32 local prices of organic Interest (opportunity cost at 5%) $13.96 $8.89 $52.34 $2.76 hay. Labor $214.37 $180 $486.49 $140 The higher grass cost producers are very Total variable costs $511.56 $367.92 $901.26 $239.92 high and certainly skew Fixed costs the average. One of Machinery, equipment, fences $46.62 $31.11 $201.80 $0.56 the higher cost farms Bull depreciation/replacement $10.27 $2 $60 $0.56 did have a very high Total fixed costs $57.09 $38.92 $211.26 $4.06 opportunity cost of Total all costs $568.65 $461.87 $1,093.53 $253.99 land as well as fairly high fertilization Expected average calf weaning 528.67 550 425 650 expenses. The second weight (lbs) highest cost producer Break-even price for all costs ($/lbs) $1.07 $0.89 $1.82 $0.60 in the sample also had high fertility ranches are in areas feeling pressure on land cost as well as high costs associated with fence values from non-agricultural interests. maintenance. These could be errors in the Table 5 presents average variable and fixed respondents understanding the questions or costs and an estimated grass price. It is important unique situations where a major fertilization or to note the wide variation in grass productivity fence repair (replacement) was undertaken in the between respondents. The survey asked how 2007 fiscal year. pounds of hay per acre their pastures or range would produce. For farms and ranches that are 4
- 5. Final Report Growth through Ag Project Costs of Raising Table 8. a Calf to Weaning Cost of rasing calves per calf Average Median High Low Weight Variable costs Members of the Feeder calf $863.70 $863.70 $1,171.64 $593.77 cooperative in 2007 raised and sold calves Feed at weaning (cow-calf), Fed hay $153.99 $144 $270 $28.69 bought calves and Pasture/grazing $176.87 $208.14 $249.89 $73.18 raised them to finish Supplements $22.13 $12 $90 $0 (feeders) or did some Interest on feeds - opportunity cost $15.21 $13.03 $25.21 $11.16 of both (mixed). Of those responding, Interest on calf - opportunity cost $38.60 $39.16 $64.87 $38.04 11 were cow-calf Veterinarian $6.19 $1.39 $42.86 $0 operations, 5 were Machinery operation $6.33 $1.39 $35.71 $0 mixed operations and Property tax $25.65 $6.61 $134.45 $0 2 were only feeders. Insurance $6.46 $1.59 $35.71 $0 Table 6 provides Marketing and misc. $3.66 $0.27 $21.43 $0 information on the cow-calf operations. Other $5.34 $0 $35.71 $0 The most striking Labor $183.49 $85.95 $642.86 $4.99 figure is the stocking Fixed costs rate which, again, Machinery and equipment $64.65 $25.45 $285.71 $1.09 demonstrates the Total all costs $1,549.45 $1,372.49 $2,934.65 $992.20 differences between members of the to, in part, relate back to the land intensive versus cooperative which operate land extensive land extensive operations in the sample. The operations (low stocking rates) versus those that highest pasture cost is associated with one of the raise cattle in a relatively land intensive way smallest operations (number of cattle raised and (high stocking rates). Again the highest stocking acreage) and one of the lowest stocking rates and rate (4 cow units per acre) is a member who has lowest weaning weights. Thus it appears that the option of using irrigation to gain high grass pasture costs are high because of low productive productivity. grass and costs spread over limited acreage. The variation in days to raise calves to weaning However, there are significant differences in costs seems high given that most of the respondents of fed hay, insurance and labor. Labor differences are in generally the same region of Montana and were wide with estimates of per hour labor perhaps raise similar breeds. Table 7 provides costs ranging between $6.00 to $18.00 dollars. information on the cost of production of calves Insurance variation seems to have been skewed divided in to variable and fixed costs. The data by one survey that estimated total farm insurance is presented in per cow unit (mother and calf) to be almost a total of $24,000, significantly and thus some variation is related to costs spread higher than the average cost per farm of $2,369. over various herd sizes. Again, there is a very The low fed hay costs appears to be an error wide variation between respondent costs. With where the respondent claimed only 1.1 tons of a break even cost that ranges from $ 0.60 to $1.83 total fed hay for the year and may have meant 1.1 per lb. tons per cow unit per year. The wide variation on the cost of pasture seems 5
- 6. Building a Montana Organic Livestock Industry significantly higher Table 9. across the board Cost of rasing calves per calf expenses than the minus high-cost producer Average Median High Low other respondents. Variable costs If this high cost Feeder calf $825.21 $815.35 $1089.65 $593.77 producer is removed Feed from the sample we see the variation Fed hay $140.74 $144 $270 $28.69 reduce significantly Pasture/grazing $168.45 $174.34 $249.89 $73.18 (Table 9). Having Supplements $23.64 $14.25 $90 $0 one member of the Interest on feed - opportunity cost $13.96 $12.89 $23.52 $11.16 cooperative with at 5% particularly high Interest on calf - opportunity cost $35.32 $38.75 $54.48 $29.69 costs is important at 5% information for the Veterinarian $1.61 $1.20 $5 $0 cooperative to know. However, for the Machinery operation $2.66 $1.32 $12.50 $0 remaining analysis Property tax $19.48 $5.40 $134.45 $0 we excluded this Insurance $2.81 $0.69 $16.25 $0 producer. Even Marketing and misc. $1.44 $0.18 $7.50 $0 with this producer Other $1.54 $0 $35.71 $0 removed from the sample it is important Labor $126.07 $60.48 $640.00 $4.99 to note that variation Fixed costs still remains. It is Machinery and equipment $37.01 $21.75 $128.42 $1.09 important for the Total all costs $1,376.30 $1,273.87 $1,911.71 $992.20 cooperative members to explore the sources of these variations in costs and seek educational programs to assist Cost of Raising Calves to Slaughter Weight members to further reduce costs. There is considerable variation in the costs The average and median profitability of the of raising calves to slaughter weight among cooperative members who raise feeder calves in the cooperative members. Table 8 provides 2007 was $163 and $266 per head respectively information regarding variable and fixed costs (Table 10) based on the average price the per calf raised. Of course, one of the major cooperative received for live-weight slaughter costs to raising a calf to an adult animal is the cattle ($1.40 per lb.). This amounted to between cost of the calf. While the median and average a 17 to 21 % return on all costs. Still, two of cost of a calf are close implying a normal the cooperative members that raised feeder distribution of calve costs, the high cost of calves operated at a loss. For all members who calves for some feeders were significantly raised feeder calves a price of at least $1.74 per higher than the average. The costs of fed hay, lb. would have been needed to assure that all pasture/grazing, property tax, insurance and members at least covered costs. It is important labor show significant variation. The variation to note that this profitability level includes can in part be attributed to one respondent who opportunity costs related to ownership of land, raised the smallest number of calves (14) yet had 6
- 7. Final Report Growth through Ag Project interest on feeder cattle and Table 10. feed. Therefore, estimates that are true economic profits and Profit raising calves Average Median High Low not simply profit as defined Profit per head $163.07 $266.13 $547.80 ($376.71) as cash income related to Break-even selling price for all $1.25 $1.16 $0.90 $2.67 cash costs. For example, if costs ($/lbs) the opportunity costs of land, Percentage return on all costs 17% 21% 56% (20%) interest on feeder cattle and feed at $1.40 per pound were removed, average cash return for cooperative members Comparison with Other Studies would raise to $213 per head. Table 11 offers a comparison of the results of this study with that of work by Acevedo et al. Summary (2006). It is important to note that the Acevedo The responses from this sample of the MOPC study is largely not based on actual farm data but membership reveal important information for rather is based on a simulation model. future price planning. First, at last year’s live However, despite this difference in approach, weight price of $1.40 per lb. most members were it is significant to note the broad similarities making a profit. Also, organic calves provide a in outcome. There are however, important return to cow-calf operations if they on average exceptions: can sell their calves for somewhere between $0.89 • Feeder weights and cost of production are and $1.07 per lb. Feeder operations in the coop higher for the MOPC members then conventional were buying organic calves at an average price and Midwest organic grass-fed beef producers. of $1.28 ($1.42 median) per lb. so the market for • Total feed costs are much lower than organic calves seemed profitable in 2007. Midwest organic grass-fed producers and much There is significant variation in costs between closer to Midwest conventional costs. members. As noted, some of these costs are less • Operating machinery costs are much less for amenable to change then others. For example, MOPC members. land costs are hard to change because moving • Labor costs are much higher for MOPC the operation to places where land costs are less members. This may be because MOPC members expensive is not easily done. Other differences were asked what they would pay themselves to are explained by those who run land extensive this work and the hour average was $17.25 per operations (few cattle on lots of less productive hour. The Midwest ISU study does not provide range) and land intensive operations (more information on per hour labor costs. cattle on less relatively more productive range/ • Marketing costs were much less for MOPC pasture). members and is probably due to the fact that Variable costs associated with machinery the cooperative is largely responsible for the operation, fertilization, weed control, fed hay, marketing which is done for all members. supplements seem to be more controllable and • The expected price (the actual price received could be the basis of future discussion among by members in the cooperative) was higher for members. One of the distinct advantages of MOPC members than for the Midwest organic a cooperative is that, with growing trust and grass-fed producers. openness, members can share their different approaches to cattle production and how they The Evolving Market may lower costs. The certified organic grass-finished beef market is a small but expanding market segment. 6 Alternative beef incorporates grass-fed and finished and organic grain- and grass-fed beef. 7 See the USDA Web site http://www.ers.usda.gov./Data/Organic/ to review this data. 7
- 8. Building a Montana Organic Livestock Industry were 36,113 certified organic Table 11. MT Midwest Midwest beef cows in the United States in NCAT Cost comparisons ISU-OGF ISU-CON 2005.7 OGF 1. Variable costs This is up from 6,796 certified Feeder weight (lbs) 425 559 475 organic beef cows in 1992. However, it is difficult to know Feeder cost of production (lbs) $1.43 $1.47 $1.29 just how many of these cattle Total feeder cost $607 $822 $614 were ultimately sold as grass- Days post weaning 366 322 303 finished. Total feed costs $610 $323 $294 Maverick Ranch (one of the Interest on feeder at 8% $49.32 $66 $41.32 larger organic beef producer/ Interest on feed at 8% x 0.5 $24.81 $33 $9.90 distributors) related that they sell about 10,000 lbs. of organic Veterinary and health $3 $6.19 $15 grass-finished ground beef and Machinery and equipment $10.50 $2.66 $7 steaks a week. If we assumed an Marketing and misc. $16 $1.44 $16 approximate 330 lbs. of meat sold Other costs $3.89 $1.54 $2.59 per live animal delivered (as we Labor $20.59 $126 $17.04 do below) this might represent approximately 30 head of cattle Total variable costs $1,345 $1,382 $1,017 per week and 1560 head per year. 2. Fixed costs Thus, since Maverick Ranch is Machinery, equipment, housing * $22.88 $37.01 $18.94 one of the few large distributors Total all costs $1,368 $1,419 $1,036 to major retail stores of certified 3. Income organic grass-finished beef, this Expected slaughter weight (lbs) 1029 1100 1401 is suggestive that the certified organic grass-finished market Minus death loss (transport) 0.75% 0.75% 0.75% segment is quite small compared Dressing percentage 61% 61% 63% to total organic beef available to Carcass weight (lbs) 623 666 876 market. Expected carcass price ($ per lbs) $2.18 $2.18 $1.26 In order to get a better handle Gross income $1,358 $1,452 $1,103 on the smaller segment of the Profit per head ($10) $33 $67 certified organic beef market that is exclusively grass-finished, an Price needed to cover total costs $2.20 $2.33 $1.18 Internet search was undertaken to *NCAT study did not include housing costs identify producers/distributors, wholesalers/retailers of certified According to Gwin (2006, p.5): “alternative beef organic grass-finished beef.8 This is … a tiny fraction of total beef production, effort resulted in the identification of twenty- accounting for fewer than half a million cattle per nine such entities. Of those 29, 16 provided some year, approximately 1.5% of the 33 million head pricing data on their beef as sold directly to conventional market. Alternatives are limited consumers. Following the identification of these to specialty markets for an elite consumer base entities a brief (4 question) email survey was living in only certain regions or willing to pay for undertaken from which only 5 responses were expensive mail-order beef.”6 According to the received. Table 12 provides the price data for most recent data available from the USDA, there the seventeen that offered direct sales over the 8 Obviously, this is a limited survey because one cannot make the assumption that all sellers of organic grass-finished beef have an Internet presence. 8
- 9. Final Report Growth through Ag Project 9 Table 12. List of producers/buyers Company NY Tenderloin Rib eye Hamburger Stew/ Roasts Quarter Half Whole strip stir fry Eel River Organic Beef, Inc. P,D, $30 $40 $21.40 $21.40 $6.99 $6.99 R Genese Valley Organic P, D $28.65 $44 $25 $7.50 $8.75 $5.57 $8.32 Golden Valley Natural P, D, DR Golden Valley Natural P, D $20 $25 $18 $7 $6.79 $3.72 $5.99 $5.89 $8.77 Masut Organic Farms P, D $8 Maverick Ranch P, $4.54 DR, B Nick Ranch Gourmet Beef P, D $6.75 PL Bar Ranch P, D, $12.25 $16.25 $15.50 $3.50 $4.25 $4.75 DR Pure Prairie Organic Beef P, R $9.50 Rocky Mountain Custom Cuts P, D $25.38 $28.76 $25.60 $5.25 $9.77 $7.89 $8 $8 Skagit River Ranch P, $6.11 $6 $5.75 $4.58 DR Wallace Farms P, D, $5.50 $8 $7 DR Walnut Creek Organic Ranch P, D $15 $18 $14 $5.50 $3 $4 $3.10 $3 West Wind Farms P, D, $20 $22 $19 $4 $6 $8 $5.65 $2.98 DR Wholesome Harvest P, D $18.75 $20.70 $8.55 $9 $8.62 Kezialain Farm P, D $5.50 $4.25 $4.24 Backbeyond Farm P, D $3.90 $3.90 Averages $21.23 $27.72 $19.02 $5.90 $6.95 $6.37 $6.03 $5.60 $5.44 # reporting prices 8 7 8 13 8 8 9 8 3
- 10. Building a Montana Organic Livestock Industry Table 13. Direct Market Value-added If we assume (as we have above) that the Pricing a single certified Price/ farmer/rancher delivers an 1100-lb animal grass-fed beef Lbs. lbs. Total value for slaughter and the farmer/rancher receives Live animal weight 1,000 $2.20 per lb. of hanging/carcass weight then Tenderloin steak 13.2 $26.75 $353.10 the producer receives $1,452 for the animal. New York strip steak 15.4 $21.24 $327.10 We are assuming as above a carcass/hanging Rib-eye steak 26.4 $19.02 $502.13 weight of 660 lbs. For those in our Internet sample that offered whole animals for Stir-fry/cubes 8.8 $6.95 $61.16 sale the average price was $5.44 per/lb. of Round roast 75.9 $6.37 $483.48 hanging/carcass weight. With an assumption Ground beef 190.3 $5.90 $1,122.77 of a 660 lb. carcass, that would be a gross Total meat 330 $2,849.74 income of $3,590. This added-value does not include the costs of slaughter, cutting, Based on average prices wrapping, freezing, storage, etc. Thus, it is hard to say how much of the additional Table 14. $2,138 of gross income represents additional Pricing a single certified Price/ profit. grass-fed beef Lbs. lbs. Total value If the farmer/rancher were to sell the Live animal weight 1,000 beef by “cuts” directly to consumers, Tenderloin steak 13.2 $44 $580.80 Table 13 provides insight into what gross New York strip steak 15.4 $28.65 $441.21 income could potentially be garnered. By selling “cuts” vs. whole animals directly to Rib-eye steak 26.4 $25.60 $675.84 consumers based on the average cut prices Stir-fry/cubes 8.8 $9.77 $85.98 found in our survey (Table 12), the gross Round roast 10 $759 $483.48 income is $2850 which is less than selling Ground beef 190.3 $8.55 $1,627.07 whole animals because with cuts we are Total meat 330 $4,169.89 assuming that only 330 lbs. of the 1100-lb. live animal actually ends up as various cuts.10 Based on highest prices Hence, 330 lbs of the carcass not ending up as “cuts” is not accounted in the total value of Internet and provide price information. the carcass, which we assume has additional As our survey and market research has values (for instance if the direct marketer sells indicated, organic certified grass-finished beef leather, bones, blood, etc.). Also, it is important producers need a price for their animals of to note that the average price used is based on a somewhat greater then $2.20 per lb. hanging sample of three values which vary widely. or carcass weight. However, this price is On the other hand, if we were to assume that prior to costs of slaughter, cutting, packaging, the farmer/rancher that is direct marketing could labeling, marketing and transportation of a achieve the highest prices based on our Internet “finished” product ready for the end consumer. survey and if all cuts were sold, then the gross Also, as cattle leave the farm or ranch they are income from sales of all cuts from one animal “fabricated” into several cuts (steaks, hamburger, would be $4,170 (Table 14). This is a higher value roasts, etc) each with a different per pound prices than the whole animal value based on average (not to mention other valuable ‘co-products’ such prices offered. as leather, offal, bone, blood, etc.). In addition to this analysis of direct marketing This 30-percent of live-weight estimate and distribution of cuts is drawn from “How to Direct Market Your Beef” by Jan Holder. 10 It is part of the Sustainable Agriculture Network Handbook Series Book 8, and the information appears on pages 12 through 17 . 10
- 11. Final Report Growth through Ag Project to consumers, we also did garner limited consumer for and average price of $ 3,590. information from our email survey (only 5 This price represents gross income returned to respondents): Farmer/Rancher which assumes it represents a 1. In general those who purchase organic profitable return. This is based on only three data grass-finished beef for later re-sale to retailers points. or consumers do not want to share information 3. Farmer/Rancher → “retail cuts”→ consumer about what price they pay for organic beef. For Farmer/Rancher direct sells retail cuts to example, the response from Dakota Beef (who are consumers and receives gross income from sales organic grain finished beef producers) was “not estimated to be $2,850 to $4,170 per whole beef. interested”. This value is gross income and does not represent 2. All expressed the idea that the volume of value of co-products (hides, blood, offal, bones, business was growing. etc.) which are generally not sold as retail cuts. 3. Three of the five respondents did suggest 4. Farmer/Rancher→ Processor/Distributor/ that a slowing economy was forcing customers Wholesaler → retail store→ consumer to cheaper products (organic steaks to organic We don’t really have good data for this value hamburger as well as to non-organic products) chain. With the information from Maverick 4. One respondent who only buys the “top Ranch we can construct this value chain for Round Cap” off of certified organic grass- organic grass-finished hamburger. finished beef to make organic deli meats noted a Maverick Ranch sells its burger to retail stores rise in price paying $2.65/lb. last year and $3.35/ for about $4.54/lb. and the consumer pays lb. four months ago. $6.99/lb.. We don’t know what Maverick Ranch 5. Maverick Ranch said that its organic grass- pays for whole beeves or for hamburger from finished ground beef is selling for $6.99/lb. in its farmer ranchers. However, if we assume that Safeway, Kroger and Publix supermarkets and a producer can sell a whole organic grass-fed this is a 30 to 40 % mark-up over their price (~ beef at a profit for $1,403 (value chain 1 above) $4.54 lb.) and that hamburger represents about 17% of 6. Verde Farms, which sells certified organic the value of the beef then the burger represents beef that is “pasture-raised” under its own brand about $239 of the total (17% x $1403). Since that (Verde Farms) both on-line and to retail stores, represents about 190 lbs of burger, then the value sources product from processors both domestic of the burger to the farmer/rancher is about and international (Uruguay and Australia) and is $1.26/lb. So the final value chain is the Farmer/ experiencing growing demand. Rancher gets (profitably) about $1.26 for its burger, the “processor/distributor/wholesaler Tentative Value Chains gets $4.54/lb. (gross value, not profit) and the The diagrams below provide what might be retailer gets $2.45/lb. (gross value, not profit) and called tentative value-chains for certified organic the consumer pays 6.99/lb. grass-finished beef. 1. Farmer/Rancher → whole beef → “Market” Summary Can profitably sell live animal for $1,402- $1,405 According to USA Today, organic industry (based on this and ISU study) executives believe that the loyalty of core This is what MOPC did last year more or less. organic consumers will keep the organic market “Market” is any entity that can buy live animals strong overall, even if sales growth has slowed off the farm/ranch. compared to past years. Slowed growth in 2. Farmer/Rancher → whole beef → consumer organics reflects not only cuts in spending by Farmer/Rancher direct sells whole animal to current organic consumers but also a slower 11
- 12. Building a Montana Organic Livestock Industry rate of adoption by new organic consumers. shows wide variation in costs (and hence However, a May survey of 1,000 people by profitability) among members, some of which can Information Resources found that 52 percent be changed through self-education and sharing were buying fewer organics because of cost. (Jill of information. Using and improving the “survey Richardson, AlterNet, August 29, 2009) tool” as a means to do this is one future avenue Though we do not have sufficient information, of activity. it is probably safe to assume that the organic 2. Use this information as a means to improve grass-fed beef market segment is largely your bargaining power with potential buyers. occupied by those who direct sell to consumers Insist on prices that at least keep members in either in larger volumes (quarters, halves, generally profitable. Try to get buyers to justify wholes) or as cuts (value chains 1-2) or a both. their prices. There are very few businesses that have entered 3. Expand your efforts with OFARM. This small into providing organic grass-finished beef analysis suggests that Midwest organic grass- through the existent retail store infrastructure fed producers are less profitable than MOPC at (Maverick Ranch and perhaps Whole Foods are a given price. Does this mean you “steal” their the exceptions). market or you band together to insist on prices Part of what is called value-chain analysis, that makes all of you profitable? It is obvious that has a lot to do with understanding where value OFARM would push the latter. is extracted or more simply, “who makes the 4. Continue to monitor the market generally. In money?” In terms of the MOPC, we generally this research we only found two business entities have confirmed that the average member is that openly suggested it sources product from making a profit, but that there are some members international markets. However, Whole Foods who aren’t. If the “market” could provide a price did not respond to our inquiries and we did find above $1.40/lb. live weight for animals off the competition from some entities that sell natural, farm/ranch, which would be ideal for members pasture-raised but not organic products from as reflected in 2007 cost structures. From out international sources. value chain analysis the “market” should be able 5. Watch the larger actors in the organic beef to provide that level of pricing. market. It appears that the larger actors in the Looking at the limited “hamburger” analysis, organic beef market are those that sell grain it is interesting to note that the farmer/ rancher finished beef. The recent alliance between Dakota gets about 18% of the value of the final consumer Beef and Organic Valley in the grain-finished product, the “middle-men” get about 47% of beef market will mean that these actors will have the value and the retailer gets about 35%. Is this a strong influence on market price even in the a fair distribution of the value? Is one segment grass-finished market. able to exert more value from the total chain 6. Watch what happens in the grass-finished than another? Considering that the 18% of value and natural beef markets. While there is some to the farmer/rancher appears to be a roughly segment of the market that will insist on organic profitable level and because we don’t know how and grass-finished product, there is also a profitable the other segments in the chain are, segment that will easily shift to “natural” product and then it is very hard to know fair distribution given prices. without more and better information and further 7. Try to better understand the geographic study. focus of your efforts. Does MOPC want to sell its product regionally, nationally, internationally? Recommendations While this may not be a concern currently for 1. The cooperative should continue to monitor MOPC, in working with OFARM this may its members’ costs of production. This study become a larger issue. 12
- 13. Final Report Growth through Ag Project This is an exciting and dynamic market segment and there does appear to be paths to a better share of the meat dollar going to the producer if this market is carefully developed. While Gwin (2006) wrote an excellent thesis on the alternative beef market her words and questions pose important thought for MOPC members’ future consideration: “In 10, 20, 50 years, what will the alternative beef sector look like? Though there will likely always be some independent producers, marketing their beef through local and direct channels like farmers markets and subscription programs, it is possible that natural, organic, and grass-fed beef could be largely taken over by today’s conventional beef producers. Natural is the most likely of the three to go this route – indeed, that steer is already out of the barn. What are the implications of this trend?”11 Gwin, Lauren 2006. New Pastures, New Food: Building Viable Alternatives to Conventional Beef. 11 Unpublished dissertation, University of California, Berkeley. 13
- 14. Building a Montana Organic Livestock Industry Montana Organic Producers Cooperative Final Report Growth Through Ag Project Jeff Schahczenski, Program Specialist, NCAT 2008