Digital Quarterly: Apple units sold per quarter
•
0 gostou•88 visualizações

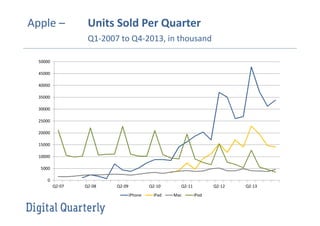
This chart shows Apple's quarterly unit sales from 2007 to 2013 for their major product lines: iPhone, iPad, Mac and iPod. The iPhone saw steady sales growth from its introduction in 2007 to become Apple's highest selling product by 2013, while iPod sales declined and the iPad launched in 2010 grew rapidly to become another top seller for Apple.

Recomendados
Recomendados
Mais conteúdo relacionado
Mais procurados
Mais procurados (20)
Destaque
Destaque (20)
Mais de Self Employed
Mais de Self Employed (20)
Digital Quarterly: Apple units sold per quarter
- 1. Apple – Units Sold Per Quarter Q1-2007 to Q4-2013, in thousand 50000 45000 40000 35000 30000 25000 20000 15000 10000 5000 0 Q2-07 Q2-08 Q2-09 Q2-10 iPhone iPad Q2-11 Mac Q2-12 iPod Q2-13
- 2. Need more metrics, statistics and performance indicators on digital leaders? Visit: www.digital-quarterly.com