SlideShare uma empresa Scribd logo
1 de 15
Baixar para ler offline
A combined geomorphological and geophysical approach to characterising
relict landslide hazard on the Jurassic Escarpments of Great Britain
David P. Boon a,
⁎, Jonathan E. Chambers b
, Peter R.N. Hobbs b
, Mathew Kirkham b
, Andrew J. Merritt c
,
Claire Dashwood b
, Catherine Pennington b
, Philip R. Wilby b
a
British Geological Survey, Columbus House, Tongwynlais, Cardiff CF15 7NE, UK
b
British Geological Survey, Environmental Science Centre, Keyworth, Nottingham NG12 5GG, UK
c
Plymouth University, Drake Circus, Plymouth PL4 8AA, UK
a b s t r a c ta r t i c l e i n f o
Article history:
Received 22 September 2014
Received in revised form 30 June 2015
Accepted 2 July 2015
Available online 17 July 2015
Keywords:
Jurassic Mudstone
Landslide
LiDAR
ERT
The Jurassic Escarpment in the North York Moors in Northern Britain has a high density of deep-seated relict
landslides but their regional hazard is poorly understood due to a lack of detailed case studies. Investigation of
a typical relict landslide at Great Fryup Dale suggests that the crop of the Whitby Mudstone Formation is highly
susceptible to landslide hazards. The mudstone lithologies along the Escarpment form large multiple rotational
failures which break down at an accelerated rate during wetter climates and degrade into extensive frontal
mudflows.
Geomorphological mapping, high resolution LiDAR imagery, boreholes, and geophysical ERT surveys are de-
ployed in a combined approach to delimit internal architecture of the landslide. Cross-sections developed from
these data indicate that the main movement displaced a bedrock volume of c. 1 × 10⁷
m3
with a maximum
depth of rupture of c. 50 m. The mode of failure is strongly controlled by lithology, bedding, joint pattern, and
rate of lateral unloading. Dating of buried peats using the AMS method suggests that the 10 m thick frontal
mudflow complex was last active in the Late Holocene, after c. 2270 ± 30 calendar years BP.
Geomorphic mapping and dating work indicates that the landslide is dormant, but slope stability modelling
suggests that the slope is less stable than previously assumed; implying that this and other similar landslides
in Britain may become more susceptible to reactivation or extension during future wetter climatic phases. This
study shows the value of a multi-technique approach for landslide hazard assessment and to enhance national
landslide inventories.
© 2015 Published by Elsevier B.V.
1. Introduction
Landslide hazards pose a threat to people and infrastructure world-
wide. They are a constraint on land use and can impact on the economy
of an affected community (e.g. Jones and Lee, 1994; Schuster and
Highland, 2001). However, our ability to assess hazard and risk in
slide prone terrain, such as the North York Moors (NYM) region of the
UK, and in Polar Regions currently undergoing de-glaciation, is hindered
by a lack of knowledge about the magnitude and frequency of events
and hillslope processes operating in these settings more generally.
This paper provides a baseline reference study for landslide hazards in
mudrocks that can be used to calibrate magnitude/frequency estima-
tions for landslide hazard assessments in the region and in similar
geological terrain elsewhere.
Jurassic mudrocks underlie much of the UK including the North
Yorkshire Moors area. These rocks are exposed in coastal slopes which
are prone to instability (Jones and Lee, 1994; Fish et al., 2006; Cooper,
2007; Johnson and Fish, 2012) but landslide problems on inland escape-
ment slopes in the NYM region are under-represented in the literature
(Senior and Rose, 1994; Waltham and Forster, 1999; Marsay, 2010;
Merritt et al., 2013). Previous geomorphological studies in the region
(Fox-Strangways et al., 1885; Gregory, 1962a) did not describe the land-
slide geology or geomorphology in any great detail. This paper aims to
address this knowledge gap.
The study focuses on the Mark Nab landslide in Great Fryup Dale,
Upper Eskdale (Fig. 1), which is the largest in a cluster of bedrock land-
slides distributed throughout several of the deep valleys in the north of
the region. We combine newly acquired remote-sensing data (LiDAR),
ground-based geomorphological mapping, electrical resistivity tomog-
raphy (ERT), and geotechnical data into a ground model in order to con-
ceptualise the 3D landslide architecture. We also use Accelerator Mass
Spectrometry (AMS) dating methods to further develop the movement
history. This ground model was then used to develop a deterministic
slope stability model to test theories about trigger and preparatory fac-
tors that led to the initial failure; including changes in stress and
Geomorphology 248 (2015) 296–310
⁎ Corresponding author.
E-mail address: dboon@bgs.ac.uk (D.P. Boon).
http://dx.doi.org/10.1016/j.geomorph.2015.07.005
0169-555X/© 2015 Published by Elsevier B.V.
Contents lists available at ScienceDirect
Geomorphology
journal homepage: www.elsevier.com/locate/geomorph
porewater pressure brought about by glacial erosion, glacial de-
buttressing, changes in regional groundwater levels and glacial lake de-
velopment. An assessment of the present stability state of the dormant
slope is also presented to provide an indication of the current and future
regional hazard posed by relict landslide systems.
2. Mark Nab study area
2.1. Topography
The study area, located at British National Grid reference 471350,
502840 (54.42, −0.90 WGS84), covers a north facing slope on the Juras-
sic escarpment at the head of Great Fryup Dale (Fig. 2). The foot of the
slope lies at c. 150 m above Ordnance Datum (aOD) and rises up over
hummocky ground by c. 200 m over a distance of c. 600 m. At the top
of the slope, Middle Jurassic bedrock is exposed in the near-vertical
cliff that forms the main Jurassic escarpment, above which is an upland
moorland plateau which reaches a high point of 432 m aOD on Danby
High Moor. The plateau sits at the northern edge of the North York
Moors which are fragmented by a series of deep valleys generally orien-
tated south-west north-east. The heads of these valleys are commonly
incised by streams fed by runoff from peat covered moorland catch-
ments. Numerous springs issue groundwater along the foot of the es-
carpment. The streams, such as Great Fryup Beck in ‘Dale Head’ and
Slidney Beck (Fig. 2) then flow north-eastwards into the River Esk
which discharges into the North Sea at Whitby. At Great Fryup Dale
the lower valley slopes are U-shaped and are typically inclined at c.
20°, but towards the head of the valley (Dale Head) the profile becomes
increasingly V-shaped and irregular, due to Holocene fluvial incision
and slippage.
2.2. Bedrock geology
The Great Fryup valley is cut into a bedrock succession of Lower to
Middle Jurassic sedimentary rocks comprising units of mudstone, silt-
stone and sandstone, with subsidiary ironstone bands and limestone
beds that together represent subsidence and eventual infilling of
the Cleveland Basin (Kent et al., 1980; Holliday et al., 1992; Cox et al.,
1999). The valley is positioned on the northern limb of the east–west
trending Cleveland Anticline structure. The bedding in the valley is typ-
ically near-horizontal but locally dips 1° to 2° to the north, dipping gent-
ly out of the slope below Nark Nab.
The succession comprises formations of the Lower Jurassic Lias
Group, overlain by those of the Middle Jurassic Ravenscar Group. The
typical lithologies of this succession are summarised in Table 1.
The overview geological map in Fig. 3 shows that landslide deposits
are extensive in Great Fryup Dale and are largely coincident with the
Whitby Mudstone Formation (WHB) and Dogger and Blea Wyke Forma-
tions. The Whitby Mudstone Formation is predominantly argillaceous
Fig. 1. The Mark Nab landslide on the Jurassic escarpment, showing complex landslide morphology. Looking south-west. Photo taken by A. H. Cooper. Copyright BGS/NERC P769517.
Fig. 2. Location map of the Mark Nab landslide study site at Great Fryup Dale, North York
Moors. Contours and spot heights are in metres above Ordnance Datum. Contains
Ordnance Survey data © Crown copyright and database right 2014.
297D.P. Boon et al. / Geomorphology 248 (2015) 296–310
and locally c. 90 m thick, comprising grey to dark grey, finely laminated,
fissile, pyritic mudstone and silty mudstone with sporadic thin sideritic
and calcareous beds and concretions (Powell, 2010; Table 1). The forma-
tion comprises five lithologically distinct Members (Cox et al., 1999)
each displaying slightly different geotechnical properties. This subtle
variation in physical properties strongly influences landslide mecha-
nism, scale, style and preservation potential across the region and the
details of individual member beds is worthy of description and some
discussion here. Of particular importance to slope stability is the pres-
ence of ‘slide-prone horizons’ within argillaceous units, as defined by
Bromhead and Ibsen (2004), which give rise to bedding controlled fail-
ures. The finely laminated (fissile) nature and pyrite content of some
beds creates strength anisotropy. The basal unit of the Whitby Mudstone
Formation, the Grey Shale Member, consists of c. 14 m of pale grey, local-
ly pyritic, silty mudstone with calcareous siderite concretions (Powell,
2010). Subsequent ocean water stratification and the establishment of
anoxic bottom conditions is recorded in the overlying Mulgrave Shale
Member, which is c. 31 m thick and includes 9–10 m of fissile, finely
laminated, bituminous, dark grey mudstone (previously ‘Jet Rock’)
with horizons of calcareous concretions and a thin pyritic limestone at
Table 1
Lithostratigraphic details and thickness of the bedrock sequence exposed in Great Fryup Dale (based on Kent et al., 1980; Howard, 1985; Powell et al., 1992; Young, 1994; Cox et al., 1999;
Powell, 2010; Barron et al., 2012).
Lithostratigraphy and local thickness Lithology
Middle Jurassic Ravenscar Group Moor Grit Member of the
Scalby Formation
c. 15 m
Grey medium- to coarse-grained, pebbly, trough cross-bedded sandstone, with thin siltstone and
mudstone beds. Plant fragments and wood common.
Scarborough Formation
30 m
Variable lithology: fossiliferous argillaceous limestone, calcareous mudstone, siltstone, and
medium-grained sandstone; calcareous concretions and ironstone.
Cloughton Formation
50–70 m
Laminated grey mudstone and siltstone with yellowish grey, fine- to medium-grained, cross-stratified
sandstones and rare thin coals and seatearths.
Eller Beck Formation
4.5–6 m
Upward-coarsening succession of mudstone (with ironstone concretions), siltstone and fine- to
medium-grained sandstone. Sandstone commonly ripple laminated, yellow weathering, bioturbated.
Saltwick Formation
c. 37 m
Grey mudstone, yellow-grey siltstone and fine- to coarse-grained sandstone. Cross-stratified,
non-bioturbated. Sandstone beds and channel fills. Thin coals, seatearth mudstone and nodular
ironstone, plant fragments, rootlets common in some beds.
Dogger Formation
7–8 m
2 to 3 m thick beds of deep-red poorly sorted coarse-grained sandstone, with chamositic (green)
ooliths and scattered rounded granules and pebbles.
Lower Jurassic Lias Group Blea Wyke Sandstone Formation
c. 5 m
Micaceous, fine-grained sandstones: grey-weathering and argillaceous in lower part,
yellow-weathering and silty in the upper part.
Whitby Mudstone Formation
Locally c. 90 m
Medium and dark grey fossiliferous mudstone and siltstone, laminated and bituminous in part, with
thin siltstone or silty mudstone beds. Sporadic thin sideritic and calcareous beds, limestone and
phosphatic nodules and concretions. Pyritic.
Cleveland Ironstone Formation
Up to c. 25 m
Grey silt-laminated mudstone with up to six 0.1 to 0.3 m thick interbeds of hard, fossiliferous, ooidal
ironstone (siderite and berthierine).
Staithes Sandstone Formation
Up to c. 30 m
Silty sandstone with 2 to 4 m thick packages of laminated fine-grained sandstone in the middle and
upper parts: typically bioturbated and/or showing wide variety of bedding structures.
Redcar Mudstone Formation
Up to c. 283 m
Grey, fossiliferous, fissile mudstones and siltstones with subordinate thin beds of shelly limestone
below, fine-grained carbonate-cemented sandstone above: argillaceous limestone concretions occur
thoughout.
Fig. 3. Geological map of Great Fryup Dale, adapted from Holliday et al. (1992), Sheet 43 Solid and Drift Edition, with unpublished BGS landslide deposit mapping data. Contains British
Geological Survey materials © NERC 2014.
298 D.P. Boon et al. / Geomorphology 248 (2015) 296–310
the top (previously ‘Top Jet Dogger’), passing up into c. 23 m of fissile, bi-
tuminous mudstone with abundant ammonites (formerly ‘Bituminous
Shales’). The Alum Shale Member above is c. 37 m thick, comprising a
lower soft grey silty (micaceous) mudstone that includes c. 6 m of non-
bituminous shale capped by a band of siderite nodules, overlain by c.
15 m of pyritic shale (the main ‘Alum Shales’), then 13–20 m of slightly
stronger shale (formerly ‘Cement Shales’) that include beds of calcareous
nodules (Kent et al., 1980; Powell, 2010). The Middle Jurassic Dogger For-
mation rests unconformably on the Alum Shales in this part of the Cleve-
land Basin and the overlying Peak Shale and Fox Cliff Members exposed
along the Yorkshire coast near Whitby are absent (Powell, 2010).
Kent et al. (1980) interpreted the overall structural grain of the re-
gions distinct sub-parallel valleys to be the result of basin inversion, up-
lift, erosion and unloading. This structural history produced a pervasive
radial joint pattern which had led to the development of the distinctive
radial drainage pattern. In the north of the Moors the predominant N–S
structural grain and topography led to the formation of a series of near-
parallel north–south orientated valleys, and Great Fryup Dale serves as a
fine example of one of these consequent drainage features. Joints are
pervasive and laterally and vertically persistent in the sandstone beds
that cap the mudstones, and are generally orientated near-parallel to
the valley slopes. The presence of these joints, together with occasional
faults, reduces the tensile (rock mass) strength of the cap rock and
Dogger Formation beds in a preferential orientation, and also increases
the permeability, transmissivity and storage capacity of the units (creat-
ing aquifers). These structural factors, along with the presence of weak-
er mudstone horizons, strongly control landslide susceptibility and
mechanisms of failure.
2.3. Quaternary history
Great Fryup Dale was glaciated through the Devensian and became
de-glaciated in late-Devensian times (Jones, 1977, 1999). During the
Last Glacial Maximum (LGM) of Marine Isotope Stage 2 (around
18,000 yr BP), the high ground on the North York Moors remained
largely ice free but experienced very severe periglacial conditions
(Innes, 1999; Innes et al., 2009; Chiverrell and Thomas, 2010). At this
time the valley was probably fully glaciated by a tongue of ice from a
glacier in the Esk Valley (Kendall, 1902; Kent et al., 1980; Chiverrell
and Thomas, 2010; Murton and Murton, 2011). De-glaciation com-
menced c. 13,000 yr BP, in the Late Glacial Interstadial but was
interrupted by a brief final cold stage between about 10,800 and
10,400 yr BP, during the Loch Lomond Stadial (Innes, 1999). Glaciation
left patchy deposits of till in the valley floor (Fig. 3) and prolonged
periglacial conditions left spreads of periglacial Head deposits across
slopes. Holocene rivers cut down through till, deposited alluvium across
the valley floor, and cut terraces into the bedrock. Landslide deposits
formed in oversteepened valley heads and along valley sides, some-
times blocking stream channels which temporarily diverted river flow.
On the hill tops peat deposits cover much of the plateau, which along
with some valley slopes to the south (e.g. Rosedale) are peppered
with shallow coal and ironstone workings and small mine spoil heaps.
3. Slope geomorphology at Mark Nab
The landslide at Mark Nab is c. 700 m long and c. 600 m wide; it
covers approximately 0.36 km2
(Figs. 3 and 4). The crown of the land-
slide is at an elevation of c. 340 m aOD, and the toe is at c. 190 m aOD.
The flanks abut against adjacent landslide deposits to the east and west.
3.1. LiDAR interpretation
Airborne LiDAR data were acquired by the Environment Agency
Geomatics Group at a resolution of 0.25 m (flown March 2012). The de-
rived shaded digital terrain model (Fig. 4) was interpreted and main land-
slide features initially mapped out using a GIS and adopting the
descriptive terms from Cruden and Varnes (1996). Based on this mapping
and supplementary detailed field-based mapping, three distinct morpho-
logical zones (I–III) were identified within the one landslide system:
Zone I —rear scarp with rockfall
Zone II —main body with rotated landslide blocks, block disruption,
minor scarps and grabens
Zone III —frontal mudflow complex with concealed block disruption or
weathered bedrock
The following section describes the geomorphology of the slope as
interpreted from the LiDAR data (Fig. 4).
The average slope angle on the landslide varies widely; a concave
near vertical cliff dominates Zone I, whereas slopes of up to 42° are lo-
cally present in Zone II. The lower slopes in Zone III are generally smooth
and gently undulating with an overall convex form downslope.
3.1.1. Details of Zone I
Zone I contains the rear scarp of the landslide, which is c. 370 m long,
up to 40 m high. This feature forms a sharp crescent shaped cliff separat-
ing the sheltered valley from the exposed moorland plateau. The upper
portion of scarp is a near vertical 6 m high cliff exposing thickly bedded
gritty sandstone blocks of the Cloughton Formation (Sycarham Mem-
ber) and the finer more thinly bedded Eller Beck Formation below.
The rock mass is locally regularly jointed and blocky, with three orthog-
onal joint sets present; oriented ESE, SE and NE. These joints intersect
the near-horizontal bedding which daylight in the cliff face. This kine-
matic geometry favours ‘toppling’ and ‘sliding’ modes of failure, and fail-
ures typically releasing fairly large (1 to 3 m3
) blocks of sandstone,
which have accumulated in a talus cone at the foot of the main scarp,
partially filling the surface depression formed by the rear graben.
The lower half of the escarpment cliff (main scarp) exposes mud-
stones and sandstones of the Saltwick Formation. Continued erosion of
the cliff has deposited a thin veneer of ‘gravelly clay’ on the slope which
periodically fail in translational debris-rich mud slides also feed fluidised
sediment, sometimes via chutes, into the depression below (graben). Sev-
eral freshwater springs emerge from Sycarham Member along the base of
the main sandstone cap, and also from several sandstone channels pres-
ent within the predominantly silty Saltwick Formation. Channel erosion
by these springs forms small gullies in the backscarp, and fossil gullies
are preserved on the eastern most rear landslide block.
The western side of the escarpment slope has undergone differential
erosion leading to bevelling of the bedrock surface (Cloughton Forma-
tion) which has produced a more rounded slope profile in the east.
Above Zone I, at the western end of the main scarp, is a north-west-
facing slope facet, with a distinctively smooth, regular, and convex profile
which becomes progressively steeper downslope (19–26°). This slope is
mantled with at least 2–3 m of soliflucted periglacial slope deposits
(Head deposits) composed of stiff grey slightly gravelly, silty, sandy
clays with rare rounded pebbles. Some of these pebbles may have been
reworked from a pre-Devensian till. This slope is also scattered with
large sub-rounded boulders of coarse-sandstone which are notably
more deeply weathered than the fresher rockfall blocks sourced directly
from the back scarp cliff. It is most likely that this slope facet is a periglacial
‘boulder field’ with boulders sourced from the thick sandstone bed that
crops out at the crest of the slope (see Fig. 5). Another such ‘boulder
field’ is present on a triangular shaped east-facing slope facet located c.
300 m to the west, on the opposite side of the valley.
3.1.2. Details of Zone II
The upper part of Zone II contains a 30 m wide, 200 m long, flat wa-
terlogged depression. This is interpreted as a rear graben that separates
the rear scarp from the main body of the landslide. The graben contains
0.5 m of peat over at least 2 m of wet soft silt. A low man-made earth
dam (built c. 2010) impounds excess surface and spring water in the
graben formed depression to supply nearby farms.
299D.P. Boon et al. / Geomorphology 248 (2015) 296–310
The middle part of Zone II contains a c. 200 m long area of highly ir-
regular topography characterised by massive blocks, each c. 100 m wide
and c. 60 m long, with secondary slope parallel scarps up to 20 m high.
The highest blocks are capped by a lithologically distinct band of resis-
tant ferruginous limestone of the Blea Wyke Member and are composed
mostly of Whitby Mudstone Formation mudstone. The limestone mark-
er beds dip at c. 20° to the south in the rearmost blocks, but the dip in-
creases northward to up to c. 58° on the frontal blocks. The of the main
landslide blocks are markedly linear and commonly strike NNE, as can
be clearly seen from the LiDAR DTM (Fig. 4). This orientation matches
the principal joint set orientation measured in the thick sandstone
beds exposed in the main cliff above, suggesting an inherent structural
control on landslide failure mode and resultant morphology. Small sea-
sonal ponds occur in depressions between the main landslide blocks
and are filled by several metres of laminated silt with occasional cobbles
(proved by Russian Corer and hand auguring). The topography of the
eastern side of Zone II is generally more subdued than the western
side following more intense reworking and infilling of topographic de-
pressions by mudflows generated by high amounts of water issuing
from the springs and small springs that drain the rear pond.
The eastern flank of the main landslide is represented at surface by a
c. 150 m long, 15–20 m high scarp feature which forms a linear trough. It
is currently occupied by a stream fed by the rear pond and is bounded to
the east by a ridge composed of slipped fissile mudstone capped by a red
sandstone.
The western margin of Zone II represents the western flank; this area
of rough ground is characterised by a complex association of morpho-
logical features created by a series of superficial shallow multiple land-
slides formed in the pre-slipped mudstone, similar in style to the lowest
part of Zone II. Slope instability in this part of Zone II is primarily driven
by toe erosion by Slidney Beck. The course of this stream has clearly
been obstructed, and likely dammed at several points, by landslide de-
posits on multiple occasions. This has resulted in diversion of the
stream, which has subsequently carved new channels and fluvial ter-
races, and in doing so has proceeded to undercut and destabilize the ad-
jacent landslide deposits.
Below the 270 m contour line the morphology in Zone II is typically
more subdued with 5–10 m high minor scarps and transverse tension
cracks that run parallel with the slope. The lowest slopes in Zone II con-
sists solely of mudstone beds (with sandstone absent) which are rotat-
ed by up 45° in boreholes 2 and 3. Contorted and tightly folded beds of
mudstone are exposed in a sunken track and stream section at the toe
(locations 3, 4 and 5 in Fig. 5). It is likely that this lower area (Loc. 3)
contains the main slip surface breakout, and although the basal shear
surface(s) is masked by superficial slumped mudstone in the gulley,
its surface expression, which represents the toe of the landslide, can
be mapped out by tracing the slight rise in ground level.
3.1.3. Zone III
Zone III is typically an area of smoother topography than Zones I and
II, with irregular slopes of c. 9–12°. This zone contains the foot and toe of
the main landslide. This zone is c. 200–300 m long, c. 600 m wide and
contains degraded mudflow lobes, peat hollows, numerous rabbit bur-
rows, and several spring lines. The toe area has been artificially drained
to improve the quality of the pasture land. The western side has degrad-
ed ridge and furrow plough lines which are disturbed above the 245 m
contour line where grass pasture gives way to bracken and the ground is
crossed by degraded transverse cracks.
Below Zone III, on the valley floor, the ground is very smooth and
slopes gently to the north. This area is interpreted to preserve a glacially
Fig. 4. Use of high-resolution LiDAR. A derived Digital Terrain Model of Great Fryup Dale (0.25 m x,y, resolution, 0.015 m vertical resolution, flown by Environment Agency 10 March 2012).
Coordinate system is British National Grid. Three main morphological zones (I–III) are defined based on surface morphology.
300 D.P. Boon et al. / Geomorphology 248 (2015) 296–310
Fig. 5. Geomorphologic plan of the Mark Nab landslide showing key localities, positions of boreholes (BHs 1, 2, 3, 4, 4A), dynamic penetration tests, ERT lines (ERT 1, 2, 3), geological cross-section lines A and B, and relation of surface morphological
features to the landslide morphological Zones I–III defined in Fig. 4.
301D.P.Boonetal./Geomorphology248(2015)296–310
eroded bedrock surface which has later been modified by transient
streams emanating from the toe of the landslide, or diverted around
the toes of other landslide masses that have previously dammed Slidney
Beck. These stream diversion events have likely caused erosion of the
toe, evidenced by a low cliff feature along the western end of the toe.
3.2. Geomorphological plan
The morphological features interpreted from the LiDAR were com-
bined with detailed geological field mapping to produce a 1:2500
scale ‘geomorphologic plan’ (Fig. 5; as per Anon, 1972; Griffiths, 2002;
Fell et al., 2008). The plan depicts the key morphological features and
geology, with structural data, field localities (numbered locality 1–13),
borehole and dynamic penetrations test locations, geophysical survey
lines, and lines of cross-section. The Cloughton and Saltwick Formations
are exposed in the main back scarp and erosion of these materials con-
tributes to rockfall, mudslides and accumulation of talus (13). On the
main body (Zone II) several Whitby Mudstone-cored blocks are capped
by more resistant sandstone and limestone beds of the Dogger and Blea
Wyke formations. Their lithologically distinctive beds provide key strat-
igraphic markers across the slipped ground, and their southerly dips
and drop in elevation, provide evidence for back rotation of the land-
slide mass. The extents of these marker beds were mapped out in detail,
with structural measurements taken to help model the subsurface
structure of the landslide blocks. Periglacial head deposits above and
west of the main backscarp are truncated by the rear scarp exposing
the non-marine siltstone and mudstones of the Saltwick Formation.
This relationship has important implications for the landslide move-
ment history, as discussed later. On the far western flank, Slidney Beck
has been diverted around the toe of a secondary landslide deposit. The
scarp of this toe failure truncates the main scarp feature and this provides
evidence for erosion-driven reactivation after the main failure, although
the relative age of this subsequent failure has not yet been investigated.
The stream is currently eroding the river bank at the foot of Zone II, and
thereby continues to destabilise the western side of the landslide system.
In the upper part of Zone III the sharpness of minor scarps, which define
the boundaries of the secondary rotations through ‘block disruption’ (9
and 10), and tension cracks (11) have become much degraded. The
disrupted and disturbed Whitby Mudstone Formation mudstone slakes
fairly readily and has degraded to mud which feeds mudflows that supply
material to the lower mudflow complex (6), producing a smooth slope
profile (7 and 8) across the sub-cropping Cleveland Ironstone Formation.
Contorted and tightly folded beds of mudstone are well exposed in a
sunken track (4 and 5) in the eastern toe area. These structures are
interpreted as a product of compression related to landsliding, and not
the result of tectonic faulting, though these features could also potentially
relate to earlier cambering and valley bulging processes which could have
preconditioned the slope for failure.
4. Subsurface investigations
4.1. Drilling and testing
Five boreholes (1, 2, 3, 4, 4A) were drilled in the foot of the landslide
to assess the stratigraphy and to provide ground-truth for the geophys-
ics. The boreholes (BHs) were logged to BS5930:1999, the British Stan-
dards for Site Investigation (British Standards Institution, 1999; BS EN
ISO 14688-1 and weathering described according to Anon, 1995). Full
logs are presented in Appendix A and BH locations are shown in Fig. 5.
The core was sampled in a fresh state for classification tests, including
moisture content, bulk density, resistivity and shear strength (uncon-
solidated undrained for ‘peak’ values, and consolidated drained for ‘re-
sidual’ values). BH4A was a re-drill of BH4 drilled to collect additional
samples. Dynamic Penetrometer (DP) tests were also undertaken to
provide correlation of strong and weak zones between boreholes. The
DPs were progressed to refusal (N ≥ 60), terminating within strong
unslipped mudstone, ironstone, or siderite bands. A standpipe piezom-
eter in BH2 to monitor shallow groundwater levels in Zone III was mon-
itored between March and November 2012 using a Solinst Levelogger
Gold and Barrologger at 15 min recording intervals. Within the monitor-
ing period the water level fluctuated between 2.8 and 3.5 m below
ground surface and was sensitive to antecedent rainfall conditions. It is
unlikely that this water level represents the water table across the entire
landslide, as groundwater conditions are likely to be complex, and possi-
bly compartmentalised in Zone II due to the influence of minor aquifers
existing within individual landslide blocks.
The boreholes in Zone III (BHs 1, 3, 4, and 4A) proved weak mud-
stone bedrock (Whitby Mudstone Formation) overlain by c. 10 m of
soft to firm mottled or laminated clay sediments (mudflow deposits).
Borehole 2, located further up slope within Zone II, proved 6 m of rotat-
ed, highly fractured, weak to strong mudstone beds which are
interpreted as slipped Whitby Mudstone Formation. Boreholes 4 and
4A, in the toe area, proved several metres of deeply weathered mud-
stone overlain by stiff gravelly clay (head or till) deposits, and capped
by soft clay containing an organic-rich peaty soil horizon between
2.64 and 2.90 m b.g.l. These organic rich horizons, which were dated
(see later), are interpreted as a palaeosol that formed in a small depres-
sion and subsequently was buried and preserved by a mudflow event.
4.2. Geophysical survey
The electrical resistivity tomography (ERT) technique (Jongmans
and Garambois, 2007) was used to compare subsurface characteristics
with surface features and ground-truth from borehole data.
Geophysical surveys were acquired along three lines: ERT Lines 1, 2
and 3, and these were orientated perpendicular to major structural
trends and geological boundaries, including the main landslide blocks.
Line ERT 1 was acquired using two arrays (ERT 1A and ERT 1B) in
order to sample the entire length of the landslide deposit, and including
the lower non-slipped ground beyond the toe. The survey design pro-
vided for a depth of investigation up to c. 50 m in order to image the
shallow and deep structure of the landslide beyond the estimated
depth of the deepest slip surface, based on initial cross-sections and
the geomorphological evidence.
Approaches to ERT field surveying are described widely in the litera-
ture (e.g. Lapenna et al., 2005; Chambers et al., 2011), so only a brief ex-
planation is provided here. The ERT field survey was undertaken during
May 2011. ERT data were collected using an AGI SuperSting R8 IP system
attached to stainless steel electrodes via multicore cables. Ground condi-
tions were generally extremely dry. To reduce contact resistances and
improve data quality, each electrode was watered using a saline solution.
Electrode positions were identified using survey tapes extended across
the ground surface; a real-time-kinematic (RTK) GPS measurement,
with centimetric accuracy, was then made for each electrode position,
to establish the grid position and elevation of each electrode.
The locations of the four ERT Lines 1A, 1B, 2 and 3 are shown in Fig. 5
as ERT 1, ERT 2, and ERT 3 with lengths of 292.4, 307.6, 289.5 and
184.9 m respectively. (Note that ERT 1A and ERT 1B are end on and
are depicted as ERT 1 in Fig. 5). A dipole–dipole configuration was
employed for each of the lines. The longer lines, Lines 1A, 1B and 2,
were surveyed using (along-ground) dipole lengths (a) of 5, 10, 15,
20, and 25 m and dipole separations (na) of 1a to 8a. For Line 3, which
was a shorter and higher resolution imaging line, a values of 3, 6, 9,
12, 15, and 18 m, and na values of 1a to 8a were used.
A summary of the contact resistances and reciprocal error character-
istics of the ERT Lines 1A, 1B, 2, and 3 are shown in Table 2. Even with
watering, the measured contact resistances were relatively high, with
mean resistances of approximately 3000 Ω, reflecting the very dry con-
ditions at the time. The reciprocal errors do however indicate that rea-
sonable data quality was achieved for most measurements (i.e. N80%
of the measured reciprocal pairs had a reciprocal error of b1%). Data
points with a reciprocal error of N1% were removed from the data
302 D.P. Boon et al. / Geomorphology 248 (2015) 296–310
sets, and the reciprocal errors were used to weight the data during the
inversion. The misfit errors for ERT Lines 1A, 1B, 2 and 3 were 2.4%,
1.1%, 3.4% and 2% respectively indicating good convergence between
the model and measured data.
It should be noted that ERT models are smoothed images for which
resolution decreases with increasing depth of investigation because
the model in these regions is less well constrained by the data. The
interpretation of 2D ERT imaging data is further complicated by off-
line 3D resistivity and topographic variations that violate the 2.5D
assumption. Therefore, the ERT images can provide only an approxi-
mate guide to the true resistivity and geometry of subsurface features
(Olayinka and Yaramanci, 2000; Chambers et al., 2002); and hence,
calibration and interpretation using other sources of ground-truth
information are highly desirable. This was possible in Zones I and III,
where exposure mapping or borehole data were available, but not in
Zone II.
4.3. Results and interpretation of geophysical imaging (ERT)
The ERT survey Lines 1A, 1B, 2 and 3 (Fig. 6) provide additional infor-
mation on deep subsurface structure and composition of the landslide
mass. The geophysical models for the corresponding ERT Lines 1A, 1B,
2 and 3 are presented in Fig. 6 with borehole and penetrometer test
data overlaid to provide information on material characteristics and
depths, where available. The low resistivity areas generally correspond
with clay-rich materials, such as mudstone lithologies and wet clay
soils, and these contrast against more electrically resistive areas which
indicate the presence of non-clay or dry materials such as siltstone,
sandstone, limestone or free draining dry coarse or very coarse soils.
Geological boundaries, depicted in black, are projected into the subsur-
face and geological units labelled. Oblique formation labels indicate ro-
tated bedding and horizontal labels indicate horizontal bedding. The
relationship and distribution of high and low resistivity zones at depth
within the main body of the landslide (ERT Lines 1A, 2 and 3) provide
evidence of the deep structure where there is no intrusive ground inves-
tigation data. Truncation of rectangular high resistivity zones against
low resistivity zones in Zone II is interpreted as evidence for rotation
and juxtaposition of more resistive beds (e.g. partially or un-saturated
sandstone and limestone beds) against low resistivity mudstones. The
Table 2
Contact resistance and reciprocal error summary information for ERT Lines 1A, 1B, 2 and 3.
Number of
measurementsa
Contact resistance
(Ω)
Fraction (%) of data
set below reciprocal
error level
Mean SDb
1% 5%
ERT Line 1A 1780 3159.0 4145.9 80.6 95.0
ERT Line 1B 1788 2757.0 1735.6 80.0 93.6
ERT Line 2 1780 3065.0 2656.2 83.3 96.0
ERT Line 3 1980 3175.0 1872.2 87.6 99.1
a
Each comprising a reciprocal pair (i.e. a forward and reciprocal measurement).
b
standard deviation (SD).
Fig. 6. ERT sections from the Mark Nab landslide with borehole data and preferred interpretation of profile of main slide surface.
303D.P. Boon et al. / Geomorphology 248 (2015) 296–310
dashed white lines depict ‘inferred’ positions of the main shear surfaces
with arrows indicating general direction of slip. In Zone II the geophys-
ical data suggest a c. 30 m deep ‘upper’ slip surface, with an entirely sep-
arate ‘lower’ slip surface. In Zone III the lateral thickness variation in
mudflow deposits within the toe can be inferred, with borehole and
DP control, from the geophysical model (ERT Line 1, Fig. 6); the lower
boundary of the mudflow deposits is marked by a sharp transition be-
tween lower resistivity zones representing mudstone and higher
resistivity zones representing sandy clay and silt rich materials.
5. Slope architecture
An interpretation of the 2D architecture of the slope has been devel-
oped by combining the LiDAR digital terrain model (Fig. 4), the geology
map and geomorphological interpretation (Fig. 5) and the findings of
the drilling and geophysics (Fig. 6), following the ‘total geological
model’ approach described by Fookes (1997). The model of the internal
architecture and its relation to the bedrock succession is summarised
in two cross-sections, Sections A and B, in Fig. 7. The location of
Section lines A and B are shown in Fig. 5.
Section A (A–A′, Fig. 7) shows an idealised geological cross-section
through the centre line of the landslide and subsurface relationships be-
tween surface morphological features, such as back-tilted sandstone-
capped mudstone blocks and key geological marker beds such as the
Dogger Member. At the rear of the escarpment (Zone I) the thick hori-
zontally bedded cap of well-jointed sedimentary rocks, composed of
Dogger Member, Saltwick Formation, Eller Beck Member and predomi-
nantly Cloughton Formation, provides a static load on the thick Whitby
Mudstone Formation beds. These non-argillaceous units effectively be-
have as a layered aquifer which along with surface infiltration supply
water into the slope. Dilation of existing bedrock joints due to vertical
and lateral stress-relief (unloading) and possibly ice jacking has contrib-
uted to enhanced bulk porosity and secondary permeability of the cap
rock and is an important factor in the hydrogeology.
The presence of three large internal blocks within Zone II (deep-
seated rotational) suggests that at least two internal slide surfaces are
present, and these likely connect with the main slide surface at depth
(Fig. 7A). There are several possible interpretations of the slip surface
geometry, and the author's two preferred interpretations are labelled
in Fig. 7 as Interpretations 1 and 2. The first interpretation involves an
‘upper’ slip surface, with a c. 30 m deep sub-horizontal planar surface
Fig. 7. Geological cross-sections. A) Idealised cross-section through the centre of the Mark Nab landslide showing two possible slip surface geometry interpretations: Interpretation 1 en-
tertains two entirely separated slide surfaces, the ‘upper’ surface is bedding-controlled and horizontal, the ‘lower’ is a sub-horizontal non-bedding-controlled surface; while Interpretation
2 considers a multiple rotation with three main blocks and a common basal bedding-controlled slide surface. Zones I–II relate to geomorphological zones described in Fig. 4. B) Idealised
cross-section through the western flank with single compound slide with superficial rotations. Note that the locations of the cross-section lines do not match those of the geophysical
survey lines (see Fig. 5).
304 D.P. Boon et al. / Geomorphology 248 (2015) 296–310
which follows a ‘slide prone horizon’, as defined by Bromhead and Ibsen
(2004), within the Whitby Mudstone (exploiting weaknesses in the
upper beds of the Mulgrave Shale Member), and a completely separate
‘lower’ slip surface evidenced by the geophysics, which is c. 20 m deep
and gently inclined at c. 10–12°. The form of the ‘lower’ slip surface is
sub-horizontal, planar or stepped, and cuts through the bedding of the
Whitby Mudstone (Mulgrave Shale Member). Both slip surfaces are
most likely non-circular.
However, an alternative interpretation (Interpretation 2) is also
worth considering. This involves a single deeper-seated non-
circular slip surface that cuts through to the base of the Whitby Mud-
stone Formation. The maximum depth of rupture for this interpreta-
tion is c. 50 m, somewhat deeper than Interpretation 1, with the slide
plane exploiting the full depth of the mudstones of the Mulgrave
Shale Member, probably along a landslide prone horizon at or near
the base of the formation in a bedding plane failure. The simplest
geometrical solution supported by geophysical and borehole evi-
dence is Interpretation 1. However, there is some uncertainty about
the reliability of the geophysical data at depths beyond 30 m, and
so the interpretation of the structural interpretation in Zone II is
still largely based on expert judgement.
Section B of Fig. 7, which corresponds to B–B′ in Fig. 5, is a represen-
tation of the western side of the Mark Nab landslide complex. The cross-
section depicts the form of the main slide surface and surficial shallow
multiple rotations that are deconstructing the foot mass. Erosion of
the toe of the landslide mass by Slidney Beck continues to destabilise
this part of the Mark Nab landslide system. This is a more widely ob-
served process that is actively destabalising the head of the main
Great Fryup Valley to the south east, and the heads of several other
large valleys. Key geomorphological features that are pronounced are
the break of slope associated with the strong and relatively resistant
Dogger and Blea Wyke sandstone beds, sharp scarps, and smooth con-
vex slopes found above the 320 m contour line. The upper part of this
slope is mantled by soliflucted head deposits that contain weathered
rounded sandstone boulders ‘ploughing boulders’ (Fig. 7B). Rill and
gully erosion on weathered Whitby Mudstone slopes at the rear scarp
(e.g. Loc. 12 in Fig. 5) has deposited colluvium onto the head of this
slide mass, and although vegetation of the scarp slope has somewhat
arrested this erosion process, this area is prone to future instability
due to river erosion. Advancement of the conceptual ground model re-
quires drilling rotary boreholes to +60 m in the main body (Zone II)
and to 150 m above the crown. Deeper holes would better constrain
the lithostratigraphic unit thicknesses, and provide samples for further
geological studies and materials testing.
6. Landslide movement history
6.1. Geomorphological evidence
There are no historic records of large-scale movements of the land-
slide; however, the relative sequence of movements can be inferred
from interpretation of the geomorphic and geological evidence. The trun-
cation of periglacial head deposits by the main (rear) back scarp (Figs. 5
and 7B), and the presence of head beneath the mudflow deposits (BH4,
Appendix A), constrain the main movement event to the early–late Holo-
cene times. Preservation of ridge and furrow plough lines in Zone III
(Fig. 6) suggests that this area has not been active in historic times. How-
ever, rotation and dislocation of Whitby Mudstone from the main land-
slide mass on the western flank (Fig. 7B), are evidence for a secondary
phase of deep-seated movement after the main event and this possibly
postdates some of the frontal mudflow activity in Zone III. The minor
scarps and benches shown in Zone II (Fig. 7B) provide evidence for ‘re-
cent’ to ‘old’ rotational slides, driven by toe erosion by Slidney Beck and
this process is still intermittently ‘active’. Very recent activity is limited
to small-scale translational debris and mudslides in colluvium and slipped
weathered or disturbed mudstone on stream banks and on the main
backscarp, and minor rockfall from the sandstone beds exposed along
main escarpment cliff (Fig. 5, Locs 4, 12 and 13).
6.2. Sediment dating
The frontal mudflow complex (Fig. 4, in Zone III) contains buried
palaeosols which were cored and dated to help constrain the age of the
latest mudflow events. Inspection of cores during logging of BH4A identi-
fied a peat deposit below a mudflow event horizon between 2.74 and
2.90 m b.g.l. (Appendix A). This soil horizon is composed of olive grey or-
ganic silt with pockets of amorphous peat containing fragments of wood
and charred material; the upper boundary is sharp indicating erosion by
an overriding mudflow event(s). Another horizon containing dark
brown peat with scattered rootlets and wood was also proved at a similar
depth in BH4, located approx 1 m to the west of BH4A (Fig. 5 and
Appendix A). These soils likely preserve deposition and vegetation of
shallow surface depressions on the upper surface of a mudflow.
Radiocarbon dating methods were used to determine the age of this
sediment. Fragments of wood were extracted during examination using
clean gloves and tools to minimise contamination. Precautions were
also taken during percussive drilling to minimise hydrocarbon contam-
ination (duck oil). The sediment samples were stored horizontally in a
humidity and temperature controlled fridge at 4 °C for c. 6 months at
BGS Keyworth prior to logging and sampling. Three of the fragments
of wood, extracted from various depths between 2.84 and 2.89 m in
BH4A, were analysed for age determination using Accelerator Mass
Spectrometry (AMS) techniques by Beta Analytic (Beta Nos 343215,
343216, 343217). Samples were analysed to ISO 17025 standards, and
were first pre-treated using the acid/alkali/acid method. The results of
the AMS analysis are shown in Table 3.
These dates constrain the latest mudflow event in BH4A to after
2270 yr BP. The earliest date of the buried palaeosol coincides with a pe-
riod of climatic deterioration to a wetter climate, but also major woodland
clearance by early Iron Age people, as indicated for example by pollen re-
cords from the nearby Fen Bogs site (Simmons et al., 1993; Innes, 1999).
This late-Holocene erosion event corroborates other records from wet-
lands formed behind landslides in the North York Moors at Gormire
Lake, St Helena and Blakey, where a link between soil erosion and defor-
estation has been suggested by Innes (1999).
Table 3
Radiocarbon-dated samples from the Mark Nab landslide mudflow cores.
Core Depth (m) OS Grid
reference (x,y,)
Sample type and
pre-treatment
Lab. ID
number
Measured
age (BP)
13C/12C
o/oo
Conventional
14
C age (BP)
2 Sigma calibration
BH4A 2.850–2.900 471566, 503341 Charred material:
acid/alkali/acid
Beta-343217 2240 ± 30 −23.0 2270 ± 30 Cal BC 400 to 350 (Cal BP 2350 to 2300)/Cal BC 290
to 230 (Cal BP 2240 to 2180)/Cal BC 220 to 210
(Cal BP 2170 to 2160)
BH4A 2.840 471566, 503341 Charred material:
acid/alkali/acid
Beta-343216 2340 ± 30 −23.2 2370 ± 30 Cal BC 510 to 390 (Cal BP 2460 to 2340)
BH4A 2.870 471566, 503341 Charred material:
acid/alkali/acid
Beta-343215 2340 ± 30 −26.2 2320 ± 30 Cal BC 400 to 380 (Cal BP 2360 to 2330)
305D.P. Boon et al. / Geomorphology 248 (2015) 296–310
7. Landslide trigger factors and mechanisms of failure
7.1. Slope stability models
A set of slope stability models were developed to quantitatively test
the conceptual ground model and explore the initial landslide trigger
factors and assess the current day stability state. The geotechnical prop-
erty values used in the stability models are provided in Table 4. The
values were estimated values, based mainly on the BGS's geotechnical
database for the Lias Group (Hobbs et al., 2005) and the general litera-
ture (Reeves et al., 2006). A small number of geotechnical tests (ring
shear and shear box) were carried out on samples of Whitby Mudstone
Formation collected from the landslide deposit itself (shear zone ex-
posed at head of gully near Loc 4, Fig. 5.) and other samples collected
from another landslide shear zone exposed at river level at nearby
East Arnecliff Wood. These data were not used directly but were used
to inform an expert judgement based estimate of the residual shear
strength of the Whitby Mudstone at the Nark Nab landslide site. The
density and porosity data were taken mainly from the BGS's geotechni-
cal database. Two main slope scenarios were modelled: i) a pre-failure
slope, and ii) the present day ‘post-failure’ slope.
7.2. Pre-failure slope scenarios
The slope stability model was used to perform a ‘back-analysis’ to in-
vestigate the sensitivity of the paraglacial Jurassic Escarpment to various
environmental trigger factors, including: (1) Glacial buttressing and loss
of that lateral support (de-buttressing), (2) presence and removal of a
pro-glacial lake, and (3) groundwater rise after deglaciation.
The model variables chosen to represent these primary factors were:
slope angle, surface water level, and groundwater level, respectively.
The pre-failure slope analyses used two approaches: ‘finite element’
using FLAC slope (version 7) and ‘limit-equilibrium’ using Galena (ver-
sion 6). The results from finite element modelling were, where appro-
priate, used to inform the geometry of the slip surface defined in the
limit-equilibrium model. Further details of the analysis methods and
Table 4
Geotechnical property values used for slope stability models (after Hobbs et al., 2005; Reeves et al., 2006; Hobbs and Boon, 2013). c′: effective cohesion; ϕ: effective angle of internal
friction.
Geological layer
(lithology)
Layer thickness
(m)
Saturated density
(kg m−3
)
Dry density
(kg m−3
)
Porosity, n
(%)
Pre-slip ‘peak’ Post-slip ‘residual’
c′
MPa
ϕ′
degr.
c′
MPa
ϕ′ r
(degr.)
Cloughton Formation (Sst) including Eller Beck Formation 20 2450 2300 0.15 0.30 35 0.0 35
Saltwick Formation (Sst/Slst/Mst) 25 2350 2200 0.15 0.20 25 0.0 25
Dogger & Blea Wyke Formations (Sst/Slst) 10 2300 2100 0.20 0.11 20 0.0 20
Whitby Mudstone Formation (Mst) 201 2060 1710 0.35 0.015 26 0.0 10
Cleveland Ironstone Formation (Slst/Mst/Irnst) infinite 2060 1710 0.35 0.5 30 0.5 30
Fig. 8. Results of FLAC slope stability modeling. A) Geological layers. Properties ar given in Table 4. Note: Ice mass is substituted for Whitby Mudstone Formation properties due to software
limitations. B) Results for a glacially buttressed slope scenario. C: Results for a glacially de-buttressed slope scenario.
306 D.P. Boon et al. / Geomorphology 248 (2015) 296–310
results are provided in Hobbs and Boon (2013). The surface profile was
based on a structural reconstruction of the cross-section in Fig. 7A,
which assumes a 43° planar slope.
7.3. Glacial buttressing
To investigate the potential effect of glacial buttressing on the
sequence of slope deformation we considered two simple models:
i) Ice buttressed: over-steepened slope, 80 m high, with ice buttressing
up to the 270 m contour line.
ii) Non-buttressed: over steepened slope, 125 m high, with no ice
buttressing.
Both scenarios were modelled in FLAC using the same geological unit
thicknesses (Fig. 8A) and ‘peak’ strength properties (Table 4). The water
table in model (i) was assumed to be deep, assuming no free groundwa-
ter and deep permafrost conditions, whereas the water table in model
(ii) assumes a shallow water table and re-establishment of the regional
water table and potential for excess pore pressure build up in the slope.
The FLAC modelling results are shown in Fig. 8B,C. Fig. 8B shows that
the over steepened ‘buttressed’ slope is inherently unstable (FoS of 0.95)
and prone to failure, but with shallow movement occurring as minor
shallow rotation affecting only the Whitby Mudstone and Dogger
units. This result supports the idea of an initial ‘upper’ slope failure (as
implied by ‘Interpretation 1’; Fig. 7A). The results of model (ii) in
Fig. 8C, shows that the slope is also unstable when glacial de-
buttressing has occurred, but the failure mode is significantly different
from that of the buttressed slope stability model (i), with a deep-
seated rotation affecting the full slope in Fig. 8C. One key limitation of
this slope modelling method is that the model (i) substitutes the ice
mass for a Whitby Mudstone mass due to software limitations. There-
fore, model (i) is unlikely to produce a deeper basal failure mode (sim-
ilar to Interpretation 2 in Fig. 7). However, a deep-seated bedding-
controlled failure with a basal slip surface geometry which daylights
within the ice mass, similar to Interpretation 2, is also a feasible failure
mechanism.
7.4. Model sensitivity
One assumption in the models is that the para-glacial slope was c.
43°. This slope angle is based on cross-section reconstruction and so
there is a lot of uncertainty in the pre-failure slope angle. To investigate
the sensitivity of the stability models to this uncertainty, and to better
understand the general relationship between slope angle and stability
condition across the region, we modelled a range of generic Whitby
Mudstone Formation slopes using FLAC. We use ‘peak’ strength proper-
ties (Table 4) and assume the formation is 90 m thick. The results are
plotted in Fig. 9A, which shows that the Jurassic Escarpment becomes
increasingly unstable as slope angle increases. This result is not surpris-
ing; however, the relationship suggests that if a 90 m thick Whitby
Mudstone Formation slope exceeds a critical angle of c. 22°, the failure
mode is more likely to favour deep-seated rotational sliding over a
translation sliding mode. The slide plane exploit any ‘landslide prone
horizons’ within the Whitby Mudstone Formation and the primary
shear surface daylights at the base of the escarpment (in a toe failure)
above the Cleveland Ironstone Formation. To validate the relationship
with empirical data, slope angles of failed and non-failed slopes in
Great Fryup Dale were measured remotely using the GeoVisionary and
slope profile measurment tool using a slope model derived from the
0.25 m resolution LiDAR data (Fig. 4). Using this approach we find that
deep-seated landslides tend only to be found on the Jurassic escarpment
when the average slope angle exceeds c. 21°. This empirical method not
only provides a useful ‘sense check’ on the assumptions made in the sta-
bility modelling, but also provides an improved understanding and a
critical slope angle cut off which could be applied for regional scale land-
slide susceptibility mapping purposes.
FoS for a conceptual pre-slipped Whitby Mudstone slope (i) is 0.8,
suggesting that without additional lateral support (i.e. glacial
buttressing) this slope would not have stood up on its own at c.
43°. Following this logic it is highly plausible that an initial ‘upper’
slope failure initiated in the upper part of the escarpment (a ‘slope
failure’) while the glacier was still providing some lateral support
(i.e. paraglacial failure). The slope may have even started to relax
due to lateral unloading during valley glaciation phases, with
Fig. 9. Plots showing the results of slope stability model sensitivity analysis of key physical factors for Whitby Mudstone Formation slopes: A) relationship between slope angle and FoS;
B) glacial-lake level and FoS; and C) FoS and regional groundwater level. (A) and (B) assume a deep-seated non-circular rotational failure mode on a 43° hillslope in 90 m thick Whitby
Mudstone Formation mudstone.
307D.P. Boon et al. / Geomorphology 248 (2015) 296–310
dilation of pre-existing discontinuities (e.g. joints, faults, fractures)
which would have pre-prepared the slope with increased the sec-
ondary hydraulic permeability. The combined effects of these geo-
logical processes would have preconditioned the slope for a further
‘lower’ failure as the ice mass reduced in volume. We have represent-
ed this rock mass dilation effect in our stability models by addition of
a tension crack 10 m behind the crown. However, the presence of
frozen ground under permafrost conditions could also have in-
creased the shear strength of the near surface slope materials,
delaying development of a shallower failure mechanism in favour
of a deeper-seated slope failure which propagates beneath the fro-
zen crust. This failure mechanism could account for the existence
of large intact blocks preserved in Zone II.
Although the pre-slip stability model (Fig. 8A) results presented
thus far lend support to a deep-seated rotational mode of failure
during a partial glacial de-buttressing phase, other potential trigger
factors, such as the reported pro-glacial lake in Eskdale and a even-
tual post-glacial rise in regional groundwater levels, may also
have contributed to the hillslope instability along the non-
glaciated parts of the escarpment and in other regions south of
the Devensian limit, such as the Cotswolds. These two additional
triggering factors were investigated using modified slope stability
models and the methods and results are briefly described in the
following subsection.
7.5. Glacial lake drawdown scenario
Kendall (1902) proposed the Esk valley was once flooded by a pro-
glacial lake, Lake Eskdale, which reached a maximum height of 225 m
aOD (Kendall, 1902; Radge, 1939; Gregory, 1962a,b; Kent et al., 1980;
Murton and Murton, 2011). If this lake really did exist, the lake water
would have partially filled Great Fryup Dale and the adjacent valleys.
The effect of a changing water body level on the stability of the pre-
slip Jurassic Escarpment was modelled by varying the level of the
water table in the stability model.
The results, plotted as the relationship between lake level and stabil-
ity state (FoS) in Fig. 9B, indicate that a rising lake level would have pro-
moted stability, but that a rapid lowering of the lake level, while the
slope is still in a saturated state, would have promoted instability.
7.6. Groundwater rebound scenario
A similar reduction in stability is also achieved by raising the region-
al groundwater level, so draining of a pro-glacial lake would probably
not have been required to trigger the initial main failure as the slope
was already likely metastable anyway. The climatic amelioration at
the start of the Holocene would have seen re-establishment of the sur-
face drainage network and a rise in regional groundwater levels. This is
evidenced by formation of sapping erosion related landforms such as
the Hole of Horcum which is reputed to have formed shortly after the
LGM (Cooper, 2007). To test the sensitivity of an oversteepened deglaci-
ated slope to rising groundwater levels we back-analysed a Whitby
Mudstone slope using the reconstructed pre-slip hillslope geometry of
43° and peak strength values (Table 4). The groundwater level was
raised in increments of 10 m to simulate rising groundwater conditions,
under long-term ‘drained’ effective stress pore water pressure condi-
tions. The model results summarised in Fig. 9C indicate that a rise in
groundwater level significantly reduces the stability of the Jurassic es-
carpment slope. The model is also very sensitive to slope angle
(Fig. 9A). The stability model results from Hobbs and Boon (2013)
show that a deep-seated rotational failure mode is favoured when
groundwater level rises above around 303 m aOD. When groundwater
level reaches this elevation the jointed sandstone beds of the Dogger
Formation would have become saturated and started to behave a
minor aquifer providing water into the landslide-prone Whitby Mud-
stone Formation unit below, hence promoting instability.
7.7. Likely trigger mechanisms of UK Jurassic escarpment landslides
The most feasible primary trigger mechanism for the initial Mark
Nab landslide is loss of lateral support due to over steepening of the
slope by glacial erosion and de-butressing, although groundwater rise
likely also played a role. Subsequent increases in effective rainfall and
stream down-cutting and erosion likely drove secondary movements,
further block disruption, and initiated subsequent first time failures at
the heads of incised valleys. Seismic and rainfall triggering were also
considered but not modelled. More widely, the combined roles of
(i) glacial de-buttressing, as described by McColl and Davies (2013);
and (ii) bedding-controlled failure, similar to that described in SE
England by Bromhead and Ibsen (2004), and (iii) regional groundwater
rise, likely triggered and drove landslide activity along glaciated and
non-glaciated Jurassic slopes in Britain. In the deep supposedly non-
glaciated (during the Devensian) incised moorland valleys to the
south, such as Rosedale, it is possible that first-time failures occurred
much earlyer due to over-steepening that occurred during an earlier
valley glaciation. However, it is also possible that those failures occurred
due to rising groundwater level conditions, although more investigation
is needed.
Reconstruction of the slope profile at Mark Nab also provides a new
estimate of recession rate for the Jurassic Escarpment in glaciated val-
leys in Northern Britain through the Holocene; we estimate between
0.01 and 0.005 m yr−1
of recession to have occurred there since the
LGM, mainly controlled by mass movement processes. This rate as-
sumes the main phase of landslide-driven erosion initiated c.
13,000 yr BP, at the end of the Late Devensian, although more precise
dating of the main failure would help constrain these estimates.
7.8. Current stability state
The residual stability of the majority of relict landslides in the UK is
largely unknown and likely highly variable, and although they are gen-
erally considered dormant or inactive (Jones and Lee, 1994), they have
been known to reactivate and cause damage when external environ-
mental conditions change (e.g. Fish et al., 2006). Effective assessment
and management of relict slopes requires appropriate site investigation
and a good conceptual ground model.
We used the Galena software package to model the stability state of
the ‘present day’ slope using the current topographic profile determined
from the 5-m NextMap, and ‘residual’ shear strength values for the
landslide-prone Whitby Mudstone Formation (Table 4). We also con-
sidered sensitivity of the model to different slip plane geometry and
modelled the stability condition using both the shallow and deep slip
plane geometries proposed in ‘Interpretation 1’ and ‘Interpretation 2’
of Fig. 7A, respectively.
The Sarma non-vertical (multi) slice, non-circular analyses were
used for all Galena models. The ‘residual’ strength value (ϕ′r) for the
Whitby Mudstone Formation was increased from the laboratory mea-
sured value of 9° to 10° to account for the fact that the clay is unlikely
to be at fully remoulded strength at the field scale due to secondary con-
solidation, inclusion of lithorelicts, discontinuity roughness effects, and
possible added cohesion provided by secondary crystallisation along an-
cient inactive shear surfaces.
The results of the Interpretation 1 based model (involving an ‘upper’
and ‘lower’ slip surface geometry based on Fig. 7A), indicate that the
‘upper’ landslide mass is currently stable (FoS = 2.71), and the separate
‘lower’ slide mass of Interpretation 1 is also stable (FoS = 1.42). If we as-
sume that both slip surfaces are connected and the landslide mass be-
haves as one coherent mass, the slope is also seemingly globally stable
(FoS = 1.85). There was no field-based evidence to suggest that the
main landslide mass is globally unstable and the stability modelling
strengthens the notion of the slope being ‘dormant’ rather than ‘Inactive
– Ancient’. However, the stability of the ‘upper’ mass would decrease if
the ‘lower’ mass were to move, as the latter provides some clear
308 D.P. Boon et al. / Geomorphology 248 (2015) 296–310
buttressing, these interdependencies highlight the dynamic nature of
these landslide systems. It seems likely that complex and delicate phys-
ical and hydrogeological feedbacks are still in operation within these
relict slopes.
7.9. Model uncertainty and sensitivity
7.9.1. Current day slope
There is uncertainty in the ‘current day’ stability model, which relies
heavily on assumptions about the geometry of the slide plane(s). The
slide plane geometry is more certain where there is drilling and geo-
physics data (Zone I). There is some uncertainty in the ‘post-slip-resid-
ual’ model input values (Table 4) which were limited to lab-scale test
results so these may not accurately reflect field-scale values. Although
some provision was made for this, by increasing residual strength
value slightly from 9° to 10°, the material and mass strength will likely
vary at the field-scale due to a variety of multi-scale effects and process-
es, including: variability in clay content and type, re-consolidation (Gibo
et al., 2002), large-scale 3D internal friction effects between landslide
blocks (Morgenstern, 1995), external friction effects along mudstone
landslide boundaries (e.g. Massey et al., 2013), and secondary
mineralisation increasing shear resistance (adding cohesion). Another
source of error in the stability models is the accuracy of the position of
the water table, and the assumption this is static. In the ‘current day’
slope model the water table is assumed planar with its depth informed
by piezometer data from BH2, although this level is unlikely to be uni-
form across the slope, as the occurrence of springs testifies.
7.9.2. Pre-slide slope
The pre-slide slope stability models have some major limitations, for
example, the pre-slipped slope profile, groundwater levels and pre-slip
slip surface geometry are estimates, constrained by limited ground
monitoring data, as previously discussed. The pre-slide slope stability
model is very sensitive to slope angle, as shown from the sensitivity
analysis of slope angle in Fig. 9A. The geotechnical values (Table 4) are
also largely estimates based on values from the literature and some lim-
ited shear strength testing from on-site and nearby site materials. Nev-
ertheless, back-analysis using slope stability modelling techniques does
offer a useful tool to test our understanding of plausible failure mecha-
nisms in ancient landslides, and informs the current day regional hazard
and sensitivity of the system to environmental and anthropogenic
perturbations. To reduce the uncertainties in the ground model, and
the stability models developed from it, deep drilling is required with
groundwater monitoring, geotechnical testing, dating and mineralogi-
cal studies, and further geophysics (e.g. passive and active seismic).
8. Conclusions
A combination of geological, geomorphological, geophysical, dating,
and stability modelling techniques have been applied here to recon-
struct the 2D architecture and failure mechanism of a relict landslide
on the Jurassic Escarpment in Northern England. This paper provides
the basis for a preliminary ground model for the Mark Nab slope and
the numerous other large, deep-seated bedrock landslides typically
found across the North York Moors region. The study shows that the
large slope failures are typically developed in weak mudstone lithology
of the Lower Jurassic mudstones (Whitby Mudstone Formation) and the
principal failure mechanism is geologically controlled by the thickness
of the mudstone and the presence of bedding controlled failures along
‘slide-prone horizons’. Geomorphological evidence and new radiocar-
bon dating of sediment provide new understanding of the landslide
movement history, and this knowledge helps inform expert based land-
slide hazard assessment in the region. The study includes the first appli-
cation of the ERT geophysical technique to image a deep-seated
landslide in Jurassic rocks in the Cleveland Basin. The combined ap-
proach, where ERT is calibrated with borehole data and detailed
geological mapping, proved crucial in the assessment of the landslide
deposit volume, 3D internal architecture and depth of principal slip sur-
faces. Static slope stability modelling (non-dynamic) suggests that the
slope most likely initially failed in response to glacial over-steepening
and de-buttressing. However, groundwater rise is also a contributing
factor to instability in the region, and may have triggered and
reactivated the large landslides in the adjacent non-glaciated valleys,
such as Rosedale. Slope reconstruction provides new recession rate esti-
mations for the North Yorkshire Jurassic Escarpment. Although current-
ly inactive and dormant, the frontal mudflow complex at Mark Nab has
been active within the last 2270 years BP, and this and similar slopes are
moderately prone to becoming unstable again under future wetter cli-
mates. These mudflow systems can be easily recognised and mapped
using modern high resolution LiDAR data to improve landslide hazard
maps and risk models. Importantly, this slope and other similar ones
are also vulnerable to renewed instability caused by adverse anthropo-
genic activity, drainage alteration or major civil engineering works. The
combined geomorphological and geophysical approaches described
through this case study will be of interest to hazard geologists and engi-
neering geologists working on landslide problems in the NYM and in
similar geological settings, including other Jurassic escarpments in the
UK and overseas. The paper is also relevant to those involved with or
planning landslide hazard and risk studies in high latitude regions
currently undergoing active de-glaciation.
Acknowledgements
The authors would like to thank landowners Mr Stephen Smith,
Mr Robert Smith, and Lord Burridge for allowing us access to the field
site. Thanks to the BGS Staff, particularly Vanessa Banks, Anthony
Cooper, and David Schofield for helpful reviews of the early manuscript.
We would also like to express our appreciation to the BGS Dando dril-
ling team: Stephen Thorpe, Carl Horabin, Helen Smith, Dave Morgan,
‘Gill’, and Andrew Naylor. Henry Holbrook and Simon Ward are ac-
knowledged for cartography, and Hannah Jordan, Mark Barron, Andy
Howard, Chris Vane, and Helen Reeves are thanked for discussions in
the field and lab. The editor, Takashi Oguchi, and reviewers Greg
Botha and another anonymous reviewer are thanked for their construc-
tive feedback on the paper. The work was publically funded through
BGS/NERC National Capability funding. The BGS authors publish with
the permission of the Executive Director of the British Geological Survey
(Natural Environmental Research Council).
Appendix A. Supplementary data
Supplementary data to this article can be found online at http://dx.
doi.org/10.1016/j.geomorph.2015.07.005.
References
Anon, 1972. The preparation of maps and plans in terms of engineering geology. Q. J. Eng.
Geol. 5, 297–367.
Anon, 1995. The description and classification of weathered rocks for engineering
purposes. Engineering Group of the Geological Society Working Party report. Q.
J. Eng. Geol. 28, 207–242 (.2).
Barron, A.J.M., Lott, G.K., Riding, J.B., 2012. Stratigraphical framework for the Middle Jurassic
strata of Great Britain and the adjoining continental shelf. British Geological Survey
Research Report RR/11/06 (187 pp.).
British Standards Institution, 1999. BSI 5930:1999 Code of Practice for Site Investigations,
Incorporating Amendments 1 and 2. British Standards Institution, London.
Bromhead, E.N., Ibsen, M.-L., 2004. Bedding-contolled coastal landslides in Southeast
Britain between Axmouth and the Thames Estuary. Landslides 1, 131–141.
Chambers, J.E., Ogilvy, R.D., Kuras, O., Cripps, J.C., Meldrum, P.I., 2002. 3D electrical imag-
ing of known targets at a controlled environmental test site. Environ. Geol. 41,
690–704.
Chambers, J.E., Wilkinson, P.B., Kuras, O., Ford, J.R., Gunn, D.A., Meldrum, P.I., Pennington,
C.V.L., Weller, A.L., Hobbs, P.R.N., Ogilvy, R.D., 2011. Three-dimensional geophysical
anatomy of an active landslide in Lias Group mudrocks, Cleveland Basin, UK. Geomor-
phology 125, 472–484.
Chiverrell, R.C., Thomas, G.S.P., 2010. Extent and timing of the Last Glacial Maximum
(LGM) in Britain and Ireland: a review. J. Quat. Sci. 25, 535–549.
309D.P. Boon et al. / Geomorphology 248 (2015) 296–310
Cooper, R.G., 2007. Mass movements in Great Britain. Geological Conservation Review
Series No. 33. Joint Nature Conservation Committee, Peterborough.
Cox, B.M., Sumbler, M.G., Ivimey-Cook, H.C., 1999. A formational framework for the Lower
Jurassic of England and Wales (onshore area). British Geological Survey Research
Report RR/99/01. British Geological Survey.
Cruden, D.M., Varnes, D.J., 1996. Landslide types and processes. Special Report 247: Land-
slides: Investigation and Mitigation. Transportation Research Board, Washington D.C.
Fell, R., Corominas, J., Bonnard, C., Cascini, L., Leroi, E., Savage, W.Z., 2008. Guidelines for
landslide susceptibility, hazard and risk zoning for land use planning. Eng. Geol.
102, 85–98.
Fish, P.R., Moore, R., Carey, J.M., 2006. Landslide geomorphology of Cayton Bay, North
Yorkshire, UK. Proc. Yorks. Geol. Soc. 56, 5–14.
Fookes, P.G., 1997. Geology for engineers: the geological model, prediction and perfor-
mance. Q. J. Eng. Geol. Hydrogeol. 30, 293–424.
Fox-Strangways, C.F., Reid, C., Barrow, G., 1885. The geology of Eskdale, Rosedale & etc.
Explanation of quarter-sheet 96 N.E. New Series Sheet 43. Memoirs of the Geological
Survey (56 pp.).
Gibo, S., Egashira, K., Ohtsubo, M., Nakamura, S., 2002. Strength recovery from residual
state in reactivated landslides. Geotechnique 52 (9), 683–686.
Gregory, K.J., 1962a. Contributions to the Geomorphology of the North York Moors.
(Unpublished PhD thesis).
Gregory, K.J., 1962a. The deglaciation of Eastern Eskdale, Yorkshire. 1962. Proc. Yorks.
Geol. Soc. 33, 363–380.
Griffiths, J.S. (Ed.), 2002. Mapping in engineering geologyGSL Key Issues in Earth Sciences.
Geological Society of London, p. 294.
Hobbs, P.R.N., Boon, D.P., 2013. Great Fryup landslide: slope stability analyses. British Geo-
logical Survey Internal Report IR/13/002. British Geological Survey, Nottingham.
Hobbs, P.R.N., Entwisle, D.C., Northmore, K.J., Sumbler, M.G., Jones, L.D., Kemp, S., Self, S.,
Barron, M., Meakin, J.L., 2005. Engineering geology of British rocks & soils: the Lias
Group. British Geological Survey, Internal Report No. IR/05/008.
Holliday, D.W., Howard, A.S., Pattison, 1992. Sheet 43 Egton (Eskdale and Farndale) Solid
and Drift Edition. British Geological Survey. HMSO.
Howard, A.S., 1985. Lithostratigraphy of the Staithes Sandstone and Cleveland Ironstone
formations (Lower Jurassic) of north-east Yorkshire. Proc. Yorks. Geol. Soc. 45,
261–275.
Innes, J.B., 1999. In: Bridgland, D.R., Horton, B.P., Innes, J.B. (Eds.), The Quaternary
of North-East England. Field Guide. Quaternary Research Association, London,
pp. 21–34.
Innes, J.B., Rutherford, M.M., O'Brien, C.E., Bridgland, D.R., Mitchell, W.A., Long, A.J., 2009.
Late Devensian environments in the Vale of Mowbray, North Yorkshire, UK: evidence
from palynology. Proc. Geol. Assoc. 120, 199–208.
Johnson, R., Fish, P., 2012. Reactivation of the coastal landslide system at Cayton Bay,
North Yorkshire, UK. Proc. Yorks. Geol. Soc. 59, 77–89.
Jones, R.L., 1977. Late Quaternary vegetational history of the North York Moors. V. The
Cleveland dales. J. Biogeogr. 4, 353–362.
Jones, R.L., 1999. In: Bridgland, D.R., Horton, B.P., Innes, J.B. (Eds.), The Quaternary of
North-East England. Field Guide. Quaternary Research Association, London (204 pp.).
Jones, D.K.C., Lee, E.M., 1994. Landslides and Landsliding in Great Britain. HMSO, London.
Jongmans, D., Garambois, S., 2007. Geophysical investigation of landslides: a review. Bull.
Soc. Geol. Fr. 178, 101–112.
Kendall, P.F., 1902. A system of glacial lakes in the Cleveland Hills. Q. J. Geol. Soc. 58,
471–571.
Kent, P., Wilson, V., Gaunt, G.D., 1980. British Regional Geology Eastern England from the
Tees to The Wash. Second ed. Institute of Geological Sciences. HMSO.
Lapenna, V., Lorenzo, P., Perrone, A., Piscitelli, S., Rizzo, E., Sdao, F., 2005. 2D electrical
resistivity imaging of some complex landslides in the Lucanian Apennine chain,
southern Italy. Geophysics 70, B11–B18.
Marsay, B., 2010. “T'ills was Fallin Down” The Great Landslip of 1872. Bilsdale Study
Group, p. 82.
Massey, C.I., Petley, D.N., McSaveney, M.J., 2013. Patterns of movement in reactivated
landslides. Eng. Geol. 159, 1–19.
McColl, S.T., Davies, T.H.R., 2013. Large ice-contact slope movements: glacial buttressing,
deformation and erosion. Earth Surf. Process. Landf. 23, 1102–1115.
Merritt, A.J., Chambers, J.E., Murphy, W., Wilkinson, P.B., West, L.J., Gunn, D.G., Meldrum,
P.I., Kirkham, M., Dixon, N., 2013. 3D ground model development for an active land-
slide in Lias mudrocks using geophysical, remote sensing and geotechnical methods.
J. Int. Consortium Landslides http://dx.doi.org/10.1007/s10346-013-0409-1.
Morgenstern, N.R., 1995. Keynote paper: the role of analysis in the evaluation of slope
stability. In: Bell (Ed.), Landslides. Balkema, Rotterdam.
Murton, D.K., Murton, J.B., 2011. Middle and Late Pleistocene glacial lakes of lowland
Britain and the southern North Sea Basin. Quat. Int. 260, 115–142.
Olayinka, A.I., Yaramanci, U., 2000. Assessment of the reliability of 2D inversion of
apparent resistivity data. Geophys. Prospect. 48, 293–316.
Powell, J.H., 2010. Jurassic sedimentation in the Cleveland Basin: a review. Proc. Yorks.
Geol. Soc. 58, 21–72.
Powell, J.H., Cooper, A.H., Benfield, A.C., 1992. Geology of the country around Thirsk.
Memoir of the British Geological Survey, Sheet 52 (England and Wales).
Radge, G.W., 1939. The glaciation of North Cleveland. Proc. Yorks. Geol. Surv. 24, 190–205.
Clay materials used in construction. In: Reeves, G.M., Sims, I., Cripps, J.C. (Eds.), The
Geological Society, Engineering Geology Special Publication No. 21.
Schuster, R.L., Highland, L.M., 2001. Socioeconomic and environmental impacts of land-
slides in the Western Hemisphere. U.S. Dept. of the Interior, U.S. Geological Survey
Open File Report 01-0276.
Senior, J., Rose, J., 1994. The Jurassic, Tertiary and Quaternary around Great Ayton and
Roseberry Topping, Cleveland Hills, 11. In: Scrutton, C. (Ed.), Yorkshire Rocks and
Landscape — A Field Guide. Yorkshire Geological Society.
Simmons, I.G., Atherden, M.A., Cloutman, E.W., Cundill, P.R., Innes, J.B., Jones, R.L., 1993.
Prehistoric environments. In: Spratt, D.A. (Ed.), Prehistoric and Roman Archaeology
of North-East YorkshireCouncil for British Archaeology Research Report 87, BAR
British Series 104. Council for British Archaeology, London, pp. 15–50.
Waltham, A., Forster, A., 1999. Man as geological agent. Geology Today vol. 217. Blackwell
Science Ltd. (November–December 1999).
Young, T.P., 1994. The Blea Wyke Sandstone Formation (Jurassic, Toarcian) of Rosedale,
North Yorkshire, UK. Proc. Yorks. Geol. Soc. 50, 129–142.
310 D.P. Boon et al. / Geomorphology 248 (2015) 296–310

Mais conteúdo relacionado

Mais procurados

The Geology of South Central Milos, L.Begley.
The Geology of South Central Milos, L.Begley.The Geology of South Central Milos, L.Begley.
The Geology of South Central Milos, L.Begley.Loman Begley
 
Lunar mare deposits_associated_with_orientale_basin
Lunar mare deposits_associated_with_orientale_basinLunar mare deposits_associated_with_orientale_basin
Lunar mare deposits_associated_with_orientale_basinSérgio Sacani
 
Kinds of Mountains - Lea Jean S. Sumayan
Kinds of Mountains - Lea Jean S. SumayanKinds of Mountains - Lea Jean S. Sumayan
Kinds of Mountains - Lea Jean S. SumayanLea Jean Sumayan
 
Roads and highways
Roads and highwaysRoads and highways
Roads and highwayszerbonics
 
CM LinkedIn Writing Sample
CM LinkedIn Writing SampleCM LinkedIn Writing Sample
CM LinkedIn Writing SampleLori A. Ruff
 
Zealandia: Earth' Hidden Continent
Zealandia: Earth' Hidden ContinentZealandia: Earth' Hidden Continent
Zealandia: Earth' Hidden ContinentVIVEKANAND GUPTA
 
Climate Change an hazard zonation on the circum-arctic permafrost region
Climate Change an hazard zonation on the circum-arctic permafrost regionClimate Change an hazard zonation on the circum-arctic permafrost region
Climate Change an hazard zonation on the circum-arctic permafrost regionSimoneBoccuccia
 
Mineral potentials of ethiopia
Mineral potentials of ethiopiaMineral potentials of ethiopia
Mineral potentials of ethiopiaasmamawkiros1
 
The Effects of Variable Precipitation on Discharge and Sediment Transport in ...
The Effects of Variable Precipitation on Discharge and Sediment Transport in ...The Effects of Variable Precipitation on Discharge and Sediment Transport in ...
The Effects of Variable Precipitation on Discharge and Sediment Transport in ...Agriculture Journal IJOEAR
 
Civil Engineering Introduction
Civil Engineering IntroductionCivil Engineering Introduction
Civil Engineering IntroductionMark Rollins
 
What is Geoscience?Objectives.
What is Geoscience?Objectives.What is Geoscience?Objectives.
What is Geoscience?Objectives.Uday Kumar Shil
 

Mais procurados (19)

The Geology of South Central Milos, L.Begley.
The Geology of South Central Milos, L.Begley.The Geology of South Central Milos, L.Begley.
The Geology of South Central Milos, L.Begley.
 
Topography
TopographyTopography
Topography
 
Lunar mare deposits_associated_with_orientale_basin
Lunar mare deposits_associated_with_orientale_basinLunar mare deposits_associated_with_orientale_basin
Lunar mare deposits_associated_with_orientale_basin
 
Chapter fourteen
Chapter fourteenChapter fourteen
Chapter fourteen
 
Engineering Geology
Engineering Geology Engineering Geology
Engineering Geology
 
Kinds of Mountains - Lea Jean S. Sumayan
Kinds of Mountains - Lea Jean S. SumayanKinds of Mountains - Lea Jean S. Sumayan
Kinds of Mountains - Lea Jean S. Sumayan
 
Roads and highways
Roads and highwaysRoads and highways
Roads and highways
 
cggv_0000025472
cggv_0000025472cggv_0000025472
cggv_0000025472
 
Ch13
Ch13Ch13
Ch13
 
Zealandia
ZealandiaZealandia
Zealandia
 
CM LinkedIn Writing Sample
CM LinkedIn Writing SampleCM LinkedIn Writing Sample
CM LinkedIn Writing Sample
 
Engineering geology
Engineering geologyEngineering geology
Engineering geology
 
Zealandia: Earth' Hidden Continent
Zealandia: Earth' Hidden ContinentZealandia: Earth' Hidden Continent
Zealandia: Earth' Hidden Continent
 
Climate Change an hazard zonation on the circum-arctic permafrost region
Climate Change an hazard zonation on the circum-arctic permafrost regionClimate Change an hazard zonation on the circum-arctic permafrost region
Climate Change an hazard zonation on the circum-arctic permafrost region
 
Mineral potentials of ethiopia
Mineral potentials of ethiopiaMineral potentials of ethiopia
Mineral potentials of ethiopia
 
The Effects of Variable Precipitation on Discharge and Sediment Transport in ...
The Effects of Variable Precipitation on Discharge and Sediment Transport in ...The Effects of Variable Precipitation on Discharge and Sediment Transport in ...
The Effects of Variable Precipitation on Discharge and Sediment Transport in ...
 
What is Topography
What is TopographyWhat is Topography
What is Topography
 
Civil Engineering Introduction
Civil Engineering IntroductionCivil Engineering Introduction
Civil Engineering Introduction
 
What is Geoscience?Objectives.
What is Geoscience?Objectives.What is Geoscience?Objectives.
What is Geoscience?Objectives.
 

Semelhante a Boon et al 2015 Geomorphology 248 pp296-310

Baseline Lithogeochemistry Project Report
Baseline Lithogeochemistry Project ReportBaseline Lithogeochemistry Project Report
Baseline Lithogeochemistry Project ReportDr Nick Le Boutillier
 
Antarctic Granites Paper
Antarctic Granites PaperAntarctic Granites Paper
Antarctic Granites PaperRobert Smillie
 
2016.11.01 Atlantic Irl (1)
2016.11.01 Atlantic Irl (1)2016.11.01 Atlantic Irl (1)
2016.11.01 Atlantic Irl (1)Lewis Whiting
 
07_chapter1-Ajay thesi.pdf
07_chapter1-Ajay thesi.pdf07_chapter1-Ajay thesi.pdf
07_chapter1-Ajay thesi.pdfNiranjanMohanty9
 
LPSC Venus Poster Final3-shrunk
LPSC Venus Poster Final3-shrunkLPSC Venus Poster Final3-shrunk
LPSC Venus Poster Final3-shrunkNicholas Kelly
 
Shear wave velocity and Geology Based Seismic Microzonation of Port-au-Prince...
Shear wave velocity and Geology Based Seismic Microzonation of Port-au-Prince...Shear wave velocity and Geology Based Seismic Microzonation of Port-au-Prince...
Shear wave velocity and Geology Based Seismic Microzonation of Port-au-Prince...Johana Sharmin
 
Geological synthesis excercise in stonehaven using fieldmove app
Geological synthesis excercise in stonehaven using fieldmove app Geological synthesis excercise in stonehaven using fieldmove app
Geological synthesis excercise in stonehaven using fieldmove app TomAdamson7
 
Dissertation d ibba_thurley_ct
Dissertation d ibba_thurley_ctDissertation d ibba_thurley_ct
Dissertation d ibba_thurley_ctCallum Thurley
 

Semelhante a Boon et al 2015 Geomorphology 248 pp296-310 (20)

MSci Project Finished Version
MSci Project Finished VersionMSci Project Finished Version
MSci Project Finished Version
 
Dissertation
DissertationDissertation
Dissertation
 
Donaldson-2015
Donaldson-2015Donaldson-2015
Donaldson-2015
 
Baseline Lithogeochemistry Project Report
Baseline Lithogeochemistry Project ReportBaseline Lithogeochemistry Project Report
Baseline Lithogeochemistry Project Report
 
Wilson200722222222222
Wilson200722222222222Wilson200722222222222
Wilson200722222222222
 
LundSnee_Miller_of2015-2_text
LundSnee_Miller_of2015-2_textLundSnee_Miller_of2015-2_text
LundSnee_Miller_of2015-2_text
 
Thesis BSc Geology.docx
Thesis BSc Geology.docxThesis BSc Geology.docx
Thesis BSc Geology.docx
 
Antarctic Granites Paper
Antarctic Granites PaperAntarctic Granites Paper
Antarctic Granites Paper
 
2016.11.01 Atlantic Irl (1)
2016.11.01 Atlantic Irl (1)2016.11.01 Atlantic Irl (1)
2016.11.01 Atlantic Irl (1)
 
Zealandia
ZealandiaZealandia
Zealandia
 
ENV 101 Ch04 lecture ppt_a
ENV 101 Ch04 lecture ppt_aENV 101 Ch04 lecture ppt_a
ENV 101 Ch04 lecture ppt_a
 
07_chapter1-Ajay thesi.pdf
07_chapter1-Ajay thesi.pdf07_chapter1-Ajay thesi.pdf
07_chapter1-Ajay thesi.pdf
 
GSA2015_SD_KW_Page1 (1) (1) (2)
GSA2015_SD_KW_Page1 (1) (1) (2)GSA2015_SD_KW_Page1 (1) (1) (2)
GSA2015_SD_KW_Page1 (1) (1) (2)
 
Dry Valleys Granites
Dry Valleys GranitesDry Valleys Granites
Dry Valleys Granites
 
LPSC Venus Poster Final3-shrunk
LPSC Venus Poster Final3-shrunkLPSC Venus Poster Final3-shrunk
LPSC Venus Poster Final3-shrunk
 
Shear wave velocity and Geology Based Seismic Microzonation of Port-au-Prince...
Shear wave velocity and Geology Based Seismic Microzonation of Port-au-Prince...Shear wave velocity and Geology Based Seismic Microzonation of Port-au-Prince...
Shear wave velocity and Geology Based Seismic Microzonation of Port-au-Prince...
 
Dissertation
DissertationDissertation
Dissertation
 
quartoo sand
quartoo sandquartoo sand
quartoo sand
 
Geological synthesis excercise in stonehaven using fieldmove app
Geological synthesis excercise in stonehaven using fieldmove app Geological synthesis excercise in stonehaven using fieldmove app
Geological synthesis excercise in stonehaven using fieldmove app
 
Dissertation d ibba_thurley_ct
Dissertation d ibba_thurley_ctDissertation d ibba_thurley_ct
Dissertation d ibba_thurley_ct
 

Boon et al 2015 Geomorphology 248 pp296-310

  • 1. A combined geomorphological and geophysical approach to characterising relict landslide hazard on the Jurassic Escarpments of Great Britain David P. Boon a, ⁎, Jonathan E. Chambers b , Peter R.N. Hobbs b , Mathew Kirkham b , Andrew J. Merritt c , Claire Dashwood b , Catherine Pennington b , Philip R. Wilby b a British Geological Survey, Columbus House, Tongwynlais, Cardiff CF15 7NE, UK b British Geological Survey, Environmental Science Centre, Keyworth, Nottingham NG12 5GG, UK c Plymouth University, Drake Circus, Plymouth PL4 8AA, UK a b s t r a c ta r t i c l e i n f o Article history: Received 22 September 2014 Received in revised form 30 June 2015 Accepted 2 July 2015 Available online 17 July 2015 Keywords: Jurassic Mudstone Landslide LiDAR ERT The Jurassic Escarpment in the North York Moors in Northern Britain has a high density of deep-seated relict landslides but their regional hazard is poorly understood due to a lack of detailed case studies. Investigation of a typical relict landslide at Great Fryup Dale suggests that the crop of the Whitby Mudstone Formation is highly susceptible to landslide hazards. The mudstone lithologies along the Escarpment form large multiple rotational failures which break down at an accelerated rate during wetter climates and degrade into extensive frontal mudflows. Geomorphological mapping, high resolution LiDAR imagery, boreholes, and geophysical ERT surveys are de- ployed in a combined approach to delimit internal architecture of the landslide. Cross-sections developed from these data indicate that the main movement displaced a bedrock volume of c. 1 × 10⁷ m3 with a maximum depth of rupture of c. 50 m. The mode of failure is strongly controlled by lithology, bedding, joint pattern, and rate of lateral unloading. Dating of buried peats using the AMS method suggests that the 10 m thick frontal mudflow complex was last active in the Late Holocene, after c. 2270 ± 30 calendar years BP. Geomorphic mapping and dating work indicates that the landslide is dormant, but slope stability modelling suggests that the slope is less stable than previously assumed; implying that this and other similar landslides in Britain may become more susceptible to reactivation or extension during future wetter climatic phases. This study shows the value of a multi-technique approach for landslide hazard assessment and to enhance national landslide inventories. © 2015 Published by Elsevier B.V. 1. Introduction Landslide hazards pose a threat to people and infrastructure world- wide. They are a constraint on land use and can impact on the economy of an affected community (e.g. Jones and Lee, 1994; Schuster and Highland, 2001). However, our ability to assess hazard and risk in slide prone terrain, such as the North York Moors (NYM) region of the UK, and in Polar Regions currently undergoing de-glaciation, is hindered by a lack of knowledge about the magnitude and frequency of events and hillslope processes operating in these settings more generally. This paper provides a baseline reference study for landslide hazards in mudrocks that can be used to calibrate magnitude/frequency estima- tions for landslide hazard assessments in the region and in similar geological terrain elsewhere. Jurassic mudrocks underlie much of the UK including the North Yorkshire Moors area. These rocks are exposed in coastal slopes which are prone to instability (Jones and Lee, 1994; Fish et al., 2006; Cooper, 2007; Johnson and Fish, 2012) but landslide problems on inland escape- ment slopes in the NYM region are under-represented in the literature (Senior and Rose, 1994; Waltham and Forster, 1999; Marsay, 2010; Merritt et al., 2013). Previous geomorphological studies in the region (Fox-Strangways et al., 1885; Gregory, 1962a) did not describe the land- slide geology or geomorphology in any great detail. This paper aims to address this knowledge gap. The study focuses on the Mark Nab landslide in Great Fryup Dale, Upper Eskdale (Fig. 1), which is the largest in a cluster of bedrock land- slides distributed throughout several of the deep valleys in the north of the region. We combine newly acquired remote-sensing data (LiDAR), ground-based geomorphological mapping, electrical resistivity tomog- raphy (ERT), and geotechnical data into a ground model in order to con- ceptualise the 3D landslide architecture. We also use Accelerator Mass Spectrometry (AMS) dating methods to further develop the movement history. This ground model was then used to develop a deterministic slope stability model to test theories about trigger and preparatory fac- tors that led to the initial failure; including changes in stress and Geomorphology 248 (2015) 296–310 ⁎ Corresponding author. E-mail address: dboon@bgs.ac.uk (D.P. Boon). http://dx.doi.org/10.1016/j.geomorph.2015.07.005 0169-555X/© 2015 Published by Elsevier B.V. Contents lists available at ScienceDirect Geomorphology journal homepage: www.elsevier.com/locate/geomorph
  • 2. porewater pressure brought about by glacial erosion, glacial de- buttressing, changes in regional groundwater levels and glacial lake de- velopment. An assessment of the present stability state of the dormant slope is also presented to provide an indication of the current and future regional hazard posed by relict landslide systems. 2. Mark Nab study area 2.1. Topography The study area, located at British National Grid reference 471350, 502840 (54.42, −0.90 WGS84), covers a north facing slope on the Juras- sic escarpment at the head of Great Fryup Dale (Fig. 2). The foot of the slope lies at c. 150 m above Ordnance Datum (aOD) and rises up over hummocky ground by c. 200 m over a distance of c. 600 m. At the top of the slope, Middle Jurassic bedrock is exposed in the near-vertical cliff that forms the main Jurassic escarpment, above which is an upland moorland plateau which reaches a high point of 432 m aOD on Danby High Moor. The plateau sits at the northern edge of the North York Moors which are fragmented by a series of deep valleys generally orien- tated south-west north-east. The heads of these valleys are commonly incised by streams fed by runoff from peat covered moorland catch- ments. Numerous springs issue groundwater along the foot of the es- carpment. The streams, such as Great Fryup Beck in ‘Dale Head’ and Slidney Beck (Fig. 2) then flow north-eastwards into the River Esk which discharges into the North Sea at Whitby. At Great Fryup Dale the lower valley slopes are U-shaped and are typically inclined at c. 20°, but towards the head of the valley (Dale Head) the profile becomes increasingly V-shaped and irregular, due to Holocene fluvial incision and slippage. 2.2. Bedrock geology The Great Fryup valley is cut into a bedrock succession of Lower to Middle Jurassic sedimentary rocks comprising units of mudstone, silt- stone and sandstone, with subsidiary ironstone bands and limestone beds that together represent subsidence and eventual infilling of the Cleveland Basin (Kent et al., 1980; Holliday et al., 1992; Cox et al., 1999). The valley is positioned on the northern limb of the east–west trending Cleveland Anticline structure. The bedding in the valley is typ- ically near-horizontal but locally dips 1° to 2° to the north, dipping gent- ly out of the slope below Nark Nab. The succession comprises formations of the Lower Jurassic Lias Group, overlain by those of the Middle Jurassic Ravenscar Group. The typical lithologies of this succession are summarised in Table 1. The overview geological map in Fig. 3 shows that landslide deposits are extensive in Great Fryup Dale and are largely coincident with the Whitby Mudstone Formation (WHB) and Dogger and Blea Wyke Forma- tions. The Whitby Mudstone Formation is predominantly argillaceous Fig. 1. The Mark Nab landslide on the Jurassic escarpment, showing complex landslide morphology. Looking south-west. Photo taken by A. H. Cooper. Copyright BGS/NERC P769517. Fig. 2. Location map of the Mark Nab landslide study site at Great Fryup Dale, North York Moors. Contours and spot heights are in metres above Ordnance Datum. Contains Ordnance Survey data © Crown copyright and database right 2014. 297D.P. Boon et al. / Geomorphology 248 (2015) 296–310
  • 3. and locally c. 90 m thick, comprising grey to dark grey, finely laminated, fissile, pyritic mudstone and silty mudstone with sporadic thin sideritic and calcareous beds and concretions (Powell, 2010; Table 1). The forma- tion comprises five lithologically distinct Members (Cox et al., 1999) each displaying slightly different geotechnical properties. This subtle variation in physical properties strongly influences landslide mecha- nism, scale, style and preservation potential across the region and the details of individual member beds is worthy of description and some discussion here. Of particular importance to slope stability is the pres- ence of ‘slide-prone horizons’ within argillaceous units, as defined by Bromhead and Ibsen (2004), which give rise to bedding controlled fail- ures. The finely laminated (fissile) nature and pyrite content of some beds creates strength anisotropy. The basal unit of the Whitby Mudstone Formation, the Grey Shale Member, consists of c. 14 m of pale grey, local- ly pyritic, silty mudstone with calcareous siderite concretions (Powell, 2010). Subsequent ocean water stratification and the establishment of anoxic bottom conditions is recorded in the overlying Mulgrave Shale Member, which is c. 31 m thick and includes 9–10 m of fissile, finely laminated, bituminous, dark grey mudstone (previously ‘Jet Rock’) with horizons of calcareous concretions and a thin pyritic limestone at Table 1 Lithostratigraphic details and thickness of the bedrock sequence exposed in Great Fryup Dale (based on Kent et al., 1980; Howard, 1985; Powell et al., 1992; Young, 1994; Cox et al., 1999; Powell, 2010; Barron et al., 2012). Lithostratigraphy and local thickness Lithology Middle Jurassic Ravenscar Group Moor Grit Member of the Scalby Formation c. 15 m Grey medium- to coarse-grained, pebbly, trough cross-bedded sandstone, with thin siltstone and mudstone beds. Plant fragments and wood common. Scarborough Formation 30 m Variable lithology: fossiliferous argillaceous limestone, calcareous mudstone, siltstone, and medium-grained sandstone; calcareous concretions and ironstone. Cloughton Formation 50–70 m Laminated grey mudstone and siltstone with yellowish grey, fine- to medium-grained, cross-stratified sandstones and rare thin coals and seatearths. Eller Beck Formation 4.5–6 m Upward-coarsening succession of mudstone (with ironstone concretions), siltstone and fine- to medium-grained sandstone. Sandstone commonly ripple laminated, yellow weathering, bioturbated. Saltwick Formation c. 37 m Grey mudstone, yellow-grey siltstone and fine- to coarse-grained sandstone. Cross-stratified, non-bioturbated. Sandstone beds and channel fills. Thin coals, seatearth mudstone and nodular ironstone, plant fragments, rootlets common in some beds. Dogger Formation 7–8 m 2 to 3 m thick beds of deep-red poorly sorted coarse-grained sandstone, with chamositic (green) ooliths and scattered rounded granules and pebbles. Lower Jurassic Lias Group Blea Wyke Sandstone Formation c. 5 m Micaceous, fine-grained sandstones: grey-weathering and argillaceous in lower part, yellow-weathering and silty in the upper part. Whitby Mudstone Formation Locally c. 90 m Medium and dark grey fossiliferous mudstone and siltstone, laminated and bituminous in part, with thin siltstone or silty mudstone beds. Sporadic thin sideritic and calcareous beds, limestone and phosphatic nodules and concretions. Pyritic. Cleveland Ironstone Formation Up to c. 25 m Grey silt-laminated mudstone with up to six 0.1 to 0.3 m thick interbeds of hard, fossiliferous, ooidal ironstone (siderite and berthierine). Staithes Sandstone Formation Up to c. 30 m Silty sandstone with 2 to 4 m thick packages of laminated fine-grained sandstone in the middle and upper parts: typically bioturbated and/or showing wide variety of bedding structures. Redcar Mudstone Formation Up to c. 283 m Grey, fossiliferous, fissile mudstones and siltstones with subordinate thin beds of shelly limestone below, fine-grained carbonate-cemented sandstone above: argillaceous limestone concretions occur thoughout. Fig. 3. Geological map of Great Fryup Dale, adapted from Holliday et al. (1992), Sheet 43 Solid and Drift Edition, with unpublished BGS landslide deposit mapping data. Contains British Geological Survey materials © NERC 2014. 298 D.P. Boon et al. / Geomorphology 248 (2015) 296–310
  • 4. the top (previously ‘Top Jet Dogger’), passing up into c. 23 m of fissile, bi- tuminous mudstone with abundant ammonites (formerly ‘Bituminous Shales’). The Alum Shale Member above is c. 37 m thick, comprising a lower soft grey silty (micaceous) mudstone that includes c. 6 m of non- bituminous shale capped by a band of siderite nodules, overlain by c. 15 m of pyritic shale (the main ‘Alum Shales’), then 13–20 m of slightly stronger shale (formerly ‘Cement Shales’) that include beds of calcareous nodules (Kent et al., 1980; Powell, 2010). The Middle Jurassic Dogger For- mation rests unconformably on the Alum Shales in this part of the Cleve- land Basin and the overlying Peak Shale and Fox Cliff Members exposed along the Yorkshire coast near Whitby are absent (Powell, 2010). Kent et al. (1980) interpreted the overall structural grain of the re- gions distinct sub-parallel valleys to be the result of basin inversion, up- lift, erosion and unloading. This structural history produced a pervasive radial joint pattern which had led to the development of the distinctive radial drainage pattern. In the north of the Moors the predominant N–S structural grain and topography led to the formation of a series of near- parallel north–south orientated valleys, and Great Fryup Dale serves as a fine example of one of these consequent drainage features. Joints are pervasive and laterally and vertically persistent in the sandstone beds that cap the mudstones, and are generally orientated near-parallel to the valley slopes. The presence of these joints, together with occasional faults, reduces the tensile (rock mass) strength of the cap rock and Dogger Formation beds in a preferential orientation, and also increases the permeability, transmissivity and storage capacity of the units (creat- ing aquifers). These structural factors, along with the presence of weak- er mudstone horizons, strongly control landslide susceptibility and mechanisms of failure. 2.3. Quaternary history Great Fryup Dale was glaciated through the Devensian and became de-glaciated in late-Devensian times (Jones, 1977, 1999). During the Last Glacial Maximum (LGM) of Marine Isotope Stage 2 (around 18,000 yr BP), the high ground on the North York Moors remained largely ice free but experienced very severe periglacial conditions (Innes, 1999; Innes et al., 2009; Chiverrell and Thomas, 2010). At this time the valley was probably fully glaciated by a tongue of ice from a glacier in the Esk Valley (Kendall, 1902; Kent et al., 1980; Chiverrell and Thomas, 2010; Murton and Murton, 2011). De-glaciation com- menced c. 13,000 yr BP, in the Late Glacial Interstadial but was interrupted by a brief final cold stage between about 10,800 and 10,400 yr BP, during the Loch Lomond Stadial (Innes, 1999). Glaciation left patchy deposits of till in the valley floor (Fig. 3) and prolonged periglacial conditions left spreads of periglacial Head deposits across slopes. Holocene rivers cut down through till, deposited alluvium across the valley floor, and cut terraces into the bedrock. Landslide deposits formed in oversteepened valley heads and along valley sides, some- times blocking stream channels which temporarily diverted river flow. On the hill tops peat deposits cover much of the plateau, which along with some valley slopes to the south (e.g. Rosedale) are peppered with shallow coal and ironstone workings and small mine spoil heaps. 3. Slope geomorphology at Mark Nab The landslide at Mark Nab is c. 700 m long and c. 600 m wide; it covers approximately 0.36 km2 (Figs. 3 and 4). The crown of the land- slide is at an elevation of c. 340 m aOD, and the toe is at c. 190 m aOD. The flanks abut against adjacent landslide deposits to the east and west. 3.1. LiDAR interpretation Airborne LiDAR data were acquired by the Environment Agency Geomatics Group at a resolution of 0.25 m (flown March 2012). The de- rived shaded digital terrain model (Fig. 4) was interpreted and main land- slide features initially mapped out using a GIS and adopting the descriptive terms from Cruden and Varnes (1996). Based on this mapping and supplementary detailed field-based mapping, three distinct morpho- logical zones (I–III) were identified within the one landslide system: Zone I —rear scarp with rockfall Zone II —main body with rotated landslide blocks, block disruption, minor scarps and grabens Zone III —frontal mudflow complex with concealed block disruption or weathered bedrock The following section describes the geomorphology of the slope as interpreted from the LiDAR data (Fig. 4). The average slope angle on the landslide varies widely; a concave near vertical cliff dominates Zone I, whereas slopes of up to 42° are lo- cally present in Zone II. The lower slopes in Zone III are generally smooth and gently undulating with an overall convex form downslope. 3.1.1. Details of Zone I Zone I contains the rear scarp of the landslide, which is c. 370 m long, up to 40 m high. This feature forms a sharp crescent shaped cliff separat- ing the sheltered valley from the exposed moorland plateau. The upper portion of scarp is a near vertical 6 m high cliff exposing thickly bedded gritty sandstone blocks of the Cloughton Formation (Sycarham Mem- ber) and the finer more thinly bedded Eller Beck Formation below. The rock mass is locally regularly jointed and blocky, with three orthog- onal joint sets present; oriented ESE, SE and NE. These joints intersect the near-horizontal bedding which daylight in the cliff face. This kine- matic geometry favours ‘toppling’ and ‘sliding’ modes of failure, and fail- ures typically releasing fairly large (1 to 3 m3 ) blocks of sandstone, which have accumulated in a talus cone at the foot of the main scarp, partially filling the surface depression formed by the rear graben. The lower half of the escarpment cliff (main scarp) exposes mud- stones and sandstones of the Saltwick Formation. Continued erosion of the cliff has deposited a thin veneer of ‘gravelly clay’ on the slope which periodically fail in translational debris-rich mud slides also feed fluidised sediment, sometimes via chutes, into the depression below (graben). Sev- eral freshwater springs emerge from Sycarham Member along the base of the main sandstone cap, and also from several sandstone channels pres- ent within the predominantly silty Saltwick Formation. Channel erosion by these springs forms small gullies in the backscarp, and fossil gullies are preserved on the eastern most rear landslide block. The western side of the escarpment slope has undergone differential erosion leading to bevelling of the bedrock surface (Cloughton Forma- tion) which has produced a more rounded slope profile in the east. Above Zone I, at the western end of the main scarp, is a north-west- facing slope facet, with a distinctively smooth, regular, and convex profile which becomes progressively steeper downslope (19–26°). This slope is mantled with at least 2–3 m of soliflucted periglacial slope deposits (Head deposits) composed of stiff grey slightly gravelly, silty, sandy clays with rare rounded pebbles. Some of these pebbles may have been reworked from a pre-Devensian till. This slope is also scattered with large sub-rounded boulders of coarse-sandstone which are notably more deeply weathered than the fresher rockfall blocks sourced directly from the back scarp cliff. It is most likely that this slope facet is a periglacial ‘boulder field’ with boulders sourced from the thick sandstone bed that crops out at the crest of the slope (see Fig. 5). Another such ‘boulder field’ is present on a triangular shaped east-facing slope facet located c. 300 m to the west, on the opposite side of the valley. 3.1.2. Details of Zone II The upper part of Zone II contains a 30 m wide, 200 m long, flat wa- terlogged depression. This is interpreted as a rear graben that separates the rear scarp from the main body of the landslide. The graben contains 0.5 m of peat over at least 2 m of wet soft silt. A low man-made earth dam (built c. 2010) impounds excess surface and spring water in the graben formed depression to supply nearby farms. 299D.P. Boon et al. / Geomorphology 248 (2015) 296–310
  • 5. The middle part of Zone II contains a c. 200 m long area of highly ir- regular topography characterised by massive blocks, each c. 100 m wide and c. 60 m long, with secondary slope parallel scarps up to 20 m high. The highest blocks are capped by a lithologically distinct band of resis- tant ferruginous limestone of the Blea Wyke Member and are composed mostly of Whitby Mudstone Formation mudstone. The limestone mark- er beds dip at c. 20° to the south in the rearmost blocks, but the dip in- creases northward to up to c. 58° on the frontal blocks. The of the main landslide blocks are markedly linear and commonly strike NNE, as can be clearly seen from the LiDAR DTM (Fig. 4). This orientation matches the principal joint set orientation measured in the thick sandstone beds exposed in the main cliff above, suggesting an inherent structural control on landslide failure mode and resultant morphology. Small sea- sonal ponds occur in depressions between the main landslide blocks and are filled by several metres of laminated silt with occasional cobbles (proved by Russian Corer and hand auguring). The topography of the eastern side of Zone II is generally more subdued than the western side following more intense reworking and infilling of topographic de- pressions by mudflows generated by high amounts of water issuing from the springs and small springs that drain the rear pond. The eastern flank of the main landslide is represented at surface by a c. 150 m long, 15–20 m high scarp feature which forms a linear trough. It is currently occupied by a stream fed by the rear pond and is bounded to the east by a ridge composed of slipped fissile mudstone capped by a red sandstone. The western margin of Zone II represents the western flank; this area of rough ground is characterised by a complex association of morpho- logical features created by a series of superficial shallow multiple land- slides formed in the pre-slipped mudstone, similar in style to the lowest part of Zone II. Slope instability in this part of Zone II is primarily driven by toe erosion by Slidney Beck. The course of this stream has clearly been obstructed, and likely dammed at several points, by landslide de- posits on multiple occasions. This has resulted in diversion of the stream, which has subsequently carved new channels and fluvial ter- races, and in doing so has proceeded to undercut and destabilize the ad- jacent landslide deposits. Below the 270 m contour line the morphology in Zone II is typically more subdued with 5–10 m high minor scarps and transverse tension cracks that run parallel with the slope. The lowest slopes in Zone II con- sists solely of mudstone beds (with sandstone absent) which are rotat- ed by up 45° in boreholes 2 and 3. Contorted and tightly folded beds of mudstone are exposed in a sunken track and stream section at the toe (locations 3, 4 and 5 in Fig. 5). It is likely that this lower area (Loc. 3) contains the main slip surface breakout, and although the basal shear surface(s) is masked by superficial slumped mudstone in the gulley, its surface expression, which represents the toe of the landslide, can be mapped out by tracing the slight rise in ground level. 3.1.3. Zone III Zone III is typically an area of smoother topography than Zones I and II, with irregular slopes of c. 9–12°. This zone contains the foot and toe of the main landslide. This zone is c. 200–300 m long, c. 600 m wide and contains degraded mudflow lobes, peat hollows, numerous rabbit bur- rows, and several spring lines. The toe area has been artificially drained to improve the quality of the pasture land. The western side has degrad- ed ridge and furrow plough lines which are disturbed above the 245 m contour line where grass pasture gives way to bracken and the ground is crossed by degraded transverse cracks. Below Zone III, on the valley floor, the ground is very smooth and slopes gently to the north. This area is interpreted to preserve a glacially Fig. 4. Use of high-resolution LiDAR. A derived Digital Terrain Model of Great Fryup Dale (0.25 m x,y, resolution, 0.015 m vertical resolution, flown by Environment Agency 10 March 2012). Coordinate system is British National Grid. Three main morphological zones (I–III) are defined based on surface morphology. 300 D.P. Boon et al. / Geomorphology 248 (2015) 296–310
  • 6. Fig. 5. Geomorphologic plan of the Mark Nab landslide showing key localities, positions of boreholes (BHs 1, 2, 3, 4, 4A), dynamic penetration tests, ERT lines (ERT 1, 2, 3), geological cross-section lines A and B, and relation of surface morphological features to the landslide morphological Zones I–III defined in Fig. 4. 301D.P.Boonetal./Geomorphology248(2015)296–310
  • 7. eroded bedrock surface which has later been modified by transient streams emanating from the toe of the landslide, or diverted around the toes of other landslide masses that have previously dammed Slidney Beck. These stream diversion events have likely caused erosion of the toe, evidenced by a low cliff feature along the western end of the toe. 3.2. Geomorphological plan The morphological features interpreted from the LiDAR were com- bined with detailed geological field mapping to produce a 1:2500 scale ‘geomorphologic plan’ (Fig. 5; as per Anon, 1972; Griffiths, 2002; Fell et al., 2008). The plan depicts the key morphological features and geology, with structural data, field localities (numbered locality 1–13), borehole and dynamic penetrations test locations, geophysical survey lines, and lines of cross-section. The Cloughton and Saltwick Formations are exposed in the main back scarp and erosion of these materials con- tributes to rockfall, mudslides and accumulation of talus (13). On the main body (Zone II) several Whitby Mudstone-cored blocks are capped by more resistant sandstone and limestone beds of the Dogger and Blea Wyke formations. Their lithologically distinctive beds provide key strat- igraphic markers across the slipped ground, and their southerly dips and drop in elevation, provide evidence for back rotation of the land- slide mass. The extents of these marker beds were mapped out in detail, with structural measurements taken to help model the subsurface structure of the landslide blocks. Periglacial head deposits above and west of the main backscarp are truncated by the rear scarp exposing the non-marine siltstone and mudstones of the Saltwick Formation. This relationship has important implications for the landslide move- ment history, as discussed later. On the far western flank, Slidney Beck has been diverted around the toe of a secondary landslide deposit. The scarp of this toe failure truncates the main scarp feature and this provides evidence for erosion-driven reactivation after the main failure, although the relative age of this subsequent failure has not yet been investigated. The stream is currently eroding the river bank at the foot of Zone II, and thereby continues to destabilise the western side of the landslide system. In the upper part of Zone III the sharpness of minor scarps, which define the boundaries of the secondary rotations through ‘block disruption’ (9 and 10), and tension cracks (11) have become much degraded. The disrupted and disturbed Whitby Mudstone Formation mudstone slakes fairly readily and has degraded to mud which feeds mudflows that supply material to the lower mudflow complex (6), producing a smooth slope profile (7 and 8) across the sub-cropping Cleveland Ironstone Formation. Contorted and tightly folded beds of mudstone are well exposed in a sunken track (4 and 5) in the eastern toe area. These structures are interpreted as a product of compression related to landsliding, and not the result of tectonic faulting, though these features could also potentially relate to earlier cambering and valley bulging processes which could have preconditioned the slope for failure. 4. Subsurface investigations 4.1. Drilling and testing Five boreholes (1, 2, 3, 4, 4A) were drilled in the foot of the landslide to assess the stratigraphy and to provide ground-truth for the geophys- ics. The boreholes (BHs) were logged to BS5930:1999, the British Stan- dards for Site Investigation (British Standards Institution, 1999; BS EN ISO 14688-1 and weathering described according to Anon, 1995). Full logs are presented in Appendix A and BH locations are shown in Fig. 5. The core was sampled in a fresh state for classification tests, including moisture content, bulk density, resistivity and shear strength (uncon- solidated undrained for ‘peak’ values, and consolidated drained for ‘re- sidual’ values). BH4A was a re-drill of BH4 drilled to collect additional samples. Dynamic Penetrometer (DP) tests were also undertaken to provide correlation of strong and weak zones between boreholes. The DPs were progressed to refusal (N ≥ 60), terminating within strong unslipped mudstone, ironstone, or siderite bands. A standpipe piezom- eter in BH2 to monitor shallow groundwater levels in Zone III was mon- itored between March and November 2012 using a Solinst Levelogger Gold and Barrologger at 15 min recording intervals. Within the monitor- ing period the water level fluctuated between 2.8 and 3.5 m below ground surface and was sensitive to antecedent rainfall conditions. It is unlikely that this water level represents the water table across the entire landslide, as groundwater conditions are likely to be complex, and possi- bly compartmentalised in Zone II due to the influence of minor aquifers existing within individual landslide blocks. The boreholes in Zone III (BHs 1, 3, 4, and 4A) proved weak mud- stone bedrock (Whitby Mudstone Formation) overlain by c. 10 m of soft to firm mottled or laminated clay sediments (mudflow deposits). Borehole 2, located further up slope within Zone II, proved 6 m of rotat- ed, highly fractured, weak to strong mudstone beds which are interpreted as slipped Whitby Mudstone Formation. Boreholes 4 and 4A, in the toe area, proved several metres of deeply weathered mud- stone overlain by stiff gravelly clay (head or till) deposits, and capped by soft clay containing an organic-rich peaty soil horizon between 2.64 and 2.90 m b.g.l. These organic rich horizons, which were dated (see later), are interpreted as a palaeosol that formed in a small depres- sion and subsequently was buried and preserved by a mudflow event. 4.2. Geophysical survey The electrical resistivity tomography (ERT) technique (Jongmans and Garambois, 2007) was used to compare subsurface characteristics with surface features and ground-truth from borehole data. Geophysical surveys were acquired along three lines: ERT Lines 1, 2 and 3, and these were orientated perpendicular to major structural trends and geological boundaries, including the main landslide blocks. Line ERT 1 was acquired using two arrays (ERT 1A and ERT 1B) in order to sample the entire length of the landslide deposit, and including the lower non-slipped ground beyond the toe. The survey design pro- vided for a depth of investigation up to c. 50 m in order to image the shallow and deep structure of the landslide beyond the estimated depth of the deepest slip surface, based on initial cross-sections and the geomorphological evidence. Approaches to ERT field surveying are described widely in the litera- ture (e.g. Lapenna et al., 2005; Chambers et al., 2011), so only a brief ex- planation is provided here. The ERT field survey was undertaken during May 2011. ERT data were collected using an AGI SuperSting R8 IP system attached to stainless steel electrodes via multicore cables. Ground condi- tions were generally extremely dry. To reduce contact resistances and improve data quality, each electrode was watered using a saline solution. Electrode positions were identified using survey tapes extended across the ground surface; a real-time-kinematic (RTK) GPS measurement, with centimetric accuracy, was then made for each electrode position, to establish the grid position and elevation of each electrode. The locations of the four ERT Lines 1A, 1B, 2 and 3 are shown in Fig. 5 as ERT 1, ERT 2, and ERT 3 with lengths of 292.4, 307.6, 289.5 and 184.9 m respectively. (Note that ERT 1A and ERT 1B are end on and are depicted as ERT 1 in Fig. 5). A dipole–dipole configuration was employed for each of the lines. The longer lines, Lines 1A, 1B and 2, were surveyed using (along-ground) dipole lengths (a) of 5, 10, 15, 20, and 25 m and dipole separations (na) of 1a to 8a. For Line 3, which was a shorter and higher resolution imaging line, a values of 3, 6, 9, 12, 15, and 18 m, and na values of 1a to 8a were used. A summary of the contact resistances and reciprocal error character- istics of the ERT Lines 1A, 1B, 2, and 3 are shown in Table 2. Even with watering, the measured contact resistances were relatively high, with mean resistances of approximately 3000 Ω, reflecting the very dry con- ditions at the time. The reciprocal errors do however indicate that rea- sonable data quality was achieved for most measurements (i.e. N80% of the measured reciprocal pairs had a reciprocal error of b1%). Data points with a reciprocal error of N1% were removed from the data 302 D.P. Boon et al. / Geomorphology 248 (2015) 296–310
  • 8. sets, and the reciprocal errors were used to weight the data during the inversion. The misfit errors for ERT Lines 1A, 1B, 2 and 3 were 2.4%, 1.1%, 3.4% and 2% respectively indicating good convergence between the model and measured data. It should be noted that ERT models are smoothed images for which resolution decreases with increasing depth of investigation because the model in these regions is less well constrained by the data. The interpretation of 2D ERT imaging data is further complicated by off- line 3D resistivity and topographic variations that violate the 2.5D assumption. Therefore, the ERT images can provide only an approxi- mate guide to the true resistivity and geometry of subsurface features (Olayinka and Yaramanci, 2000; Chambers et al., 2002); and hence, calibration and interpretation using other sources of ground-truth information are highly desirable. This was possible in Zones I and III, where exposure mapping or borehole data were available, but not in Zone II. 4.3. Results and interpretation of geophysical imaging (ERT) The ERT survey Lines 1A, 1B, 2 and 3 (Fig. 6) provide additional infor- mation on deep subsurface structure and composition of the landslide mass. The geophysical models for the corresponding ERT Lines 1A, 1B, 2 and 3 are presented in Fig. 6 with borehole and penetrometer test data overlaid to provide information on material characteristics and depths, where available. The low resistivity areas generally correspond with clay-rich materials, such as mudstone lithologies and wet clay soils, and these contrast against more electrically resistive areas which indicate the presence of non-clay or dry materials such as siltstone, sandstone, limestone or free draining dry coarse or very coarse soils. Geological boundaries, depicted in black, are projected into the subsur- face and geological units labelled. Oblique formation labels indicate ro- tated bedding and horizontal labels indicate horizontal bedding. The relationship and distribution of high and low resistivity zones at depth within the main body of the landslide (ERT Lines 1A, 2 and 3) provide evidence of the deep structure where there is no intrusive ground inves- tigation data. Truncation of rectangular high resistivity zones against low resistivity zones in Zone II is interpreted as evidence for rotation and juxtaposition of more resistive beds (e.g. partially or un-saturated sandstone and limestone beds) against low resistivity mudstones. The Table 2 Contact resistance and reciprocal error summary information for ERT Lines 1A, 1B, 2 and 3. Number of measurementsa Contact resistance (Ω) Fraction (%) of data set below reciprocal error level Mean SDb 1% 5% ERT Line 1A 1780 3159.0 4145.9 80.6 95.0 ERT Line 1B 1788 2757.0 1735.6 80.0 93.6 ERT Line 2 1780 3065.0 2656.2 83.3 96.0 ERT Line 3 1980 3175.0 1872.2 87.6 99.1 a Each comprising a reciprocal pair (i.e. a forward and reciprocal measurement). b standard deviation (SD). Fig. 6. ERT sections from the Mark Nab landslide with borehole data and preferred interpretation of profile of main slide surface. 303D.P. Boon et al. / Geomorphology 248 (2015) 296–310
  • 9. dashed white lines depict ‘inferred’ positions of the main shear surfaces with arrows indicating general direction of slip. In Zone II the geophys- ical data suggest a c. 30 m deep ‘upper’ slip surface, with an entirely sep- arate ‘lower’ slip surface. In Zone III the lateral thickness variation in mudflow deposits within the toe can be inferred, with borehole and DP control, from the geophysical model (ERT Line 1, Fig. 6); the lower boundary of the mudflow deposits is marked by a sharp transition be- tween lower resistivity zones representing mudstone and higher resistivity zones representing sandy clay and silt rich materials. 5. Slope architecture An interpretation of the 2D architecture of the slope has been devel- oped by combining the LiDAR digital terrain model (Fig. 4), the geology map and geomorphological interpretation (Fig. 5) and the findings of the drilling and geophysics (Fig. 6), following the ‘total geological model’ approach described by Fookes (1997). The model of the internal architecture and its relation to the bedrock succession is summarised in two cross-sections, Sections A and B, in Fig. 7. The location of Section lines A and B are shown in Fig. 5. Section A (A–A′, Fig. 7) shows an idealised geological cross-section through the centre line of the landslide and subsurface relationships be- tween surface morphological features, such as back-tilted sandstone- capped mudstone blocks and key geological marker beds such as the Dogger Member. At the rear of the escarpment (Zone I) the thick hori- zontally bedded cap of well-jointed sedimentary rocks, composed of Dogger Member, Saltwick Formation, Eller Beck Member and predomi- nantly Cloughton Formation, provides a static load on the thick Whitby Mudstone Formation beds. These non-argillaceous units effectively be- have as a layered aquifer which along with surface infiltration supply water into the slope. Dilation of existing bedrock joints due to vertical and lateral stress-relief (unloading) and possibly ice jacking has contrib- uted to enhanced bulk porosity and secondary permeability of the cap rock and is an important factor in the hydrogeology. The presence of three large internal blocks within Zone II (deep- seated rotational) suggests that at least two internal slide surfaces are present, and these likely connect with the main slide surface at depth (Fig. 7A). There are several possible interpretations of the slip surface geometry, and the author's two preferred interpretations are labelled in Fig. 7 as Interpretations 1 and 2. The first interpretation involves an ‘upper’ slip surface, with a c. 30 m deep sub-horizontal planar surface Fig. 7. Geological cross-sections. A) Idealised cross-section through the centre of the Mark Nab landslide showing two possible slip surface geometry interpretations: Interpretation 1 en- tertains two entirely separated slide surfaces, the ‘upper’ surface is bedding-controlled and horizontal, the ‘lower’ is a sub-horizontal non-bedding-controlled surface; while Interpretation 2 considers a multiple rotation with three main blocks and a common basal bedding-controlled slide surface. Zones I–II relate to geomorphological zones described in Fig. 4. B) Idealised cross-section through the western flank with single compound slide with superficial rotations. Note that the locations of the cross-section lines do not match those of the geophysical survey lines (see Fig. 5). 304 D.P. Boon et al. / Geomorphology 248 (2015) 296–310
  • 10. which follows a ‘slide prone horizon’, as defined by Bromhead and Ibsen (2004), within the Whitby Mudstone (exploiting weaknesses in the upper beds of the Mulgrave Shale Member), and a completely separate ‘lower’ slip surface evidenced by the geophysics, which is c. 20 m deep and gently inclined at c. 10–12°. The form of the ‘lower’ slip surface is sub-horizontal, planar or stepped, and cuts through the bedding of the Whitby Mudstone (Mulgrave Shale Member). Both slip surfaces are most likely non-circular. However, an alternative interpretation (Interpretation 2) is also worth considering. This involves a single deeper-seated non- circular slip surface that cuts through to the base of the Whitby Mud- stone Formation. The maximum depth of rupture for this interpreta- tion is c. 50 m, somewhat deeper than Interpretation 1, with the slide plane exploiting the full depth of the mudstones of the Mulgrave Shale Member, probably along a landslide prone horizon at or near the base of the formation in a bedding plane failure. The simplest geometrical solution supported by geophysical and borehole evi- dence is Interpretation 1. However, there is some uncertainty about the reliability of the geophysical data at depths beyond 30 m, and so the interpretation of the structural interpretation in Zone II is still largely based on expert judgement. Section B of Fig. 7, which corresponds to B–B′ in Fig. 5, is a represen- tation of the western side of the Mark Nab landslide complex. The cross- section depicts the form of the main slide surface and surficial shallow multiple rotations that are deconstructing the foot mass. Erosion of the toe of the landslide mass by Slidney Beck continues to destabilise this part of the Mark Nab landslide system. This is a more widely ob- served process that is actively destabalising the head of the main Great Fryup Valley to the south east, and the heads of several other large valleys. Key geomorphological features that are pronounced are the break of slope associated with the strong and relatively resistant Dogger and Blea Wyke sandstone beds, sharp scarps, and smooth con- vex slopes found above the 320 m contour line. The upper part of this slope is mantled by soliflucted head deposits that contain weathered rounded sandstone boulders ‘ploughing boulders’ (Fig. 7B). Rill and gully erosion on weathered Whitby Mudstone slopes at the rear scarp (e.g. Loc. 12 in Fig. 5) has deposited colluvium onto the head of this slide mass, and although vegetation of the scarp slope has somewhat arrested this erosion process, this area is prone to future instability due to river erosion. Advancement of the conceptual ground model re- quires drilling rotary boreholes to +60 m in the main body (Zone II) and to 150 m above the crown. Deeper holes would better constrain the lithostratigraphic unit thicknesses, and provide samples for further geological studies and materials testing. 6. Landslide movement history 6.1. Geomorphological evidence There are no historic records of large-scale movements of the land- slide; however, the relative sequence of movements can be inferred from interpretation of the geomorphic and geological evidence. The trun- cation of periglacial head deposits by the main (rear) back scarp (Figs. 5 and 7B), and the presence of head beneath the mudflow deposits (BH4, Appendix A), constrain the main movement event to the early–late Holo- cene times. Preservation of ridge and furrow plough lines in Zone III (Fig. 6) suggests that this area has not been active in historic times. How- ever, rotation and dislocation of Whitby Mudstone from the main land- slide mass on the western flank (Fig. 7B), are evidence for a secondary phase of deep-seated movement after the main event and this possibly postdates some of the frontal mudflow activity in Zone III. The minor scarps and benches shown in Zone II (Fig. 7B) provide evidence for ‘re- cent’ to ‘old’ rotational slides, driven by toe erosion by Slidney Beck and this process is still intermittently ‘active’. Very recent activity is limited to small-scale translational debris and mudslides in colluvium and slipped weathered or disturbed mudstone on stream banks and on the main backscarp, and minor rockfall from the sandstone beds exposed along main escarpment cliff (Fig. 5, Locs 4, 12 and 13). 6.2. Sediment dating The frontal mudflow complex (Fig. 4, in Zone III) contains buried palaeosols which were cored and dated to help constrain the age of the latest mudflow events. Inspection of cores during logging of BH4A identi- fied a peat deposit below a mudflow event horizon between 2.74 and 2.90 m b.g.l. (Appendix A). This soil horizon is composed of olive grey or- ganic silt with pockets of amorphous peat containing fragments of wood and charred material; the upper boundary is sharp indicating erosion by an overriding mudflow event(s). Another horizon containing dark brown peat with scattered rootlets and wood was also proved at a similar depth in BH4, located approx 1 m to the west of BH4A (Fig. 5 and Appendix A). These soils likely preserve deposition and vegetation of shallow surface depressions on the upper surface of a mudflow. Radiocarbon dating methods were used to determine the age of this sediment. Fragments of wood were extracted during examination using clean gloves and tools to minimise contamination. Precautions were also taken during percussive drilling to minimise hydrocarbon contam- ination (duck oil). The sediment samples were stored horizontally in a humidity and temperature controlled fridge at 4 °C for c. 6 months at BGS Keyworth prior to logging and sampling. Three of the fragments of wood, extracted from various depths between 2.84 and 2.89 m in BH4A, were analysed for age determination using Accelerator Mass Spectrometry (AMS) techniques by Beta Analytic (Beta Nos 343215, 343216, 343217). Samples were analysed to ISO 17025 standards, and were first pre-treated using the acid/alkali/acid method. The results of the AMS analysis are shown in Table 3. These dates constrain the latest mudflow event in BH4A to after 2270 yr BP. The earliest date of the buried palaeosol coincides with a pe- riod of climatic deterioration to a wetter climate, but also major woodland clearance by early Iron Age people, as indicated for example by pollen re- cords from the nearby Fen Bogs site (Simmons et al., 1993; Innes, 1999). This late-Holocene erosion event corroborates other records from wet- lands formed behind landslides in the North York Moors at Gormire Lake, St Helena and Blakey, where a link between soil erosion and defor- estation has been suggested by Innes (1999). Table 3 Radiocarbon-dated samples from the Mark Nab landslide mudflow cores. Core Depth (m) OS Grid reference (x,y,) Sample type and pre-treatment Lab. ID number Measured age (BP) 13C/12C o/oo Conventional 14 C age (BP) 2 Sigma calibration BH4A 2.850–2.900 471566, 503341 Charred material: acid/alkali/acid Beta-343217 2240 ± 30 −23.0 2270 ± 30 Cal BC 400 to 350 (Cal BP 2350 to 2300)/Cal BC 290 to 230 (Cal BP 2240 to 2180)/Cal BC 220 to 210 (Cal BP 2170 to 2160) BH4A 2.840 471566, 503341 Charred material: acid/alkali/acid Beta-343216 2340 ± 30 −23.2 2370 ± 30 Cal BC 510 to 390 (Cal BP 2460 to 2340) BH4A 2.870 471566, 503341 Charred material: acid/alkali/acid Beta-343215 2340 ± 30 −26.2 2320 ± 30 Cal BC 400 to 380 (Cal BP 2360 to 2330) 305D.P. Boon et al. / Geomorphology 248 (2015) 296–310
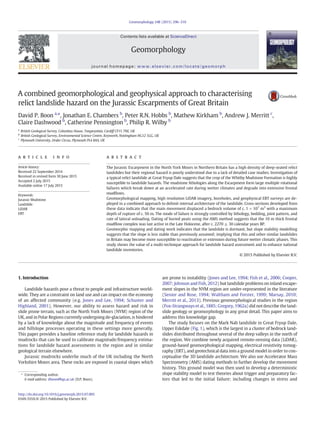
  • 11. 7. Landslide trigger factors and mechanisms of failure 7.1. Slope stability models A set of slope stability models were developed to quantitatively test the conceptual ground model and explore the initial landslide trigger factors and assess the current day stability state. The geotechnical prop- erty values used in the stability models are provided in Table 4. The values were estimated values, based mainly on the BGS's geotechnical database for the Lias Group (Hobbs et al., 2005) and the general litera- ture (Reeves et al., 2006). A small number of geotechnical tests (ring shear and shear box) were carried out on samples of Whitby Mudstone Formation collected from the landslide deposit itself (shear zone ex- posed at head of gully near Loc 4, Fig. 5.) and other samples collected from another landslide shear zone exposed at river level at nearby East Arnecliff Wood. These data were not used directly but were used to inform an expert judgement based estimate of the residual shear strength of the Whitby Mudstone at the Nark Nab landslide site. The density and porosity data were taken mainly from the BGS's geotechni- cal database. Two main slope scenarios were modelled: i) a pre-failure slope, and ii) the present day ‘post-failure’ slope. 7.2. Pre-failure slope scenarios The slope stability model was used to perform a ‘back-analysis’ to in- vestigate the sensitivity of the paraglacial Jurassic Escarpment to various environmental trigger factors, including: (1) Glacial buttressing and loss of that lateral support (de-buttressing), (2) presence and removal of a pro-glacial lake, and (3) groundwater rise after deglaciation. The model variables chosen to represent these primary factors were: slope angle, surface water level, and groundwater level, respectively. The pre-failure slope analyses used two approaches: ‘finite element’ using FLAC slope (version 7) and ‘limit-equilibrium’ using Galena (ver- sion 6). The results from finite element modelling were, where appro- priate, used to inform the geometry of the slip surface defined in the limit-equilibrium model. Further details of the analysis methods and Table 4 Geotechnical property values used for slope stability models (after Hobbs et al., 2005; Reeves et al., 2006; Hobbs and Boon, 2013). c′: effective cohesion; ϕ: effective angle of internal friction. Geological layer (lithology) Layer thickness (m) Saturated density (kg m−3 ) Dry density (kg m−3 ) Porosity, n (%) Pre-slip ‘peak’ Post-slip ‘residual’ c′ MPa ϕ′ degr. c′ MPa ϕ′ r (degr.) Cloughton Formation (Sst) including Eller Beck Formation 20 2450 2300 0.15 0.30 35 0.0 35 Saltwick Formation (Sst/Slst/Mst) 25 2350 2200 0.15 0.20 25 0.0 25 Dogger & Blea Wyke Formations (Sst/Slst) 10 2300 2100 0.20 0.11 20 0.0 20 Whitby Mudstone Formation (Mst) 201 2060 1710 0.35 0.015 26 0.0 10 Cleveland Ironstone Formation (Slst/Mst/Irnst) infinite 2060 1710 0.35 0.5 30 0.5 30 Fig. 8. Results of FLAC slope stability modeling. A) Geological layers. Properties ar given in Table 4. Note: Ice mass is substituted for Whitby Mudstone Formation properties due to software limitations. B) Results for a glacially buttressed slope scenario. C: Results for a glacially de-buttressed slope scenario. 306 D.P. Boon et al. / Geomorphology 248 (2015) 296–310
  • 12. results are provided in Hobbs and Boon (2013). The surface profile was based on a structural reconstruction of the cross-section in Fig. 7A, which assumes a 43° planar slope. 7.3. Glacial buttressing To investigate the potential effect of glacial buttressing on the sequence of slope deformation we considered two simple models: i) Ice buttressed: over-steepened slope, 80 m high, with ice buttressing up to the 270 m contour line. ii) Non-buttressed: over steepened slope, 125 m high, with no ice buttressing. Both scenarios were modelled in FLAC using the same geological unit thicknesses (Fig. 8A) and ‘peak’ strength properties (Table 4). The water table in model (i) was assumed to be deep, assuming no free groundwa- ter and deep permafrost conditions, whereas the water table in model (ii) assumes a shallow water table and re-establishment of the regional water table and potential for excess pore pressure build up in the slope. The FLAC modelling results are shown in Fig. 8B,C. Fig. 8B shows that the over steepened ‘buttressed’ slope is inherently unstable (FoS of 0.95) and prone to failure, but with shallow movement occurring as minor shallow rotation affecting only the Whitby Mudstone and Dogger units. This result supports the idea of an initial ‘upper’ slope failure (as implied by ‘Interpretation 1’; Fig. 7A). The results of model (ii) in Fig. 8C, shows that the slope is also unstable when glacial de- buttressing has occurred, but the failure mode is significantly different from that of the buttressed slope stability model (i), with a deep- seated rotation affecting the full slope in Fig. 8C. One key limitation of this slope modelling method is that the model (i) substitutes the ice mass for a Whitby Mudstone mass due to software limitations. There- fore, model (i) is unlikely to produce a deeper basal failure mode (sim- ilar to Interpretation 2 in Fig. 7). However, a deep-seated bedding- controlled failure with a basal slip surface geometry which daylights within the ice mass, similar to Interpretation 2, is also a feasible failure mechanism. 7.4. Model sensitivity One assumption in the models is that the para-glacial slope was c. 43°. This slope angle is based on cross-section reconstruction and so there is a lot of uncertainty in the pre-failure slope angle. To investigate the sensitivity of the stability models to this uncertainty, and to better understand the general relationship between slope angle and stability condition across the region, we modelled a range of generic Whitby Mudstone Formation slopes using FLAC. We use ‘peak’ strength proper- ties (Table 4) and assume the formation is 90 m thick. The results are plotted in Fig. 9A, which shows that the Jurassic Escarpment becomes increasingly unstable as slope angle increases. This result is not surpris- ing; however, the relationship suggests that if a 90 m thick Whitby Mudstone Formation slope exceeds a critical angle of c. 22°, the failure mode is more likely to favour deep-seated rotational sliding over a translation sliding mode. The slide plane exploit any ‘landslide prone horizons’ within the Whitby Mudstone Formation and the primary shear surface daylights at the base of the escarpment (in a toe failure) above the Cleveland Ironstone Formation. To validate the relationship with empirical data, slope angles of failed and non-failed slopes in Great Fryup Dale were measured remotely using the GeoVisionary and slope profile measurment tool using a slope model derived from the 0.25 m resolution LiDAR data (Fig. 4). Using this approach we find that deep-seated landslides tend only to be found on the Jurassic escarpment when the average slope angle exceeds c. 21°. This empirical method not only provides a useful ‘sense check’ on the assumptions made in the sta- bility modelling, but also provides an improved understanding and a critical slope angle cut off which could be applied for regional scale land- slide susceptibility mapping purposes. FoS for a conceptual pre-slipped Whitby Mudstone slope (i) is 0.8, suggesting that without additional lateral support (i.e. glacial buttressing) this slope would not have stood up on its own at c. 43°. Following this logic it is highly plausible that an initial ‘upper’ slope failure initiated in the upper part of the escarpment (a ‘slope failure’) while the glacier was still providing some lateral support (i.e. paraglacial failure). The slope may have even started to relax due to lateral unloading during valley glaciation phases, with Fig. 9. Plots showing the results of slope stability model sensitivity analysis of key physical factors for Whitby Mudstone Formation slopes: A) relationship between slope angle and FoS; B) glacial-lake level and FoS; and C) FoS and regional groundwater level. (A) and (B) assume a deep-seated non-circular rotational failure mode on a 43° hillslope in 90 m thick Whitby Mudstone Formation mudstone. 307D.P. Boon et al. / Geomorphology 248 (2015) 296–310
  • 13. dilation of pre-existing discontinuities (e.g. joints, faults, fractures) which would have pre-prepared the slope with increased the sec- ondary hydraulic permeability. The combined effects of these geo- logical processes would have preconditioned the slope for a further ‘lower’ failure as the ice mass reduced in volume. We have represent- ed this rock mass dilation effect in our stability models by addition of a tension crack 10 m behind the crown. However, the presence of frozen ground under permafrost conditions could also have in- creased the shear strength of the near surface slope materials, delaying development of a shallower failure mechanism in favour of a deeper-seated slope failure which propagates beneath the fro- zen crust. This failure mechanism could account for the existence of large intact blocks preserved in Zone II. Although the pre-slip stability model (Fig. 8A) results presented thus far lend support to a deep-seated rotational mode of failure during a partial glacial de-buttressing phase, other potential trigger factors, such as the reported pro-glacial lake in Eskdale and a even- tual post-glacial rise in regional groundwater levels, may also have contributed to the hillslope instability along the non- glaciated parts of the escarpment and in other regions south of the Devensian limit, such as the Cotswolds. These two additional triggering factors were investigated using modified slope stability models and the methods and results are briefly described in the following subsection. 7.5. Glacial lake drawdown scenario Kendall (1902) proposed the Esk valley was once flooded by a pro- glacial lake, Lake Eskdale, which reached a maximum height of 225 m aOD (Kendall, 1902; Radge, 1939; Gregory, 1962a,b; Kent et al., 1980; Murton and Murton, 2011). If this lake really did exist, the lake water would have partially filled Great Fryup Dale and the adjacent valleys. The effect of a changing water body level on the stability of the pre- slip Jurassic Escarpment was modelled by varying the level of the water table in the stability model. The results, plotted as the relationship between lake level and stabil- ity state (FoS) in Fig. 9B, indicate that a rising lake level would have pro- moted stability, but that a rapid lowering of the lake level, while the slope is still in a saturated state, would have promoted instability. 7.6. Groundwater rebound scenario A similar reduction in stability is also achieved by raising the region- al groundwater level, so draining of a pro-glacial lake would probably not have been required to trigger the initial main failure as the slope was already likely metastable anyway. The climatic amelioration at the start of the Holocene would have seen re-establishment of the sur- face drainage network and a rise in regional groundwater levels. This is evidenced by formation of sapping erosion related landforms such as the Hole of Horcum which is reputed to have formed shortly after the LGM (Cooper, 2007). To test the sensitivity of an oversteepened deglaci- ated slope to rising groundwater levels we back-analysed a Whitby Mudstone slope using the reconstructed pre-slip hillslope geometry of 43° and peak strength values (Table 4). The groundwater level was raised in increments of 10 m to simulate rising groundwater conditions, under long-term ‘drained’ effective stress pore water pressure condi- tions. The model results summarised in Fig. 9C indicate that a rise in groundwater level significantly reduces the stability of the Jurassic es- carpment slope. The model is also very sensitive to slope angle (Fig. 9A). The stability model results from Hobbs and Boon (2013) show that a deep-seated rotational failure mode is favoured when groundwater level rises above around 303 m aOD. When groundwater level reaches this elevation the jointed sandstone beds of the Dogger Formation would have become saturated and started to behave a minor aquifer providing water into the landslide-prone Whitby Mud- stone Formation unit below, hence promoting instability. 7.7. Likely trigger mechanisms of UK Jurassic escarpment landslides The most feasible primary trigger mechanism for the initial Mark Nab landslide is loss of lateral support due to over steepening of the slope by glacial erosion and de-butressing, although groundwater rise likely also played a role. Subsequent increases in effective rainfall and stream down-cutting and erosion likely drove secondary movements, further block disruption, and initiated subsequent first time failures at the heads of incised valleys. Seismic and rainfall triggering were also considered but not modelled. More widely, the combined roles of (i) glacial de-buttressing, as described by McColl and Davies (2013); and (ii) bedding-controlled failure, similar to that described in SE England by Bromhead and Ibsen (2004), and (iii) regional groundwater rise, likely triggered and drove landslide activity along glaciated and non-glaciated Jurassic slopes in Britain. In the deep supposedly non- glaciated (during the Devensian) incised moorland valleys to the south, such as Rosedale, it is possible that first-time failures occurred much earlyer due to over-steepening that occurred during an earlier valley glaciation. However, it is also possible that those failures occurred due to rising groundwater level conditions, although more investigation is needed. Reconstruction of the slope profile at Mark Nab also provides a new estimate of recession rate for the Jurassic Escarpment in glaciated val- leys in Northern Britain through the Holocene; we estimate between 0.01 and 0.005 m yr−1 of recession to have occurred there since the LGM, mainly controlled by mass movement processes. This rate as- sumes the main phase of landslide-driven erosion initiated c. 13,000 yr BP, at the end of the Late Devensian, although more precise dating of the main failure would help constrain these estimates. 7.8. Current stability state The residual stability of the majority of relict landslides in the UK is largely unknown and likely highly variable, and although they are gen- erally considered dormant or inactive (Jones and Lee, 1994), they have been known to reactivate and cause damage when external environ- mental conditions change (e.g. Fish et al., 2006). Effective assessment and management of relict slopes requires appropriate site investigation and a good conceptual ground model. We used the Galena software package to model the stability state of the ‘present day’ slope using the current topographic profile determined from the 5-m NextMap, and ‘residual’ shear strength values for the landslide-prone Whitby Mudstone Formation (Table 4). We also con- sidered sensitivity of the model to different slip plane geometry and modelled the stability condition using both the shallow and deep slip plane geometries proposed in ‘Interpretation 1’ and ‘Interpretation 2’ of Fig. 7A, respectively. The Sarma non-vertical (multi) slice, non-circular analyses were used for all Galena models. The ‘residual’ strength value (ϕ′r) for the Whitby Mudstone Formation was increased from the laboratory mea- sured value of 9° to 10° to account for the fact that the clay is unlikely to be at fully remoulded strength at the field scale due to secondary con- solidation, inclusion of lithorelicts, discontinuity roughness effects, and possible added cohesion provided by secondary crystallisation along an- cient inactive shear surfaces. The results of the Interpretation 1 based model (involving an ‘upper’ and ‘lower’ slip surface geometry based on Fig. 7A), indicate that the ‘upper’ landslide mass is currently stable (FoS = 2.71), and the separate ‘lower’ slide mass of Interpretation 1 is also stable (FoS = 1.42). If we as- sume that both slip surfaces are connected and the landslide mass be- haves as one coherent mass, the slope is also seemingly globally stable (FoS = 1.85). There was no field-based evidence to suggest that the main landslide mass is globally unstable and the stability modelling strengthens the notion of the slope being ‘dormant’ rather than ‘Inactive – Ancient’. However, the stability of the ‘upper’ mass would decrease if the ‘lower’ mass were to move, as the latter provides some clear 308 D.P. Boon et al. / Geomorphology 248 (2015) 296–310
  • 14. buttressing, these interdependencies highlight the dynamic nature of these landslide systems. It seems likely that complex and delicate phys- ical and hydrogeological feedbacks are still in operation within these relict slopes. 7.9. Model uncertainty and sensitivity 7.9.1. Current day slope There is uncertainty in the ‘current day’ stability model, which relies heavily on assumptions about the geometry of the slide plane(s). The slide plane geometry is more certain where there is drilling and geo- physics data (Zone I). There is some uncertainty in the ‘post-slip-resid- ual’ model input values (Table 4) which were limited to lab-scale test results so these may not accurately reflect field-scale values. Although some provision was made for this, by increasing residual strength value slightly from 9° to 10°, the material and mass strength will likely vary at the field-scale due to a variety of multi-scale effects and process- es, including: variability in clay content and type, re-consolidation (Gibo et al., 2002), large-scale 3D internal friction effects between landslide blocks (Morgenstern, 1995), external friction effects along mudstone landslide boundaries (e.g. Massey et al., 2013), and secondary mineralisation increasing shear resistance (adding cohesion). Another source of error in the stability models is the accuracy of the position of the water table, and the assumption this is static. In the ‘current day’ slope model the water table is assumed planar with its depth informed by piezometer data from BH2, although this level is unlikely to be uni- form across the slope, as the occurrence of springs testifies. 7.9.2. Pre-slide slope The pre-slide slope stability models have some major limitations, for example, the pre-slipped slope profile, groundwater levels and pre-slip slip surface geometry are estimates, constrained by limited ground monitoring data, as previously discussed. The pre-slide slope stability model is very sensitive to slope angle, as shown from the sensitivity analysis of slope angle in Fig. 9A. The geotechnical values (Table 4) are also largely estimates based on values from the literature and some lim- ited shear strength testing from on-site and nearby site materials. Nev- ertheless, back-analysis using slope stability modelling techniques does offer a useful tool to test our understanding of plausible failure mecha- nisms in ancient landslides, and informs the current day regional hazard and sensitivity of the system to environmental and anthropogenic perturbations. To reduce the uncertainties in the ground model, and the stability models developed from it, deep drilling is required with groundwater monitoring, geotechnical testing, dating and mineralogi- cal studies, and further geophysics (e.g. passive and active seismic). 8. Conclusions A combination of geological, geomorphological, geophysical, dating, and stability modelling techniques have been applied here to recon- struct the 2D architecture and failure mechanism of a relict landslide on the Jurassic Escarpment in Northern England. This paper provides the basis for a preliminary ground model for the Mark Nab slope and the numerous other large, deep-seated bedrock landslides typically found across the North York Moors region. The study shows that the large slope failures are typically developed in weak mudstone lithology of the Lower Jurassic mudstones (Whitby Mudstone Formation) and the principal failure mechanism is geologically controlled by the thickness of the mudstone and the presence of bedding controlled failures along ‘slide-prone horizons’. Geomorphological evidence and new radiocar- bon dating of sediment provide new understanding of the landslide movement history, and this knowledge helps inform expert based land- slide hazard assessment in the region. The study includes the first appli- cation of the ERT geophysical technique to image a deep-seated landslide in Jurassic rocks in the Cleveland Basin. The combined ap- proach, where ERT is calibrated with borehole data and detailed geological mapping, proved crucial in the assessment of the landslide deposit volume, 3D internal architecture and depth of principal slip sur- faces. Static slope stability modelling (non-dynamic) suggests that the slope most likely initially failed in response to glacial over-steepening and de-buttressing. However, groundwater rise is also a contributing factor to instability in the region, and may have triggered and reactivated the large landslides in the adjacent non-glaciated valleys, such as Rosedale. Slope reconstruction provides new recession rate esti- mations for the North Yorkshire Jurassic Escarpment. Although current- ly inactive and dormant, the frontal mudflow complex at Mark Nab has been active within the last 2270 years BP, and this and similar slopes are moderately prone to becoming unstable again under future wetter cli- mates. These mudflow systems can be easily recognised and mapped using modern high resolution LiDAR data to improve landslide hazard maps and risk models. Importantly, this slope and other similar ones are also vulnerable to renewed instability caused by adverse anthropo- genic activity, drainage alteration or major civil engineering works. The combined geomorphological and geophysical approaches described through this case study will be of interest to hazard geologists and engi- neering geologists working on landslide problems in the NYM and in similar geological settings, including other Jurassic escarpments in the UK and overseas. The paper is also relevant to those involved with or planning landslide hazard and risk studies in high latitude regions currently undergoing active de-glaciation. Acknowledgements The authors would like to thank landowners Mr Stephen Smith, Mr Robert Smith, and Lord Burridge for allowing us access to the field site. Thanks to the BGS Staff, particularly Vanessa Banks, Anthony Cooper, and David Schofield for helpful reviews of the early manuscript. We would also like to express our appreciation to the BGS Dando dril- ling team: Stephen Thorpe, Carl Horabin, Helen Smith, Dave Morgan, ‘Gill’, and Andrew Naylor. Henry Holbrook and Simon Ward are ac- knowledged for cartography, and Hannah Jordan, Mark Barron, Andy Howard, Chris Vane, and Helen Reeves are thanked for discussions in the field and lab. The editor, Takashi Oguchi, and reviewers Greg Botha and another anonymous reviewer are thanked for their construc- tive feedback on the paper. The work was publically funded through BGS/NERC National Capability funding. The BGS authors publish with the permission of the Executive Director of the British Geological Survey (Natural Environmental Research Council). Appendix A. Supplementary data Supplementary data to this article can be found online at http://dx. doi.org/10.1016/j.geomorph.2015.07.005. References Anon, 1972. The preparation of maps and plans in terms of engineering geology. Q. J. Eng. Geol. 5, 297–367. Anon, 1995. The description and classification of weathered rocks for engineering purposes. Engineering Group of the Geological Society Working Party report. Q. J. Eng. Geol. 28, 207–242 (.2). Barron, A.J.M., Lott, G.K., Riding, J.B., 2012. Stratigraphical framework for the Middle Jurassic strata of Great Britain and the adjoining continental shelf. British Geological Survey Research Report RR/11/06 (187 pp.). British Standards Institution, 1999. BSI 5930:1999 Code of Practice for Site Investigations, Incorporating Amendments 1 and 2. British Standards Institution, London. Bromhead, E.N., Ibsen, M.-L., 2004. Bedding-contolled coastal landslides in Southeast Britain between Axmouth and the Thames Estuary. Landslides 1, 131–141. Chambers, J.E., Ogilvy, R.D., Kuras, O., Cripps, J.C., Meldrum, P.I., 2002. 3D electrical imag- ing of known targets at a controlled environmental test site. Environ. Geol. 41, 690–704. Chambers, J.E., Wilkinson, P.B., Kuras, O., Ford, J.R., Gunn, D.A., Meldrum, P.I., Pennington, C.V.L., Weller, A.L., Hobbs, P.R.N., Ogilvy, R.D., 2011. Three-dimensional geophysical anatomy of an active landslide in Lias Group mudrocks, Cleveland Basin, UK. Geomor- phology 125, 472–484. Chiverrell, R.C., Thomas, G.S.P., 2010. Extent and timing of the Last Glacial Maximum (LGM) in Britain and Ireland: a review. J. Quat. Sci. 25, 535–549. 309D.P. Boon et al. / Geomorphology 248 (2015) 296–310
  • 15. Cooper, R.G., 2007. Mass movements in Great Britain. Geological Conservation Review Series No. 33. Joint Nature Conservation Committee, Peterborough. Cox, B.M., Sumbler, M.G., Ivimey-Cook, H.C., 1999. A formational framework for the Lower Jurassic of England and Wales (onshore area). British Geological Survey Research Report RR/99/01. British Geological Survey. Cruden, D.M., Varnes, D.J., 1996. Landslide types and processes. Special Report 247: Land- slides: Investigation and Mitigation. Transportation Research Board, Washington D.C. Fell, R., Corominas, J., Bonnard, C., Cascini, L., Leroi, E., Savage, W.Z., 2008. Guidelines for landslide susceptibility, hazard and risk zoning for land use planning. Eng. Geol. 102, 85–98. Fish, P.R., Moore, R., Carey, J.M., 2006. Landslide geomorphology of Cayton Bay, North Yorkshire, UK. Proc. Yorks. Geol. Soc. 56, 5–14. Fookes, P.G., 1997. Geology for engineers: the geological model, prediction and perfor- mance. Q. J. Eng. Geol. Hydrogeol. 30, 293–424. Fox-Strangways, C.F., Reid, C., Barrow, G., 1885. The geology of Eskdale, Rosedale & etc. Explanation of quarter-sheet 96 N.E. New Series Sheet 43. Memoirs of the Geological Survey (56 pp.). Gibo, S., Egashira, K., Ohtsubo, M., Nakamura, S., 2002. Strength recovery from residual state in reactivated landslides. Geotechnique 52 (9), 683–686. Gregory, K.J., 1962a. Contributions to the Geomorphology of the North York Moors. (Unpublished PhD thesis). Gregory, K.J., 1962a. The deglaciation of Eastern Eskdale, Yorkshire. 1962. Proc. Yorks. Geol. Soc. 33, 363–380. Griffiths, J.S. (Ed.), 2002. Mapping in engineering geologyGSL Key Issues in Earth Sciences. Geological Society of London, p. 294. Hobbs, P.R.N., Boon, D.P., 2013. Great Fryup landslide: slope stability analyses. British Geo- logical Survey Internal Report IR/13/002. British Geological Survey, Nottingham. Hobbs, P.R.N., Entwisle, D.C., Northmore, K.J., Sumbler, M.G., Jones, L.D., Kemp, S., Self, S., Barron, M., Meakin, J.L., 2005. Engineering geology of British rocks & soils: the Lias Group. British Geological Survey, Internal Report No. IR/05/008. Holliday, D.W., Howard, A.S., Pattison, 1992. Sheet 43 Egton (Eskdale and Farndale) Solid and Drift Edition. British Geological Survey. HMSO. Howard, A.S., 1985. Lithostratigraphy of the Staithes Sandstone and Cleveland Ironstone formations (Lower Jurassic) of north-east Yorkshire. Proc. Yorks. Geol. Soc. 45, 261–275. Innes, J.B., 1999. In: Bridgland, D.R., Horton, B.P., Innes, J.B. (Eds.), The Quaternary of North-East England. Field Guide. Quaternary Research Association, London, pp. 21–34. Innes, J.B., Rutherford, M.M., O'Brien, C.E., Bridgland, D.R., Mitchell, W.A., Long, A.J., 2009. Late Devensian environments in the Vale of Mowbray, North Yorkshire, UK: evidence from palynology. Proc. Geol. Assoc. 120, 199–208. Johnson, R., Fish, P., 2012. Reactivation of the coastal landslide system at Cayton Bay, North Yorkshire, UK. Proc. Yorks. Geol. Soc. 59, 77–89. Jones, R.L., 1977. Late Quaternary vegetational history of the North York Moors. V. The Cleveland dales. J. Biogeogr. 4, 353–362. Jones, R.L., 1999. In: Bridgland, D.R., Horton, B.P., Innes, J.B. (Eds.), The Quaternary of North-East England. Field Guide. Quaternary Research Association, London (204 pp.). Jones, D.K.C., Lee, E.M., 1994. Landslides and Landsliding in Great Britain. HMSO, London. Jongmans, D., Garambois, S., 2007. Geophysical investigation of landslides: a review. Bull. Soc. Geol. Fr. 178, 101–112. Kendall, P.F., 1902. A system of glacial lakes in the Cleveland Hills. Q. J. Geol. Soc. 58, 471–571. Kent, P., Wilson, V., Gaunt, G.D., 1980. British Regional Geology Eastern England from the Tees to The Wash. Second ed. Institute of Geological Sciences. HMSO. Lapenna, V., Lorenzo, P., Perrone, A., Piscitelli, S., Rizzo, E., Sdao, F., 2005. 2D electrical resistivity imaging of some complex landslides in the Lucanian Apennine chain, southern Italy. Geophysics 70, B11–B18. Marsay, B., 2010. “T'ills was Fallin Down” The Great Landslip of 1872. Bilsdale Study Group, p. 82. Massey, C.I., Petley, D.N., McSaveney, M.J., 2013. Patterns of movement in reactivated landslides. Eng. Geol. 159, 1–19. McColl, S.T., Davies, T.H.R., 2013. Large ice-contact slope movements: glacial buttressing, deformation and erosion. Earth Surf. Process. Landf. 23, 1102–1115. Merritt, A.J., Chambers, J.E., Murphy, W., Wilkinson, P.B., West, L.J., Gunn, D.G., Meldrum, P.I., Kirkham, M., Dixon, N., 2013. 3D ground model development for an active land- slide in Lias mudrocks using geophysical, remote sensing and geotechnical methods. J. Int. Consortium Landslides http://dx.doi.org/10.1007/s10346-013-0409-1. Morgenstern, N.R., 1995. Keynote paper: the role of analysis in the evaluation of slope stability. In: Bell (Ed.), Landslides. Balkema, Rotterdam. Murton, D.K., Murton, J.B., 2011. Middle and Late Pleistocene glacial lakes of lowland Britain and the southern North Sea Basin. Quat. Int. 260, 115–142. Olayinka, A.I., Yaramanci, U., 2000. Assessment of the reliability of 2D inversion of apparent resistivity data. Geophys. Prospect. 48, 293–316. Powell, J.H., 2010. Jurassic sedimentation in the Cleveland Basin: a review. Proc. Yorks. Geol. Soc. 58, 21–72. Powell, J.H., Cooper, A.H., Benfield, A.C., 1992. Geology of the country around Thirsk. Memoir of the British Geological Survey, Sheet 52 (England and Wales). Radge, G.W., 1939. The glaciation of North Cleveland. Proc. Yorks. Geol. Surv. 24, 190–205. Clay materials used in construction. In: Reeves, G.M., Sims, I., Cripps, J.C. (Eds.), The Geological Society, Engineering Geology Special Publication No. 21. Schuster, R.L., Highland, L.M., 2001. Socioeconomic and environmental impacts of land- slides in the Western Hemisphere. U.S. Dept. of the Interior, U.S. Geological Survey Open File Report 01-0276. Senior, J., Rose, J., 1994. The Jurassic, Tertiary and Quaternary around Great Ayton and Roseberry Topping, Cleveland Hills, 11. In: Scrutton, C. (Ed.), Yorkshire Rocks and Landscape — A Field Guide. Yorkshire Geological Society. Simmons, I.G., Atherden, M.A., Cloutman, E.W., Cundill, P.R., Innes, J.B., Jones, R.L., 1993. Prehistoric environments. In: Spratt, D.A. (Ed.), Prehistoric and Roman Archaeology of North-East YorkshireCouncil for British Archaeology Research Report 87, BAR British Series 104. Council for British Archaeology, London, pp. 15–50. Waltham, A., Forster, A., 1999. Man as geological agent. Geology Today vol. 217. Blackwell Science Ltd. (November–December 1999). Young, T.P., 1994. The Blea Wyke Sandstone Formation (Jurassic, Toarcian) of Rosedale, North Yorkshire, UK. Proc. Yorks. Geol. Soc. 50, 129–142. 310 D.P. Boon et al. / Geomorphology 248 (2015) 296–310