
Recomendados
Recomendados
Mais conteúdo relacionado
Mais procurados
Mais procurados (19)
Semelhante a Using the Right SSD for the Job
Semelhante a Using the Right SSD for the Job (20)
Using the Right SSD for the Job
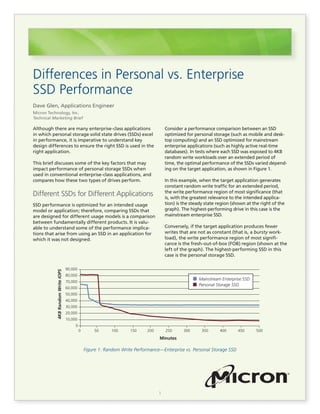
- 1. 1 Although there are many enterprise-class applications in which personal storage solid state drives (SSDs) excel in performance, it is imperative to understand key design differences to ensure the right SSD is used in the right application. This brief discusses some of the key factors that may impact performance of personal storage SSDs when used in conventional enterprise-class applications, and compares how these two types of drives perform. Different SSDs for Different Applications SSD performance is optimized for an intended usage model or application; therefore, comparing SSDs that are designed for different usage models is a comparison between fundamentally different products. It is valu- able to understand some of the performance implica- tions that arise from using an SSD in an application for which it was not designed. Differences in Personal vs. Enterprise SSD Performance Dave Glen, Applications Engineer Micron Technology, Inc. Technical Marketing Brief Consider a performance comparison between an SSD optimized for personal storage (such as mobile and desk- top computing) and an SSD optimized for mainstream enterprise applications (such as highly active real-time databases). In tests where each SSD was exposed to 4KB random write workloads over an extended period of time, the optimal performance of the SSDs varied depend- ing on the target application, as shown in Figure 1. In this example, when the target application generates constant random write traffic for an extended period, the write performance region of most significance (that is, with the greatest relevance to the intended applica- tion) is the steady state region (shown at the right of the graph). The highest-performing drive in this case is the mainstream enterprise SSD. Conversely, if the target application produces fewer writes that are not as constant (that is, a bursty work- load), the write performance region of most signifi- cance is the fresh-out-of-box (FOB) region (shown at the left of the graph). The highest-performing SSD in this case is the personal storage SSD. Figure 1: Random Write Performance—Enterprise vs. Personal Storage SSD 90,000 80,000 70,000 60,000 50,000 40,000 30,000 20,000 10,000 0 0 50 100 150 200 Minutes 250 300 350 400 450 500 4KBRandomWriteIOPS Personal Storage SSD Mainstream Enterprise SSD
- 2. 2 It is important to note that the comparison on page 1 is only one aspect of drive performance and is not a com- plete representation for all applications, usage models, or benchmarks. It does, however, illustrate that what constitutes good performance is subjective to the target application, even when comparing the same metric. Understanding Over-Provisioning Fundamentally, over-provisioning is extra media space on an SSD that does not contain user data. Every SSD contains some level of over-provisioning; and some portion of over-provisioning contains internal drive data such as firmware images, flash translation layer (FTL) information, and data redundancy information. Additionally, some of the total NAND media space, called effective over-provisioning, does not contain user data or drive internal data, and, therefore, can be used to store incoming write data. In the comparison on page 1, the mainstream enterprise SSD contained considerably more over-provisioning com- pared to the personal storage SSD, and that difference plays a critical role in steady state random performance. Introduction to Garbage Collection Because NAND media that contains data must first be erased before it can be written to, it is important for any NAND-based SSD to maintain blocks of NAND that are already erased so that new write data may be stored. A process known as garbage collection accom- plishes this in two steps. The first step separates the latest (valid) copies of user data from the obsolete (invalid) copies of user data to create blocks of NAND that contain only obsolete data. The second step is to erase the blocks containing only obsolete data to produce freshly erased blocks that can be used to store incoming write data. To better understand garbage collection, consider the example in Figure 2. A hypothetical storage device contains 256 units of nonerased memory, including both valid and invalid data. One device contains 7% effective over-provisioning and the other contains 25% effective over-provisioning. The device may only write new infor- mation to an erased location, and the device may only erase complete vertical lines in the memory array. To erase one line, the drive must first copy the valid data into a new line so that the previous line contains only invalid data. Figure 2 shows how the amount of effective over-provi- sioning affects the amount of data that must be moved for the device to produce an erasable line. (The invalid data locations were determined randomly, as would be the case for a random workload.) Differences in Personal vs. Enterprise SSD Performance Figure 2: Garbage Collection in a Randomly Filled Storage Device Valid Data Invalid Data Data to be moved 7% Effective Over-Provisioning Valid data to move: 12 25% Effective Over-Provisioning Valid data to move: 9
- 3. 3 Differences in Personal vs. Enterprise SSD Performance In the 7% effective over-provisioning example, the device must move 12 valid data locations to erase a line. The 12 valid data locations then need to be moved to an erased line of 16 write-available locations. The device then erases the old line to prepare it for the next round of garbage collection. This produces a net gain of four write-available units, because all except four units of the previously erased line were used to store the valid data. After four more units of data are written, the process repeats. In the 25% effective over-provisioning example, the device must move nine valid data locations to erase a line. The nine valid data locations then need to be moved to an erased line of 16 write-available units. This produces a net gain of seven write-available units. After seven more units of data are written, the process repeats. The 25% over-provisioning example has two advan- tages over the 7% over-provisioning example: • Fewer valid data locations need to be moved (9 versus 12) • Each time garbage collection occurs there is a greater net gain in write-available units (seven versus four), which means for the same amount of write traffic, garbage collection is needed half as often. The result of these advantages is improved random write performance and decreased write amplification. Over-Provisioning and Random Workloads An SSD’s effective over-provisioning is the ratio of invalid data to valid data. The amount of effective over-pro- visioning on an SSD can be amplified by increasing the number of logical blocks that do not contain valid data. The example in Figure 3 demonstrates the impact of effective over-provisioning on performance. In the example, the same tests were performed on the same SSD containing the same firmware installed in the same system. The only variable was the level of effective over-provisioning on the SSD. For these tests: • All user data was removed from the SSD and the SSD was returned to FOB conditions using the SECURITY ERASE ATA command. • The accessible area of the SSD was decreased, and therefore, the level of effective over-provisioning increased, using the SET MAX ADDRESS ATA command. The tests showed: • Additional over-provisioning does not increase the performance from FOB conditions and only has an effect after the drive has been filled with data. • Increasing effective over-provisioning results in a continuous increase in steady state random write performance. Figure 3: Over-Provisioning and Random Write Workloads 7.4% Effective OP 53.4% Effective OP 19.3% Effective OP 79.0% Effective OP 34.2% Effective OP 114.8% Effective OP 1.10 1.00 .90 .80 .70 .60 .50 .40 .30 .20 .10 .00 0 50 100 150 200 250 300 350 400 500450 Minutes 4KBRandomWriteIOPSNormalizedtoFOB
- 4. 4 Differences in Personal vs. Enterprise SSD Performance Figure 4: Garbage Collection in a Sequentially Preconditioned Storage Device Although the numbers may change based on the drive tested, the relative results and overall principle are universally applicable. As the random steady state performance improves, the write amplification decreases because of the improvements in garbage collection, as discussed in the previous section. Over-Provisioning and Sequential Workloads The previous section demonstrated the effect of over- provisioning on random write performance and write amplification under random workloads. Because sequen- tial workloads are fundamentally different, we examine two cases in which the drive is preconditioned differently. Case 1: Sequential Preconditioning When an SSD is subjected to a sequential write work- load, the data on the drive typically gets laid out in a continuous pattern on the NAND media. When this pattern persists across the entire NAND array, the drive is considered to be sequentially preconditioned. When an SSD is then sequentially refilled, continuous sections of the NAND media become invalidated at once. Figure 4 shows that because of sequential precondi- tioning, the data is arranged continuously across the NAND media. When subjected to a sequential work- load, the data will therefore be invalidated (replaced with new data on the same logical block address [LBA]) in a continuous pattern. When this occurs, garbage collection is not needed to relocate data because continuous lines of old data already exist and can be erased without incurring a performance drop or addi- tional write amplification. Therefore, adding over-provi- sioning does not improve sequential write performance. Case 2: Random Preconditioning When a drive has been preconditioned with a random workload, the valid data is randomly scattered across the NAND media (as shown in Figure 2). Then, when the drive is subjected to a sequential workload, it produces a random pattern of invalid data as new sequential data replaces old random data. Because the invalid data is randomly distributed, garbage collec- tion must relocate valid data, which means added over-provisioning would increase performance. After a continuous sequential workload is applied for a sufficient period of time, however, the drive will return to a sequentially preconditioned state, as in case 1. (The period of time this takes varies depending on the drive.) Sequential performance with sequential precondi- tioning (case 1) is always higher than sequential perfor- mance with random preconditioning (case 2). The level of over-provisioning on the drive only changes how much degradation occurs, as in case 2. Sequentially Filled and Refilled (7% OP) Valid Data Invalid Data Data to be moved Valid data to move: 0 Sequentially Filled and Refilled (25% OP) Valid data to move: 0
- 5. 5 Differences in Personal vs. Enterprise SSD Performance micron.com Products are warranted only to meet Micron’s production data sheet specifications. Products and specifications are subject to change without notice. ©2013 Micron Technology, Inc. Micron and the Micron logo are trademarks of Micron Technology, Inc. All other trademarks are the property of their respective owners. All rights reserved. 12/13 EN.L P:11446 Write Buffering and Steady State Performance Traditionally, write buffering has been used to increase instantaneous, or burst, I/O performance and has not been regarded as a factor in sustained performance. For SSDs, the assumption that a volatile write buffer has no effect on sustained performance is not necessarily true, because parallelism is critical for SSD performance. One method for increasing parallelism is a process known as write accumulation, where several smaller WRITE operations are combined into a larger WRITE operation across multiple physical NAND die. This process optimizes WRITE operations and produces the greatest amount of data written with the least amount of media busy time. To take advantage of write accu- mulation, the drive must have some form of write buffer in which to accumulate WRITE commands. Some Micron enterprise SSDs have enough energy storage capability to protect all data in a write accu- mulation buffer from data loss during a power-loss event. This enables the drive to safely accumulate WRITE commands, even when the volatile write buffer has been disabled. Micron personal storage SSDs, however, typically do not have this capability. In a conventional personal storage application such as personal computing, this difference is inconse- quential because personal storage applications nearly always operate with the volatile write cache enabled. However, in applications where the volatile write cache is disabled, these personal storage drives could experience reduced performance. Summary Many factors affect how well an SSD performs in a particular application. The way an application accesses the SSD can have a significant impact on SSD perfor- mance, endurance, and reliability. It is important for system designers to understand some of the key differences between personal storage and enterprise SSDs, as outlined in this technical marketing brief, to ensure an optimal fit for their usage model.