1. 1. Introduction
A number of recent global natural and anthropogenic disasters, e.g. the 2010 Chilean Earthquake, Pakistan Flood, Deepwater Horizon Oil Spill, has
resulted in an increased demand for historical and modern data for rapid assessments of dynamic situations. Every major event can only be understood
when compared with previous observations. Operational oceanography requires rapid evaluation of the impact of singular events on the natural
environment, including magnitude of various anomalies or deviations from the mean state. Thus, the knowledge of the mean state of the ocean – the
ocean climatology – becomes critically important in operational oceanography. The accurate estimation of the current state of the ocean and evaluation
of long-term trends of oceanic parameters (temperature, salinity, chlorophyll etc.) can be attained by utilizing available data accumulated in the World
Ocean Database (WOD), maintained and regularly updated by the U.S. National Oceanic and Atmospheric Administration, National Oceanographic Data
Center (NODC). The latest version of the World Ocean Database (WOD09), released in September 2009, is a major step in this direction.
4. Climate Change Studies at the NODC/Ocean Climate Laboratory
The WOD has been widely used to study climate change in the ocean. Estimates
have been made of long-term trends of major oceanic parameters such as heat
content (Figures 3 and 4) and freshwater content (Figure 6).
The most important finding of the last decade was the discovery of global warming
of the World Ocean (Levitus et al., 2000, 2005, 2009; Figures 3 and 4). The global
ocean warming research significantly expanded in the 2000s thanks to the vastly
improved data coverage that led to new, more accurate estimates of the rate of
oceanic warming (Levitus et al., 2009; Figures 3 and 4). Since the ongoing
oceanic warming causes thermal expansion of the ocean water volume
(thermosteric effect), the newly available global data base enabled a re-appraisal of
the thermosteric global sea level rise (Antonov et al., 2005).
2. World Ocean Database Growth Over the Last 50 Years
The global pool of oceanographic data experienced a dramatic growth since the
World War II (Figure 1), when oceanographic research was recognized as vital for
national security. The 1957-1958 International Geophysical Year gave another
impetus to oceanographic observations and led to the establishment of the ICSU
World Data Centers in Oceanography that greatly facilitated international data
exchange.
#ofTemperatureprofiles(104)
Figure 1. Temporal distribution of data in WOD09 by instrument type: Bottle,
Mechanical Bathythermograph (MBT), Expendable Bathythermograph (XBT),
Conductivity-Temperature-Depth (CTD), Profiling Float (PFL), Undulating
Oceanographic Recorder, Moored Buoy, Drifting Buoy, Glider, and Autonomous
Pinniped Bathythermograph.
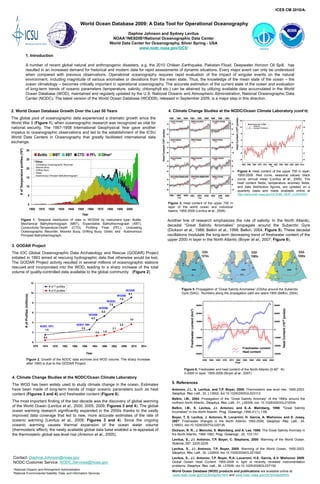
Figure 5. Propagation of “Great Salinity Anomalies” (GSAs) around the Subarctic
Gyre (SAG). Numbers along the propagation path are years-1900 (Belkin, 2004).
3. GODAR Project
The IOC Global Oceanographic Data Archaeology and Rescue (GODAR) Project
initiated in 1993 aimed at rescuing hydrographic data that otherwise would be lost.
The GODAR Project activity resulted in several millions of oceanographic stations
rescued and incorporated into the WOD, leading to a sharp increase of the total
volume of quality-controlled data available to the global community (Figure 2).
Another line of research emphasizes the role of salinity. In the North Atlantic,
decadal “Great Salinity Anomalies” propagate around the Subarctic Gyre
(Dickson et al., 1988; Belkin et al., 1998; Belkin, 2004; Figure 5). These decadal
oscillations modulate the long-term decreasing trend of freshwater content of the
upper 2000 m layer in the North Atlantic (Boyer et al., 2007; Figure 6).
Figure 3. Heat content of the upper 700 m
layer of the world ocean and individual
basins, 1955-2008 (Levitus et al., 2009).
4. Climate Change Studies at the NODC/Ocean Climate Laboratory (cont’d)
Figure 4. Heat content of the upper 700 m layer,
1955-2008. Red curve, seasonal values; black
curve, annual mean (Levitus et al., 2009). The
heat content fields, temperature anomaly fields,
and data distribution figures, are updated on a
quarterly basis and made available online at
http://www.nodc.noaa.gov/OC5/3M_HEAT_CONTENT/.
Figure 6. Freshwater and heat content of the North Atlantic (0-80°N)
0-2000 m layer, 1955-2006 (Boyer et al., 2007).
5. References
Antonov, J.I., S. Levitus, and T.P. Boyer, 2005: Thermosteric sea level rise, 1955-2003.
Geophys. Res. Lett., 32, L12602, doi:10.1029/2005GL023112.
Belkin, I.M., 2004: Propagation of the “Great Salinity Anomaly” of the 1990s around the
northern North Atlantic, Geophys. Res. Lett., 31, L08306, doi: 10.1029/2003GL019334.
Belkin, I.M., S. Levitus, J.I. Antonov, and S.-A. Malmberg, 1998: "Great Salinity
Anomalies" in the North Atlantic. Prog. Oceanogr.,1998,41(1),1-68.
Boyer, T, S. Levitus, J. Antonov, R. Locarnini, H. Garcia, A. Mishonov, and S. Josey,
2007: Freshwater changes in the North Atlantic 1955-2006, Geophys. Res. Lett., 34,
L16603, doi:10.1029/2007GL030126.
Dickson, R. R., J. Meincke, S. Malmberg, and A. Lee, 1988: The Great Salinity Anomaly in
the North Atlantic, 1968 1982, Prog. Oceanogr., 20, 103-151.
Levitus, S., J.I. Antonov, T.P. Boyer, C. Stephens, 2000: Warming of the World Ocean.
Science, 287, 2225-2229.
Levitus, S., J.I. Antonov, T.P. Boyer, 2005: Warming of the World Ocean, 1955-2003.
Geophys. Res. Lett., 32, L02604, doi:10.1029/2004GL021592.
Levitus, S., J.I. Antonov, T.P. Boyer, R.A. Locarnini, H.E. Garcia, A.V. Mishonov 2009:
Global Ocean Heat Content 1955-2008 in light of recently revealed instrumentation
problems. Geophys. Res. Lett., 36, L07608, doi:10.1029/2008GL037155.
World Ocean Database (WOD) products and publications are available online at:
www.nodc.noaa.gov/OC5/indprod.html and www.nodc.noaa.gov/OC5/indpubhtml.
Contact: Daphne.Johnson@noaa.gov
NODC Customer Service: NODC.Services@noaa.gov
HeatContent(1022joules)
1National Oceanic and Atmospheric Administration
2National Environmental Satellite, Data, and Information Services
SAG SAG SAG
WOD09
9.1
NODC 1974
1.5
NODC 1991
2.5
WOA94
4.5
WOD98
5.3
WOD05
7.9
WOD01
7.0
3.6
0.4
1.3 1.5
2.1
2.6
0
2
4
6
8
10
12
1970 1974 1978 1982 1986 1990 1994 1998 2002 2006 2010 2014
Year
# of T profiles
# of S profiles
0
5
10
15
20
25
30
1900 1910 1920 1930 1940 1950 1960 1970 1980 1990 2000
Year
Bottle MBT XBT CTD PFL Other*
*Other:
Undulating Oceanographic Recorder
Moored Buoy
Drifting Buoy
Glider
Autonomous Pinniped Bathythermograph
Figure 2. Growth of the NODC data archives and WOD volume. The sharp increase
after 1993 is due to the GODAR Project.
#ofProfiles(millions)
HeatContent(1022joules)
Freshwatercontent(km3)
HeatContent(1018joules)
Freshwater content
Heat content
ICES CM 2010/A:
World Ocean Database 2009: A Data Tool for Operational Oceanography
Daphne Johnson and Sydney Levitus
NOAA1/NESDIS2/National Oceanographic Data Center
World Data Center for Oceanography, Silver Spring - USA
www.nodc.noaa.gov/OC5/