Multiplication tables and population statistics by age
•
0 likes•44 views

1. This document contains tables showing multiplication tables from 1 to 10 and attendance hours and percentages for different days of the week. 2. It also contains data on population percentages by age group for different locations, showing the highest percentage is generally the 19-60 age group. 3. Finally, there are pie charts comparing the age group percentages for 3 different neighborhoods.

Recommended
More Related Content
What's hot
What's hot (18)
Viewers also liked
Viewers also liked (14)
Similar to Multiplication tables and population statistics by age
Similar to Multiplication tables and population statistics by age (20)
More from DAYCIQUISHPE
More from DAYCIQUISHPE (20)
Recently uploaded
Recently uploaded (20)
Multiplication tables and population statistics by age
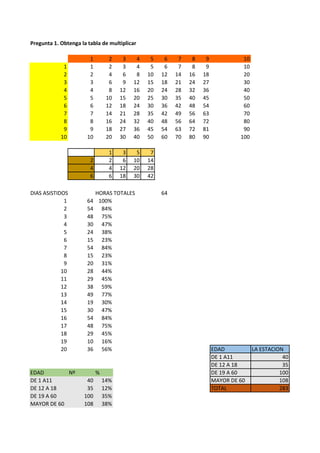
- 1. Pregunta 1. Obtenga la tabla de multiplicar 1 2 3 4 5 6 7 8 9 10 1 1 2 3 4 5 6 7 8 9 10 2 2 4 6 8 10 12 14 16 18 20 3 3 6 9 12 15 18 21 24 27 30 4 4 8 12 16 20 24 28 32 36 40 5 5 10 15 20 25 30 35 40 45 50 6 6 12 18 24 30 36 42 48 54 60 7 7 14 21 28 35 42 49 56 63 70 8 8 16 24 32 40 48 56 64 72 80 9 9 18 27 36 45 54 63 72 81 90 10 10 20 30 40 50 60 70 80 90 100 1 3 5 7 2 2 6 10 14 4 4 12 20 28 6 6 18 30 42 DIAS ASISTIDOS HORAS TOTALES 64 1 64 100% 2 54 84% 3 48 75% 4 30 47% 5 24 38% 6 15 23% 7 54 84% 8 15 23% 9 20 31% 10 28 44% 11 29 45% 12 38 59% 13 49 77% 14 19 30% 15 30 47% 16 54 84% 17 48 75% 18 29 45% 19 10 16% 20 36 56% EDAD LA ESTACION DE 1 A11 40 DE 12 A 18 35 EDAD Nº % DE 19 A 60 100 DE 1 A11 40 14% MAYOR DE 60 108 DE 12 A 18 35 12% TOTAL 283 DE 19 A 60 100 35% MAYOR DE 60 108 38%
- 2. TOTAL 283 100% 0% 5% 10% 15% 20% 25% 30% 35% 40% 45% DE 1 A11 DE 12 A 18 DE 19 A 60 MAYOR DE 60 PORCENTAJES DE EDADES
- 3. PUCARA DOLOROSA % % % 30 90 14% 14% 40% 60 50 12% 29% 22% 80 49 35% 38% 22% 40 36 38% 19% 16% 210 225 100% 100% 100% PORCENTAJE DE EDADES DE 3 BARRIOS
- 4. 14% 12% 35% 38% 14% 29% 38% 19% 40% 22% 22% 16% 0% 5% 10% 15% 20% 25% 30% 35% 40% 45% DE 1 A11 DE 12 A 18 DE 19 A 60 MAYOR DE 60 PORCENTAJE DE EDADES DE 3 BARRIOS