Customer Satisfaction Survey Analysis
•
4 likes•6,278 views

Full version: http://www.consultingcafe.com/products/customer-satisfaction-survey-report Context: This presentation was put together in order to analyze and understand the expectations of the visitors of a major multinational company’s website. This is a preliminary work to upgrading the client’s website. Objectives of the presentation: 1- Identify the different visitor profiles 2- Measure the visitors’ satisfaction rate 3- Determine the needs and expectations of each profile This PPT makes a great template for any customer survey analysis. It can serve as a guide on how to run a customer survey online and analyze the results. Includes both qualitative and quantitative aspects of the survey.

Recommended
Recommended
More Related Content
Viewers also liked
Viewers also liked (18)
Recently uploaded
Recently uploaded (20)
Customer Satisfaction Survey Analysis
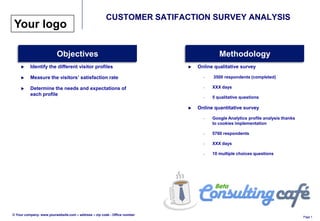
- 1. CUSTOMER SATIFACTION SURVEY ANALYSIS Your logo Objectives Methodology Identify the different visitor profiles Online qualitative survey Measure the visitors’ satisfaction rate ‒ 3500 respondents (completed) Determine the needs and expectations of ‒ XXX days each profile ‒ 5 qualitative questions Online quantitative survey ‒ Google Analytics profile analysis thanks to cookies implementation ‒ 5760 respondents ‒ XXX days ‒ 10 multiple choices questions © Your company- www.yourwebsite.com – address – zip code - Office number Page 1
- 2. Expectations of visitors (Quants) Your logo The profiles of participants Profile of participants profile 1 profile 2 profile 3 profile 4 Group 1 and group 2 represent 75% of the participants 94% of participants are men – Aviation enthusiasts represent the first group of Young participants represent an interesting part of the participants with 42% total surveyed population: Aviation professional represent 23% of participants – Less than 24: 21% Authorities and Government staff, and stakeholder analysts – 25-34: 25% are the smallest groups of participants in volume – 34-44: 22% Student, professors represent 10% of participants – 54-65: 28% – Above 65: 4% © Your company- www.yourwebsite.com – address – zip code - Office number Page 2
- 3. The expectations of visitors Your logo Online quantitative survey Visitors’ satisfaction 82% of participants have a positive opinion of (Your client) before visiting the website A majority of visitors is not highly familiar with the website: – 29% visit the website occasionally or driven by the news – 21% experience their first visit on the website 71% of visitors are globally satisfied with the website: – 49% are satisfied and 22% are strongly satisfied – 21% are indifferent about the website (3rd observation) © Your company- www.yourwebsite.com – address – zip code - Office number Page 3
- 4. The expectations of visitors Your logo Online quantitative survey Visitors’ expectations 70% of participants are looking for (xxx) information, among which: – 70% are looking for (xxx) – 59% are looking for (xxx) – 47% are looking for (xxx) Only 19% of participants are looking for company information, among which: – 69% are looking for (xxx) – 40% are looking for (xxx) – 39% are looking for (xxx) 6% of participants are looking for (xxx) Around 30% of visitors are also looking for: – Photo, videos and goodies (38%) – News and publication (32%) – Latest sales and orders & delivery figures (32%) © Your company- www.yourwebsite.com – address – zip code - Office number Page 4
- 5. The expectations of visitors Your logo Online quantitative survey Visitors’ expectations Item Strongly Disagree Indiferre Agree Strongly Participants are globally satisfied with the disagree nt agree website (67% of participants are positive about the different aspects) The website is fast (pages are downloaded quickly) 1% 3% 12% 61% 22% The most popular aspects of the website are its technical performance (“pages are The information is easy to find 2% 9% 24% 50% 15% downloaded quickly”) and the quality of The contents are up-to date 2% 7% 21% 50% 20% contents (“The information is useful and The information is useful and interesting”) interesting 1% 3% 16% 55% 25% The information is detailed enough 3% 11% 25% 45% 16% The entertaining and innovative aspects of the website are the weakest points The website is aesthetic (looks nice) 2% 7% 21% 45% 24% Other areas for improvements are the details The website is innovative 3% 10% 35% 37% 15% provided and the ease to find information The website is entertaining 3% 10% 35% 37% 15% © Your company- www.yourwebsite.com – address – zip code - Office number Page 5
- 6. Profiles’ description Your logo Online quantitative survey Website population description through Google Analytics analysis and online survey answers © Your company- www.yourwebsite.com – address – zip code - Office number Page 6
- 7. Website population Your logo Profile 1 • 33% of participants (1790) • Positive opinion before visit: 84% (+2) • Satisfaction rate: Positive 73%, Indifferent 20%, Negative 8% • Frequency of visits: Driven by the news 31%, at least once a week (23%) • Age: 25-34 (21%), 34-44 (22%), 44-65 (31%) • Sex: Female (98%) profile 1 constitute the larger population among Google Analytics * visitors Visits: 416 They are looking for xxx Pages per visit: 8.52 profile 1 are strongly interested in interactive Duration per visit: 9 min 17 contents and applications (xxx, xxx and xxx) New vs returning visitors: 68% xxx does not appear as a strong expectation Bounce rate: 2.6% Top Sources of traffic: Direct 40%, Google 38%, Yahoo 5%, Wikipedia (en), 3%, Bing 2.6%,other 10.2% “All the latest news regarding (Your client). This can be news about new models such as development progress and related media such as * To be analyzed in the long term (trend) movie clips. Or the latest sales.” • Profile 1 are the largest population on the current (Your client) website and constitute strong information Actions relays for (Your client) • They are interested in xxx and xxx © Your company- www.yourwebsite.com – address – zip code - Office number Page 7
- 8. CUSTOMER SATIFACTION SURVEY ANALYSIS Download full http://www.consultingcafe.com/products/customer-satisfaction-survey-report version - 21 slides
- 9. CUSTOMER SATIFACTION SURVEY ANALYSIS Download full version http://www.consultingcafe.com/products/customer-satisfaction-survey-report