Quick Doctor In Kuwait +2773`7758`557 Kuwait Doha Qatar Dubai Abu Dhabi Sharj...
Ian sanderson
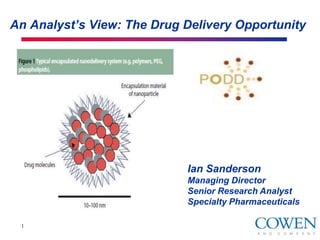
1. An Analyst’s View: The Drug Delivery Opportunity
Ian Sanderson
Managing Director
Senior Research Analyst
Specialty Pharmaceuticals
1
2. An Analyst’s View: The Drug Delivery Opportunity
1. What defines drug delivery in the eyes of Wall Street?
2. Where do the opportunities lie in drug delivery?
– the Wall Street perspective
3. Valuing drug delivery development programs
4. Financing drug delivery development
2
3. Market perspectives – How we define drug delivery
Old: New:
Reformulation of an existing New molecular entities, with
compound – usually off- new PD profile
patent
Differentiating profiles for
Mostly oral controlled-release complex molecules
Out-licensed post POC - or Site-specific, targeted
earlier - in return for royalty delivery technologies
stream
Internally developed or
Once a life-cycle management partnered
strategy, now a generic
development requirement
NME risk and economics
3
5. Market perspectives – Where do the opportunities lie?
Evolving regulatory and reimbursement landscape
1. Gradual shift toward comparative effectiveness evaluation –
moves U.S. standards closer to E.U. standards
raises regulatory and reimbursement hurdles
raises differentiation standard for development partners
2. Biosimilar regulatory pathway creates opportunities
3. Development/commercial partners: new goals for drug delivery
fewer lifecycle extension programs
greater focus on changing/improving therapeutic profile
…driving shift toward NME/NCE development for drug delivery
5
6. Market perspectives – Where do the opportunities lie?
Business Models shifting back toward partnership model
EVOLUTION OF THE DRUG DELIVERY BUSINESS MODEL
1980's to early 1990's Mid-1990's to Mid-2000's 2008 to current
Broad technology platforms Companies built around products Technology platforms targeting
rather than technologies complex drug delivery issues
Development partnership, Internal product development Development partnership,
royalty-based model full integration ("FIPCO") royalty-based model
niche commercial capabilities
Standard equity financing Creative, off-balance sheet financing Creative, royalty-based financing
M&A Partner financing
M&A
ALZA, Elan, SkyePharma, etc. ALZA, Elan, Alkermes, Inhale, etc Nektar, ImmunoGen, Seattle Genetics,
etc.
6
7. Valuing drug delivery development programs
4 key valuation factors:
1. Targeted patient population and likely penetration
2. Estimated pricing
Incorporates therapeutic profile/differentiation
3. Discount rate
Incorporates cost of capital plus hurdle return rate
We assume positive NPV in our analyses
4. Probability of clinical/regulatory/market success
Usually a rough estimate based on what we know of clinical
trial design, FDA guidance, and medical need
7
8. Valuing drug delivery development programs
INTERNALLY-DEVELOPED PROGRAM
NPV ANALYSIS OF NKT R-1 0 2
2011E 2012E 2013E 2014E 2015E 2016P 2017P 2018P 2019P 2020P
Projected Sales $30 $120 $300 $400 $500 $600 $700
COGS $6 $14 $30 $40 $50 $60 $70
Estim ated R&D Spending $100 $150 $100 $65 $50 $45 $45 $40 $35 $30
Estim ated SG&A Spending $5 $20 $36 $60 $70 $80 $90 $100
Operating Ex penses $100 $150 $105 $91 $100 $135 $155 $170 $185 $200
Operating Incom e ($100) ($150) ($105) ($61) $20 $165 $245 $330 $415 $500
% Of Sales 16.3% 55.0% 61.3% 66.0% 69.2% 71.4%
Net Cash Flow ($100) ($150) ($105) ($61) $20 $165 $245 $330 $415 $500
Discount Rate 20%
Estim ated NPV $210
Sour ce: Com pany r epor t s and Cowen and Com pany, LLC est im at es
PARTNERED PROGRAM
NPV ANALYSIS OF EURX/ CEPH'S AM RIX
Year 1 Year 2 Year 3 Year 4 Year 5 Year 6 Year 7 Year 8 Year 9 Year 1 0
Projected Sales $6 $74 $114 $112 $115 $120 $130 $140
Royalties/ Mfg Fees to EURX $1 $13 $19 $19 $20 $20 $22 $24
COGS $0 $0 $0 $0 $0 $0 $0 $0
Estim ated R&D Spending $30 $25 $5 $3 $0 $0 $0 $0 $0 $0
Estim ated SG&A Spending $0 $0 $0 $0 $0 $0 $0 $0 $0
Operating Ex penses $30 $25 $5 $3 $0 $0 $0 $0 $0 $0
Operating Incom e ($30) ($25) ($4) $10 $19 $19 $20 $20 $22 $24
% Of Sales 17.0% 17.0% 17.0% 17.0% 17.0% 17.0%
Net Cash Flow ($30) ($25) ($4) $10 $19 $19 $20 $20 $22 $24
Discount Rate 10%
Estim ated NPV $48
Sour ce: Com pany r epor t s and Cowen and Com pany, LLC est im at es
8
9. Valuing drug delivery development programs
Changing Assumptions:
Revenues –
Longer development timelines (larger, longer pivotal trials)
Slower revenue ramps, due to managed care restrictions in U.S.
Higher year 4-8 sales estimates, due to global sales infrastructures
Costs –
Higher development costs (+20-40%, depending on the category)
Lower GPM in competitive U.S. markets and ROW markets
Lower relative promotional/marketing spending (as % of sales)
Terminal multiple:
Discount rate (cost of capital plus risk premium):
Probability of success:
9
10. Financing drug delivery development
Options more limited in volatile current market environment
Public market equity financing currently expensive
– if available at all
Debt/Convertible financing more available
– inflexible in a downside scenario
Pharma/Biotech partner financing
– important external validation to investors
– development goals aligned
– usually non-dilutive to equity investors
Royalty-based financing
– available for later-stage programs only
– lower capital costs than equity, less restrictive than debt
10
12. An Analyst’s View: The Drug Delivery Opportunity
Conclusions:
1. Drug Delivery returning to its routes of solving Tx problems
Platform technologies targeting more complex delivery problems
Development costs increasing – increased reliance on partnerships
NPV’s remain positive – aided by good royalty terms
2. Investors again looking for transformative delivery technologies
High unmet medical needs, strong pricing trends, little managed care
But…less willing to fund development risks and commercialization
3. …But Pharma companies willing to pay up for novel technologies
in earlier development stages
12
13. An Analyst’s View: The Drug Delivery Opportunity
Ian Sanderson
Managing Director
Senior Research Analyst
Specialty Pharmaceuticals
13