Hybrid energy(PV wind and conventional sources)
•
0 likes•74 views

Design of Reliable Hybrid (PV, Wind and Conventional) Power System with Energy Storage in Batteries for Remote Residential Homes (For A village)

Recommended
Recommended
More Related Content
What's hot
What's hot (20)
Similar to Hybrid energy(PV wind and conventional sources)
Similar to Hybrid energy(PV wind and conventional sources) (20)
More from Chandan
More from Chandan (7)
Recently uploaded
Recently uploaded (20)
Hybrid energy(PV wind and conventional sources)
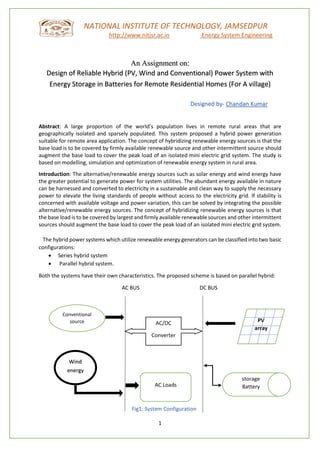
- 1. 1 NATIONAL INSTITUTE OF TECHNOLOGY, JAMSEDPUR http://www.nitjsr.ac.in Energy System Engineering An Assignment on: Design of Reliable Hybrid (PV, Wind and Conventional) Power System with Energy Storage in Batteries for Remote Residential Homes (For A village) Designed by- Chandan Kumar Abstract: A large proportion of the world’s population lives in remote rural areas that are geographically isolated and sparsely populated. This system proposed a hybrid power generation suitable for remote area application. The concept of hybridizing renewable energy sources is that the base load is to be covered by firmly available renewable source and other intermittent source should augment the base load to cover the peak load of an isolated mini electric grid system. The study is based on modelling, simulation and optimization of renewable energy system in rural area. Introduction: The alternative/renewable energy sources such as solar energy and wind energy have the greater potential to generate power for system utilities. The abundant energy available in nature can be harnessed and converted to electricity in a sustainable and clean way to supply the necessary power to elevate the living standards of people without access to the electricity grid. If stability is concerned with available voltage and power variation, this can be solved by integrating the possible alternative/renewable energy sources. The concept of hybridizing renewable energy sources is that the base load is to be covered by largest and firmly available renewable sources and other intermittent sources should augment the base load to cover the peak load of an isolated mini electric grid system. The hybrid power systems which utilize renewable energy generators can be classified into two basic configurations: • Series hybrid system • Parallel hybrid system. Both the systems have their own characteristics. The proposed scheme is based on parallel hybrid: AC BUS DC BUS Fig1: System Configuration Conventional source AC Loads AC/DC Converter PV array Wind energy storage Battery
- 2. 2 NATIONAL INSTITUTE OF TECHNOLOGY, JAMSEDPUR http://www.nitjsr.ac.in Energy System Engineering HOMER: Hybrid Optimization Model for Electric Renewable. HOMER is a micro-power optimization model software that simplifies the power system designs in a variety of applications. As HOMER does both optimization and sensitivity analysis, it makes easier to evaluate many possible system configurations of the large number of technology options and the variation in technology costs and availability of energy resources. Solar and wind data are collected. The wind speed and solar radiation as a sensitivity variable are collected to determine the effect of these variables on the cost of the system and the optimal system configuration and comparing it with excluding it. The project lifetime is estimated for about 25 years. The results obtained from Homer simulation is discussed in last section of evaluation. Also, simulation is done and presented. Energy Demand and Resources Study Area/ Location: The geographical location of the study area is Dindli basti area, Adityapur, Jamshedpur Jharkhand-831001 (22048.3’North, 86012.2’East) (location data used for calculation purpose only). METHODOLOGY: The simulated hybrid renewable energy system consists wind turbine, photovoltaic (PV) array with a power converter, battery and Diesel generator. The battery is added to the system as a backup unit and acts as a storage system. The system is designed by considering remote village in India. The solar and wind resource data of the remote site was taken from online data of NASA Methodological department and National Renewable Energy Lab (NREL). A. Schematic Diagram & Location: Fig2: Fig3: B. Load/demand assessment The electrical loads of the area are classified as domestic, agricultural, community and rural industries. • Domestic sector: TV, fan and compact fluorescent lamps. • Agricultural load: irrigation, fodder cutting and crop threshing machines. • Community load: schools, village government office buildings. • Rural industries: milk storage and small-scale milk processing plants. Etc.
- 3. 3 NATIONAL INSTITUTE OF TECHNOLOGY, JAMSEDPUR http://www.nitjsr.ac.in Energy System Engineering Losses of system: All losses through the hybrid system are classified as follows: (i) PV charge controller losses. (ii) Battery storage losses. (iii) Rectifier (battery charger conversion) losses. (iv) Inverter losses.
- 4. 4 NATIONAL INSTITUTE OF TECHNOLOGY, JAMSEDPUR http://www.nitjsr.ac.in Energy System Engineering Total load per day = 1646+10% kwh/d Peak load demand= 151+ 10%kw (+10% for deferable load) Fig4: Electrical load distribution profile C. Source Profile: a. Renewable sources • Photovoltaic (PV) Economic Information and Solar Resource: The size of a PV array system in the optimum system is 150 kW. While the total capital cost is ₹ 4200000.00 and the replacement cost is ₹200000 and lifespan is the same as PV array lifetime, which is 25 years. Each PV panels will have a rated power of 0.31 kW per unit with the output voltage of 24V D.C. The lifetime for this PV array system is 25 years with a de-rating factor of 96%. In the raining season It is seen from the data that the site has the enough solar resource potential. This is the reason behind 86.50% of electrical energy come from the PV array while the rest diesel genset and a wind turbine in the optimum system. Fig5: Type of PV array used and their cost estimation
- 5. 5 NATIONAL INSTITUTE OF TECHNOLOGY, JAMSEDPUR http://www.nitjsr.ac.in Energy System Engineering G1: solar radiations and clearness avg. per month • Wind Energy The rated capacity of WT is 100 kW. The capital cost of WT is ₹400000 and replacement cost are 100000 as the life of WT is same as project life. The technical information given by manufacturer data sheet is given as rotor diameter is 33.2m, rated wind speed is 9.5 m/s, cut-in-wind speed is 3 m/s, cut- off-wind speed is 25 m/s and height are 31.80m as per suggested by Homer. Three blades turbine are most efficient than other number of blades Fig6: Type of wind turbine set used and their cost estimation G2: Avg. wind speed per month
- 6. 6 NATIONAL INSTITUTE OF TECHNOLOGY, JAMSEDPUR http://www.nitjsr.ac.in Energy System Engineering b. Non-Renewable /Conventional Sources: (Generator) The diesel power plant of 105 kW is used in the optimal configuration. At present, the diesel price is about 81₹/L in India. The lower heating value is 43.20 MJ/kg, the density of the fuel is 820kg/m3 and carbon content is 88% and Sulphur content is 0.40%. The emission rate of different pollutant per litre of fuel of the generator are such as CO 12.56 g/L, particulate 0.718 g/L, unburned HC 0.72 g/L, NOX 14.36 g/L. are given in manufacturer sheet. The diesel generator forced to on-off automatically as per availability of renewable energy and load demand because of the advantage of more availability from PV for the optimum system to supply required load and to avoid frequent start of the generator which reduces its life. Fig7: Genset type and name plate details D. Converter (rectifier & inverter): Power Converter A power electronic converter is used to maintain the flow of energy between ac and dc component. The optimal size of power converter used in this system is of 150 kW. The capital cost, replacement costs and maintenance for this equipment for a power converter is ₹600000, ₹ 400000 and ₹10000 respectively. The lifetime for one unit of the converter is 15 years with the efficiency of 97.60%. Fig8: Converter details (AC-DC)
- 7. 7 NATIONAL INSTITUTE OF TECHNOLOGY, JAMSEDPUR http://www.nitjsr.ac.in Energy System Engineering E. Storage (Backup): The type of each battery that used for the system is 2.64 kWh model with the rating of 24V, with 110 Ah rating. The cost for one battery is ₹3560 with the replacement cost of ₹1015. Total of 40 batteries of 105 kWh capacities is used in the optimal system. The initial state of charging of all the batteries is 100%. The capital cost of batteries is ₹142400 and replacement cost are ₹40600 because of life of the battery is 17.2 years only. Fig9: Battery bank details Modelling of Hybrid Energy System Components A. Mathematical model of Solar Photovoltaic generator Using the solar radiation available on the tilted surface the hourly energy output (EPVG) of the PV. Here assumes that the temperature effects (on PV cells) are ignored. generator can be calculated according to the following equation: Epv= G(t) × A × P× ηpv Where, ηpv= PV cell efficiency A= Surface area of PV cell P=PV penetration level factor Epv = hourly energy output of PV cell G(t)= hourly irradiance in KWH/m2 B. Mathematical model of wind energy generator Hourly energy generated (EWEG) by wind generator with rated power output (PWEG) is defined by the following expression: P WEG = (1/2) × ρwind × A × V3 × CP (λ, β) × ηt × ηg and, EWEG (t) = PWEG *t Where, P WEG = Electrical power generated by wind generator EWEG (t) = Hourly energy generated by wind generator ρ Wind = Density of air in 1.22Kg / m3 v = Wind speed (m/s) C P = Performance coefficient of the turbine λ = Tip speed ratio of the rotor blade tip speed to wind speed
- 8. 8 NATIONAL INSTITUTE OF TECHNOLOGY, JAMSEDPUR http://www.nitjsr.ac.in Energy System Engineering β = Blade pitch angle (deg.) as 00 ηt = Wind turbine efficiency ηg = Generator efficiency C. Modelling of Converter. In the proposed scheme, a converter contains both rectifier and inverter. PV energy generator and battery subsystems are connected with DC bus while diesel generating unit subsystem is connected with AC bus. The electric loads connected in this scheme are AC loads. The rectifier is used to transform the surplus AC power from the diesel electric generator to charge the battery. The diesel electric generator will be powering the load and at the same time charging the battery. The rectifier model is given below: 𝐸REC-OUT (𝑡) = 𝐸REC-IN (𝑡) × 𝜂REC, 𝐸REC-IN (𝑡) = 𝐸SUR-AC (𝑡). At any time 𝑡, 𝐸SUR-AC (𝑡) = 𝐸DEG (𝑡) − 𝐸Load (𝑡). The inverter model for photovoltaic cells. 𝐸PVG-IN (𝑡) = 𝐸PVG (𝑡) × 𝜂INV, 𝐸BAT-INV (𝑡) = [(𝐸BAT (𝑡−1) − 𝐸LOAD (𝑡)) / (𝜂INV × 𝜂DCHG) D. Modelling of Charge Controller. To prevent overcharging of a battery, a charge controller is used to sense when the batteries are fully charged and to stop or reduce the amount of energy flowing from the energy source to the batteries. The model of the charge controller is presented below: 𝐸CC-OUT (𝑡) = 𝐸CC-IN (𝑡) × 𝜂CC, 𝐸CC-IN (𝑡) = 𝐸REC-OUT (𝑡) + 𝐸SUR-DC (𝑡) E. Modelling of Battery Bank. The battery state of charge (SOC) is the cumulative sum of the daily charge/discharge transfers. The battery serves as an energy source entity when discharging and a load when charging. At any time 𝑡, the state of battery is related to the previous state of charge and to the energy production and consumption situation of the system during the time from 𝑡−1 to 𝑡. During the charging process, when the total output of all generators exceeds the load demand, the available battery bank capacity at time, 𝑡, can be described by- 𝐸BAT (𝑡) = 𝐸BAT (𝑡−1) − 𝐸CC-OUT (𝑡) × 𝜂CHG. On the other hand, when the load demand is greater than the available energy generated, the battery bank is in discharging state. Therefore, the available battery bank capacity at time, 𝑡, can be expressed as - 𝐸BAT (𝑡) = 𝐸BAT (𝑡−1) − 𝐸Needed (𝑡).
- 9. 9 NATIONAL INSTITUTE OF TECHNOLOGY, JAMSEDPUR http://www.nitjsr.ac.in Energy System Engineering RESULT AND DISCUSSION: Optimization of Hybrid Renewable Energy System without Considering Sensitivity Variables The proposed hybrid renewable energy system for the village consists of the primary load of 1650 kWh/day, with the peak load of 151.51 kW and a deferrable load of +10% varies. The HOMER software identifies the best possible economical configuration for the hybrid renewable energy system. For an example, the optimal sizing and operational strategy for a hybrid renewable energy system may sometime consider all of the equipment or without considering one part of the equipment. Thus, the combination of the equipment is depending on the optimization procedure and sensitivity variables. Here four types of combination are found optimum after calculation by the HOMER. These are PV, WT, DG with the storage system Fig10: Optimization of PV/Wind/Micro-Hydro/Diesel Hybrid Power System Fig11: Optimization of system based on component Fig12: Evaluation of system based on cost
- 10. 10 NATIONAL INSTITUTE OF TECHNOLOGY, JAMSEDPUR http://www.nitjsr.ac.in Energy System Engineering G3: monthly average Electrical energy production of hybrid energy system Table: Reduction of greenhouse gaseous per year REFERENCES [1] Homer energy online on https://www.homerenergy.com/support/index.html [2] Optimization of PV/Wind/Micro-Hydro/Diesel Hybrid Power System in HOMER for the Study Area September 2011International Journal on Electrical Engineering and Informatics 3(3):307-325 DOI: 10.15676/ijeei.2011.3.3.4 [3] R. D. Prasad, “A Case Study for Energy Output using a Single Wind Turbine and a Hybrid System for Vadravadra Site in Fiji Islands”, The Online Journal on Power and Energy Engineering (OJPEE), Vol. (1) – No. (1), pp. 22-25. [4] Sunanda Sinha, S.S. Chandel. Review of recent trends in optimization techniques for solar photovoltaic–wind based hybrid energy systems. Renewable and Sustainable Energy Reviews 50 (2015); 755–769. [5] ASSESSMENT OF WIND POWER INTEGRATION TO SOLAR PHOTOVOLTAIC MINI-GRID Zenande Nombakuse (Lal et al. 2011; Jeffy et al. 2018) [6] District Plan Report (2009-2010), SUNDARGARH District, ORISSA, prepared by district administration, Sundargarh & centre for youth & social development.