Callan's 2017 10-Year Capital Market Projections and Asset Class Return Expectations
•
1 gostou•118 visualizações

Our annual 10-year outlook for various asset classes

Recomendados
Recomendados
Mais conteúdo relacionado
Mais procurados
Mais procurados (20)
Destaque
Destaque (9)
Semelhante a Callan's 2017 10-Year Capital Market Projections and Asset Class Return Expectations
Semelhante a Callan's 2017 10-Year Capital Market Projections and Asset Class Return Expectations (20)
Mais de Callan
Mais de Callan (17)
Último
Último (20)
Callan's 2017 10-Year Capital Market Projections and Asset Class Return Expectations
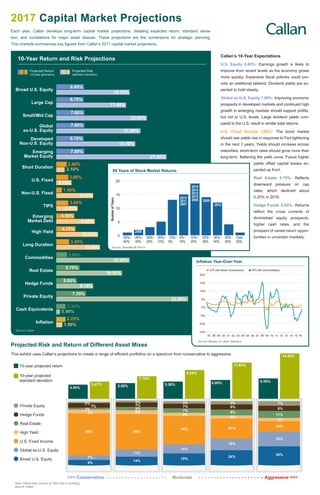
- 1. 9% 7% 65% 6% 3% 7% 2% 14% 11% 55% 6% 5% 7% 3% 19% 14% 44% 5% 7% 7% 4% 24% 18% 31% 5% 9% 8% 5% 30% 23% 16% 5% 11% 8% 7% Private Equity Hedge Funds Real Estate High Yield U.S. Fixed Income Global ex-U.S. Equity Broad U.S. Equity 10-year projected return 10-year projected standard deviation 4.50% 5.47% 5.00% 7.19% 5.50% 9.24% 6.00% 11.62% 6.50% 14.46% 10-Year Return and Risk Projections 2017 Capital Market Projections Each year, Callan develops long-term capital market projections, detailing expected return, standard devia- tion, and correlations for major asset classes. These projections are the cornerstone for strategic planning. This charticle summarizes key figures from Callan’s 2017 capital market projections. Projected Risk and Return of Different Asset Mixes This exhibit uses Callan’s projections to create a range of efficient portfolios on a spectrum from conservative to aggressive. Note: Charts may not sum to 100% die to rounding. Source: Callan <<< Conservative Aggressive >>> Callan’s 10-Year Expectations U.S. Equity 6.85%: Earnings growth is likely to improve from recent levels as the economy grows more quickly. Expansive fiscal policies could pro- vide an additional tailwind. Dividend yields are ex- pected to hold steady. Global ex-U.S. Equity 7.00%: Improving economic prospects in developed markets and continued high growth in emerging markets should support profits, but not to U.S. levels. Large dividend yields com- pared to the U.S. result in similar total returns. U.S. Fixed Income 3.00%: The bond market should see yields rise in response to Fed tightening in the next 3 years. Yields should increase across maturities; short-term rates should grow more than long-term, flattening the yield curve. Future higher yields offset capital losses ex- pected up front. Real Estate 5.75%: Reflects downward pressure on cap rates, which declined about 0.25% in 2016. Hedge Funds 5.05%: Returns reflect the cross currents of diminished equity prospects, higher cash rates, and the prospect of varied return oppor- tunities in uncertain markets. Projected Risk (standard deviation) Projected Return (10-year geometric) Inflation Cash Equivalents Private Equity Hedge Funds Real Estate Commodities Long Duration High Yield Emerging Market Debt TIPS Non-U.S. Fixed U.S. Fixed Short Duration Emerging Market Equity Developed Non-U.S. Equity Global ex-U.S. Equity Small/Mid Cap Large Cap Broad U.S. Equity 6.85% 18.25% 6.75% 17.40% 7.00% 22.60% 7.00% 21.00% 6.75% 19.70% 7.00% 2.60% 3.00% 3.00% 1.40% 9.20% 9.60% 10.35% 5.05% 5.75% 9.15% 16.35% 7.35% 32.90% 2.25% 0.90% 3.20% 10.90% 2.25% 1.50% 4.75% 18.30% 2.65% 4.50% 2.10% 3.75% 5.25% 27.45% Source: Callan 0 5 10 15 20 -50%– -40% -40%– -30% -30%– -20% -20%– -10% -10%– 0% 0%– 10% 10%– 20% 20%– 30% 30%– 40% 40%– 50% Over 50% 2008 2009 2013 2015 2011 2007 2014 2016 2012 2010 2006 89 Years of Stock Market Returns NumberofYears Moderate -15% -10% -5% 0% 5% 10% 15% 20% PPI (All Commodities)CPI (All Urban Consumers) 02 0397 98 99 00 01 04 05 06 07 08 09 10 11 12 13 14 15 16 Source: Bureau of Labor Statistics Source: Standard & Poor’s Inflation Year-Over-Year
- 2. Broad U.S. Equity 1.000 Large Cap 1.000 1.000 Small/Mid Cap 0.950 0.950 1.000 Global ex-U.S. Equity 0.850 0.850 0.850 1.000 Dev. Non-U.S. Equity 0.850 0.850 0.800 1.000 1.000 Emerging Market Equity 0.850 0.850 0.850 0.950 0.850 1.000 Short Duration -0.250 -0.250 -0.250 -0.250 -0.250 -0.300 1.000 U.S. Fixed -0.100 -0.100 -0.150 -0.150 -0.100 -0.150 0.850 1.000 Non-U.S. Fixed 0.000 0.050 -0.100 0.000 0.050 -0.100 0.500 0.500 1.000 TIPS -0.050 -0.050 -0.100 -0.050 -0.050 -0.100 0.550 0.600 0.350 1.000 Emerging Market Debt 0.550 0.550 0.550 0.600 0.550 0.600 -0.050 0.100 0.000 0.200 1.000 High Yield 0.650 0.650 0.600 0.650 0.600 0.600 -0.150 0.000 0.100 0.050 0.600 1.000 0.200 0.100 0.050 Long Duration 0.150 0.150 0.100 0.100 0.100 0.050 0.750 0.950 0.550 0.550 0.150 0.200 1.000 Real Estate 0.150 0.150 0.150 0.150 0.150 0.150 -0.200 -0.100 0.050 0.100 0.200 0.100 -0.050 1.000 Private Equity 0.750 0.750 0.700 0.700 0.650 0.650 -0.150 -0.050 -0.050 0.000 0.450 0.550 0.200 0.200 1.000 Hedge Funds 0.800 0.800 0.750 0.750 0.750 0.750 -0.150 0.100 -0.100 0.100 0.550 0.550 0.300 0.200 0.600 1.000 Commodities 0.950 0.950 0.900 0.950 0.900 0.900 -0.250 -0.200 -0.050 -0.100 0.550 0.650 0.000 0.200 0.700 0.800 1.000 Cash Equivalents -0.050 -0.050 -0.100 -0.050 0.000 -0.100 0.300 0.100 -0.100 0.050 -0.050 -0.100 -0.050 0.050 -0.050 -0.050 0.000 1.000 Inflation 0.000 0.000 0.000 0.000 0.000 0.050 -0.200 -0.300 -0.150 0.200 0.000 0.050 -0.300 0.400 0.100 0.200 0.050 0.000 1.000 Broad Large Cap Sm/Mid Cap Global ex-U.S. Dev. Non-U.S. EM Equity Short Duration U.S. Fixed Non-U.S. Fixed TIPS EM Debt High Yield Long Duration Real Estate Private Equity Hedge Funds Comm. Cash Equiv. Inflation Correlation Expectations (10 Years) Then and Now: Comparing Historical Returns to Historical Projections Annualized Returns for periods ended 12/31/2016 10 Years 15 Years 25 Years Broad U.S. Stock Market Russell 3000 7.07% 7.11% 9.29% Large Cap U.S. Stocks S&P 500 6.95% 6.69% 9.15% Small/Mid Cap U.S. Stocks Russell 2500 7.69% 9.17% 10.73% Non-U.S. Stock Markets MSCI World ex USA 0.86% 5.45% 5.11% MSCI Emerging Markets 1.84% 9.50% – Fixed Income Bloomberg Barclays Aggregate 4.34% 4.58% 5.63% Bloomberg Barclays Glbl Agg ex-US 2.44% 4.96% 4.73% Bloomberg Barclays Long G/C 6.85% 7.03% 7.58% Real Estate NCREIF* 7.22%* 8.93%* 8.32%* Hedge Funds Credit Suisse Hedge Fund* 4.21%* 5.81%* – Private Equity Cambridge Private Equity* 10.54%* 10.22%* 15.55%* Commodities Bloomberg Commodity -6.23% -0.11% -0.08% Cash Market 90-Day T-Bill 0.80% 1.34% 2.71% Inflation CPI-U** 1.75% 2.04% 2.28% Callan’s projections consist of three primary figures for each asset class: a mean rate of return, a corresponding range defined by standard deviation, and the correlations to other asset classes. These figures represent our best thinking for long-term expecta- tions and establish a mid-point within a wider range of potential outcomes. We use the projections to model portfolios for our clients. Multiple elements of the capital markets influence the projections: returns relative to inflation, equity valuations, risk premiums, GDP growth, and many other factors. These projections incorporate advanced quantitative modeling as well as qualitative feedback and the economic expertise of Callan’s consulting professionals. Our 2017 numbers reflect our optimism for the economy, for inflation, and for the capital markets. About Callan Founded in 1973, Callan Associates Inc. is one of the largest independently owned investment consulting firms in the country. Headquartered in San Francisco, CA, the firm provides research, education, decision support, and advice to a broad array of institutional investors. For more information, please contact your Callan consultant. San Francisco | 800.227.3288 Atlanta | 800.522.9782 Chicago | 800.999.3536 Denver | 855.864.3377 New Jersey | 800.274.5878 www.callan.com Published January 2017 © 2017 Callan Associates Inc. This report is for informational purposes only and should not be construed as legal or tax advice on any matter. Any investment decision you make on the basis of this report is your sole responsibility. * Real estate and hedge fund data for periods ended 9/30/2016 rather than 12/31/2016 due to a reporting lag. Private equity data is time-weighted return series for periods ended 06/30/2016. ** CPI-U data are measured as year-over-year change through 09/30/2016 due to a reporting lag. Sources: Bloomberg Barclays, Bureau of Labor Statistics, Callan, Cambridge, Credit Suisse, MSCI, NCREIF, Russell, and Standard & Poor’s. About These Projections Relationships between asset classes are as important as standard deviations. In the past, particularly in stressed markets, correlations between asset classes have risen. Callan revisits and adjusts our correlation expectations annually. Among the risky asset classes, correlations are high and will remain high. Interestingly, stocks and bonds have exhibited tremendous negative correlation over time. Other uncorrelated asset classes have been commodities, TIPS, and to some extent many absolute return strategies. We believe real estate will maintain a diversifica- tion benefit, but it is harder to measure given the valuation process. Source: Callan 0% 3% 6% 9% 12% 15% 97 99 01 03 05 07 09 11 13 15 17 Year Projected10-YearReturn Broad U.S. equity U.S. fixed income Real estate Non-U.S. equity Non-U.S. fixed income Inflation (CPI-U) Private equity Cash equivalents How Callan’s 10-Year Return Projections Have Changed Since 1997 Source: Callan