SlideShare uma empresa Scribd logo
1 de 5
Baixar para ler offline
PRESS RELEASE
Winter Shows No Signs of Cooling in Home Prices
According to the S&P/Case-Shiller Home Price Indices
New York, January 28, 2014 – Data through November 2013, released today by S&P Dow Jones
Indices for its S&P/Case-Shiller1 Home Price Indices, the leading measure of U.S. home prices,
showed that the 10-City and 20-City Composites increased 13.8% and 13.7% year-over-year. Dallas
posted its highest annual return of 9.9% since its inception in 2000. Chicago also stood out with an
annual rate of 11.0%, its highest since December 1988.
For the month of November, the two Composites declined 0.1%. After nine consecutive months of
gains, this marks the first decrease since November 2012. Nine out of 20 cities recorded positive
monthly returns; of these nine, Boston and Cleveland were the only cities not in the Sun Belt.
Minneapolis and San Diego remained relatively flat. After declining last month, Dallas edged up to
set a new index high. Denver is 0.6% off of its highest level due to two consecutive months of
declines.

S&P/Case-Shiller Home Price Indices
24%

24%

20%

20%

16%

16%

10-City Composite

Percent change, year ago

12%

8%

8%

4%

4%

20-City Composite

Percent change, year ago

12%

0%

0%

-4%

-4%

-8%

-8%

-12%

-12%

-16%

-16%

-20%

-20%

-24%
1988

1990

1992

1994

1996

1998

2000

2002

2004

2006

2008

2010

2012

2014

-24%

Source: S&P Dow Jones Indices & CoreLogic

The chart above depicts the annual returns of the 10-City Composite and the 20-City Composite
Home Price Indices. In November 2013, the 10- and 20-City Composites posted annual increases of
13.8% and 13.7%.
1

Case-Shiller and Case-Shiller Indexes are registered trademarks of CoreLogic

S&P Dow Jones Indices
S&P DOW JONES INDICES

PRESS RELEASE

“November was a good month for home prices,” says David M. Blitzer, Chairman of the Index
Committee at S&P Dow Jones Indices. “Despite the slight decline, the 10-City and 20-City
Composites showed their best November performance since 2005. Prices typically weaken as we
move closer to the winter. Las Vegas, Los Angeles and Phoenix stand out as they have posted 20 or
more consecutive monthly gains.
“Beginning June 2012, we saw a steady rise in year-over-year increases. November continued that
trend with another strong month although the rate of increase slowed. Looking at the year-over-year
returns, the Sun Belt continues to push ahead with Atlanta, Las Vegas, Los Angeles, Miami, Phoenix,
San Diego, San Francisco and Tampa taking eight of the top nine spots. Detroit continues to recover
but remains the only city with prices below its 2000 level.
“Home prices continue to rise despite last May’s jump in mortgage interest rates. Mortgage
applications for purchase were up in recent weeks confirming home builders’ optimism shown by the
NAHB survey. Combined with low inflation -- 1.5% in 2013 – home owners are enjoying real
appreciation and rising equity values. While housing will make further contributions to the economy
in 2014, the pace of price gains is likely to slow during the year.”

S&P/Case-Shiller Home Price Indices

250

250

20-City Composite

225

225

200

200

175

175

150

150
10-City and 20-City
Composites are both back
to their mid-2004 levels

125
10-City Composite

125

100

100

75

75

50
1987

1989

1991

1993

1995

1997

1999

2001

2003

2005

2007

2009

2011

2013

50

Source: S&P Dow Jones Indices and CoreLogic

The chart above shows the index levels for the 10-City and 20-City Composite Indices. As of
November 2013, average home prices across the United States are back to their mid-2004 levels.
Measured from their June/July 2006 peaks, the peak-to-current decline for both Composites is
approximately 20%. The recovery from the March 2012 lows is 23.0% and 23.7% for the 10-City and
20-City Composites.

S&P Dow Jones Indices
S&P DOW JONES INDICES

PRESS RELEASE

Nine cities showed price increases from October to November. Miami took the lead with a gain of
1.4% and Las Vegas, the previous leader, followed at +0.6%. Chicago experienced the largest decline
of 1.2%. Nine MSAs showed acceleration as measured by their monthly returns – Boston, Cleveland
and San Francisco showed returns that were over 50 basis points higher in November compared to
October. Last month after experiencing its first decline in 19 months, San Francisco rebounded to
positive territory with a 0.4% gain in November. Las Vegas, Los Angeles, Miami, Phoenix and
Tampa are the only cities that recorded positive gains for 12 or more consecutive months.
Boston, Chicago, Cleveland, Dallas, Las Vegas, Miami, New York, Tampa and Washington were the
nine cities to accelerate on an annual basis. Boston showed an annual rate of 9.8%, an improvement of
1.2 percentage points from last month. Cleveland and New York followed with November year-overyear returns of 6.0% compared to 4.9% for October. Despite the improvement, Cleveland and New
York remain the two lowest ranked cities.
More than 26 years of history for these data series are available, and can be accessed in full by going
to www.homeprice.spdji.com. Additional content on the housing market may also be found on S&P
Dow Jones Indices’ housing blog: www.housingviews.com.
The table below summarizes the results for November 2013. The S&P/Case-Shiller Home Price
Indices are revised for the 24 prior months, based on the receipt of additional source data.
Novem ber 2013
Novem ber/October
Metropolitan Area
Level
Change (%)
Atlanta
113.37
-0.3%
Boston
168.78
0.2%
Charlotte
124.83
-0.6%
Chicago
125.87
-1.2%
Cleveland
106.91
0.3%
Dallas
132.58
0.1%
Denver
146.45
-0.2%
Detroit
94.70
-0.1%
Las Vegas
128.00
0.6%
Los Angeles
214.79
0.1%
Miami
176.02
1.4%
Minneapolis
139.05
0.0%
New York
172.54
-0.4%
Phoenix
144.86
0.3%
Portland
159.92
-0.3%
San Diego
194.15
0.0%
San Francisco
180.19
0.4%
Seattle
160.17
-0.1%
Tampa
154.70
0.2%
Washington
203.71
-0.3%
Composite-10
180.15
-0.1%
Composite-20
165.80
-0.1%
Source: S&P Dow Jones Indices and CoreLogic
Data through November 2013

October/Septem ber
Change (%)
-0.2%
-0.4%
0.6%
-0.5%
-0.2%
-0.1%
-0.4%
0.9%
1.2%
0.9%
1.1%
0.5%
0.0%
0.9%
0.2%
0.3%
-0.2%
-0.3%
0.1%
-0.4%
0.2%
0.2%

1-Year Change (%)
18.5%
9.8%
8.7%
11.0%
6.0%
9.9%
8.9%
17.3%
27.3%
21.6%
16.5%
10.5%
6.0%
16.7%
12.5%
18.7%
23.2%
12.4%
15.7%
7.8%
13.8%
13.7%

Since its launch in early 2006, the S&P/Case-Shiller Home Price Indices have published, and the
markets have followed and reported on, the non-seasonally adjusted data set used in the headline
indices. For analytical purposes, S&P Dow Jones Indices publishes a seasonally adjusted data set
covered in the headline indices, as well as for the 17 of 20 markets with tiered price indices and the
five condo markets that are tracked.

S&P Dow Jones Indices
S&P DOW JONES INDICES

PRESS RELEASE

A summary of the monthly changes using the seasonally adjusted (SA) and non-seasonally adjusted
(NSA) data can be found in the table below.
Novem ber/October Change (%)

October/Septem ber Change (%)

Metropolitan Area

NSA

SA

NSA

SA

Atlanta

-0.3%

1.6%

-0.2%

1.9%

Boston

0.2%

1.3%

-0.4%

0.9%

Charlotte

-0.6%

0.5%

0.6%

1.2%

Chicago

-1.2%

0.8%

-0.5%

0.8%

Cleveland

0.3%

1.2%

-0.2%

0.8%

Dallas

0.1%

1.0%

-0.1%

1.0%

Denver

-0.2%

0.5%

-0.4%

0.3%

Detroit

-0.1%

1.3%

0.9%

1.9%

Las Vegas

0.6%

1.2%

1.2%

1.0%

Los Angeles

0.1%

0.8%

0.9%

1.5%

Miami

1.4%

1.6%

1.1%

1.8%

Minneapolis

0.0%

0.8%

0.5%

1.6%

New York

-0.4%

0.8%

0.0%

0.8%

Phoenix

0.3%

0.4%

0.9%

1.1%

Portland

-0.3%

0.7%

0.2%

0.5%

San Diego

0.0%

0.7%

0.3%

0.6%

San Francisco

0.4%

1.3%

-0.2%

0.7%

Seattle

-0.1%

0.4%

-0.3%

0.4%

Tampa

0.2%

1.1%

0.1%

0.9%

Washington

-0.3%

0.7%

-0.4%

0.6%

Composite-10

-0.1%

0.9%

0.2%

1.0%

Composite-20

-0.1%

0.9%

0.2%

1.1%

Source: S&P Dow Jones Indices and CoreLogic
Data through November 2013

About S&P Dow Jones Indices
S&P Dow Jones Indices LLC, a part of McGraw Hill Financial, is the world’s largest, global
resource for index-based concepts, data and research. Home to iconic financial market indicators,
such as the S&P 500® and the Dow Jones Industrial Average™, S&P Dow Jones Indices LLC
has over 115 years of experience constructing innovative and transparent solutions that fulfill the
needs of investors. More assets are invested in products based upon our indices than any other
provider in the world. With over 830,000 indices covering a wide range of asset classes across the
globe, S&P Dow Jones Indices LLC defines the way investors measure and trade the markets. To
learn more about our company, please visit www.spdji.com.
Standard & Poor’s and S&P are registered trademarks of Standard & Poor’s Financial Services
LLC, a part of McGraw Hill Financial. Dow Jones is a registered trademark of Dow Jones
Trademark Holdings LLC (“Dow Jones”). These trademarks have been licensed to S&P Dow
Jones Indices LLC. It is not possible to invest directly in an index. S&P Dow Jones Indices LLC,
Dow Jones, S&P and their respective affiliates (collectively “S&P Dow Jones Indices”) do not
sponsor, endorse, sell, or promote any investment fund or other investment vehicle that is offered
by third parties and that seeks to provide an investment return based on the performance of any
index. This document does not constitute an offer of services in jurisdictions where S&P Dow
Jones Indices does not have the necessary licenses. S&P Dow Jones Indices receives
compensation in connection with licensing its indices to third parties.

S&P Dow Jones Indices
S&P DOW JONES INDICES

PRESS RELEASE

For more information:
Dave Guarino
Communications
S&P Dow Jones Indices
dave.guarino@spdji.com
212-438-1471
David Blitzer
Managing Director and Chairman of the Index Committee
S&P Dow Jones Indices
david.blitzer@spdji.com
212-438-3907
917-376-1204
S&P Dow Jones Indices has introduced a new blog called HousingViews.com. This interactive
blog delivers real-time commentary and analysis from across the Standard & Poor’s organization
on a wide-range of topics impacting residential home prices, homebuilding and mortgage
financing in the United States. Readers and viewers can visit the blog at www.housingviews.com,
where feedback and commentary is certainly welcomed and encouraged.
The S&P/Case-Shiller Home Price Indices are published on the last Tuesday of each month at
9:00 am ET. They are constructed to accurately track the price path of typical single-family
homes located in each metropolitan area provided. Each index combines matched price pairs for
thousands of individual houses from the available universe of arms-length sales data. The
S&P/Case-Shiller National U.S. Home Price Index tracks the value of single-family housing
within the United States. The index is a composite of single-family home price indices for the
nine U.S. Census divisions and is calculated quarterly. The S&P/Case-Shiller Composite of 10
Home Price Index is a value-weighted average of the 10 original metro area indices. The
S&P/Case-Shiller Composite of 20 Home Price Index is a value-weighted average of the 20
metro area indices. The indices have a base value of 100 in January 2000; thus, for example, a
current index value of 150 translates to a 50% appreciation rate since January 2000 for a typical
home located within the subject market.
These indices are generated and published under agreements between S&P Dow Jones Indices
and CoreLogic.
The S&P/Case-Shiller Home Price Indices are produced by CoreLogic. In addition to the
S&P/Case-Shiller Home Price Indices, CoreLogic also offers home price index sets covering
thousands of zip codes, counties, metro areas, and state markets. The indices, published by S&P
Dow Jones Indices, represent just a small subset of the broader data available through CoreLogic.
For more information about S&P Dow Jones Indices, please visit www.spdji.com.

S&P Dow Jones Indices

Mais conteúdo relacionado

Mais procurados

SC Economic Update
SC Economic UpdateSC Economic Update
SC Economic UpdateSummer Stone
 
December 2021 Victoria Real Estate Board Statistics Package
December 2021 Victoria Real Estate Board Statistics Package December 2021 Victoria Real Estate Board Statistics Package
December 2021 Victoria Real Estate Board Statistics Package VickyAulakh1
 
Victoria Real Estate Board Statistics - November 2021
Victoria Real Estate Board Statistics - November 2021Victoria Real Estate Board Statistics - November 2021
Victoria Real Estate Board Statistics - November 2021VickyAulakh1
 
Annie Williams Real Estate Report - February 2020
Annie Williams Real Estate Report - February 2020Annie Williams Real Estate Report - February 2020
Annie Williams Real Estate Report - February 2020Jon Weaver
 
Annie Williams Real Estate Report - August 2021
Annie Williams Real Estate Report - August 2021Annie Williams Real Estate Report - August 2021
Annie Williams Real Estate Report - August 2021Annie Williams
 
VREB April 2021 Statistics Package
VREB April 2021 Statistics PackageVREB April 2021 Statistics Package
VREB April 2021 Statistics PackageVicky Aulakh
 
Annie Williams Real Estate Report - April 2020
Annie Williams Real Estate Report - April 2020Annie Williams Real Estate Report - April 2020
Annie Williams Real Estate Report - April 2020Jon Weaver
 
Victoria Real Estate Board June 2021 Statistics
Victoria Real Estate Board June 2021 StatisticsVictoria Real Estate Board June 2021 Statistics
Victoria Real Estate Board June 2021 StatisticsVicky Aulakh
 
Annie Williams Real Estate Report - December 2021
Annie Williams Real Estate Report - December 2021Annie Williams Real Estate Report - December 2021
Annie Williams Real Estate Report - December 2021Annie Williams
 
This Month in Real Estate for Canada - Feb. 2010
This Month in Real Estate for Canada - Feb. 2010This Month in Real Estate for Canada - Feb. 2010
This Month in Real Estate for Canada - Feb. 2010Keller Williams Careers
 
Orange County, CA Real Estate Market Report: October 2013
Orange County, CA Real Estate Market Report: October 2013Orange County, CA Real Estate Market Report: October 2013
Orange County, CA Real Estate Market Report: October 2013First Team Real Estate
 
Annie Williams Real Estate Report - February 2022
Annie Williams Real Estate Report - February 2022Annie Williams Real Estate Report - February 2022
Annie Williams Real Estate Report - February 2022Annie Williams
 
Annie Williams Real Estate Report - November 2020
Annie Williams Real Estate Report - November 2020Annie Williams Real Estate Report - November 2020
Annie Williams Real Estate Report - November 2020Jon Weaver
 
comScore 2010 US digital year in review
comScore 2010 US digital year in reviewcomScore 2010 US digital year in review
comScore 2010 US digital year in reviewAndrew Ballenthin
 

Mais procurados (20)

1 11 league of cities
1 11 league of cities1 11 league of cities
1 11 league of cities
 
SC Economic Update
SC Economic UpdateSC Economic Update
SC Economic Update
 
December 2021 Victoria Real Estate Board Statistics Package
December 2021 Victoria Real Estate Board Statistics Package December 2021 Victoria Real Estate Board Statistics Package
December 2021 Victoria Real Estate Board Statistics Package
 
Victoria Real Estate Board Statistics - November 2021
Victoria Real Estate Board Statistics - November 2021Victoria Real Estate Board Statistics - November 2021
Victoria Real Estate Board Statistics - November 2021
 
Annie Williams Real Estate Report - February 2020
Annie Williams Real Estate Report - February 2020Annie Williams Real Estate Report - February 2020
Annie Williams Real Estate Report - February 2020
 
Annie Williams Real Estate Report - August 2021
Annie Williams Real Estate Report - August 2021Annie Williams Real Estate Report - August 2021
Annie Williams Real Estate Report - August 2021
 
VREB April 2021 Statistics Package
VREB April 2021 Statistics PackageVREB April 2021 Statistics Package
VREB April 2021 Statistics Package
 
Annie Williams Real Estate Report - April 2020
Annie Williams Real Estate Report - April 2020Annie Williams Real Estate Report - April 2020
Annie Williams Real Estate Report - April 2020
 
Monthly Market Report - February 2018
Monthly Market Report - February 2018Monthly Market Report - February 2018
Monthly Market Report - February 2018
 
Victoria Real Estate Board June 2021 Statistics
Victoria Real Estate Board June 2021 StatisticsVictoria Real Estate Board June 2021 Statistics
Victoria Real Estate Board June 2021 Statistics
 
Wright report2 2012
Wright report2 2012Wright report2 2012
Wright report2 2012
 
Annie Williams Real Estate Report - December 2021
Annie Williams Real Estate Report - December 2021Annie Williams Real Estate Report - December 2021
Annie Williams Real Estate Report - December 2021
 
This Month in Real Estate for Canada - Feb. 2010
This Month in Real Estate for Canada - Feb. 2010This Month in Real Estate for Canada - Feb. 2010
This Month in Real Estate for Canada - Feb. 2010
 
Orange County, CA Real Estate Market Report: October 2013
Orange County, CA Real Estate Market Report: October 2013Orange County, CA Real Estate Market Report: October 2013
Orange County, CA Real Estate Market Report: October 2013
 
April Realtor Report
April Realtor ReportApril Realtor Report
April Realtor Report
 
Annie Williams Real Estate Report - February 2022
Annie Williams Real Estate Report - February 2022Annie Williams Real Estate Report - February 2022
Annie Williams Real Estate Report - February 2022
 
Annie Williams Real Estate Report - November 2020
Annie Williams Real Estate Report - November 2020Annie Williams Real Estate Report - November 2020
Annie Williams Real Estate Report - November 2020
 
Luxury Real Estate Report 2018 Pelton Team
Luxury Real Estate Report 2018 Pelton TeamLuxury Real Estate Report 2018 Pelton Team
Luxury Real Estate Report 2018 Pelton Team
 
Flip & Fund Summit 2016
Flip & Fund Summit 2016Flip & Fund Summit 2016
Flip & Fund Summit 2016
 
comScore 2010 US digital year in review
comScore 2010 US digital year in reviewcomScore 2010 US digital year in review
comScore 2010 US digital year in review
 

Semelhante a Real Estate Forecast Case-Shiller index

precio vivienda eeuu - marzo 2013
precio vivienda eeuu - marzo 2013precio vivienda eeuu - marzo 2013
precio vivienda eeuu - marzo 2013idealista/news
 
Lazard Investment Research: Update on the Improving Foundations of US House P...
Lazard Investment Research: Update on the Improving Foundations of US House P...Lazard Investment Research: Update on the Improving Foundations of US House P...
Lazard Investment Research: Update on the Improving Foundations of US House P...LazardLazard
 
Annie Williams Real Estate Report - March 2019
Annie Williams Real Estate Report - March 2019Annie Williams Real Estate Report - March 2019
Annie Williams Real Estate Report - March 2019Jon Weaver
 
San Francisco Market Focus November 2013
San Francisco Market Focus November 2013San Francisco Market Focus November 2013
San Francisco Market Focus November 2013Ronny Budiutama
 
San Francisco Market Focus October 2013
San Francisco Market Focus October 2013San Francisco Market Focus October 2013
San Francisco Market Focus October 2013Ronny Budiutama
 
Survey of Realtor Perspectives on the Housing Market Nationally
Survey of Realtor Perspectives on the Housing Market Nationally Survey of Realtor Perspectives on the Housing Market Nationally
Survey of Realtor Perspectives on the Housing Market Nationally Heather McClaren
 
Jumbo Loans Cheaper Than Conforming Loans - The Real Estate Report September/...
Jumbo Loans Cheaper Than Conforming Loans - The Real Estate Report September/...Jumbo Loans Cheaper Than Conforming Loans - The Real Estate Report September/...
Jumbo Loans Cheaper Than Conforming Loans - The Real Estate Report September/...AMSI, San Francisco
 
Annie Williams: Real Estate Market Trends Sep/Oct 2013
Annie Williams: Real Estate Market Trends Sep/Oct 2013Annie Williams: Real Estate Market Trends Sep/Oct 2013
Annie Williams: Real Estate Market Trends Sep/Oct 2013Jon Weaver
 
Zillow Sued Over Zestimates - June/July Real Estate Report
Zillow Sued Over Zestimates - June/July Real Estate ReportZillow Sued Over Zestimates - June/July Real Estate Report
Zillow Sued Over Zestimates - June/July Real Estate ReportAMSI, San Francisco
 
Southern California CRE Overview
Southern California CRE OverviewSouthern California CRE Overview
Southern California CRE OverviewRyan Slack
 
Major league investments october 1 2012 economic and investment update
Major league investments october 1 2012 economic and investment updateMajor league investments october 1 2012 economic and investment update
Major league investments october 1 2012 economic and investment updateFiner Wealth Management, Inc.
 
Annie Williams Real Estate Report Aug-Sept 2016
Annie Williams Real Estate Report Aug-Sept 2016Annie Williams Real Estate Report Aug-Sept 2016
Annie Williams Real Estate Report Aug-Sept 2016Jon Weaver
 
The Real Estate Report for the Las Vegas Metropolitan Area (February/March 2...
The Real Estate Report for the Las Vegas Metropolitan Area  (February/March 2...The Real Estate Report for the Las Vegas Metropolitan Area  (February/March 2...
The Real Estate Report for the Las Vegas Metropolitan Area (February/March 2...Mark Evan Israelitt (or IZZY)
 
Annie Williams Real Estate Report Nov-Dec 2016
Annie Williams Real Estate Report Nov-Dec 2016Annie Williams Real Estate Report Nov-Dec 2016
Annie Williams Real Estate Report Nov-Dec 2016Annie Williams
 
11 This Month In Real Estate November Canada
11 This Month In Real Estate   November   Canada11 This Month In Real Estate   November   Canada
11 This Month In Real Estate November CanadaKeller Williams Careers
 
Annie Williams Real Estate Market Trends Aug/Sep 2013
Annie Williams Real Estate Market Trends Aug/Sep 2013Annie Williams Real Estate Market Trends Aug/Sep 2013
Annie Williams Real Estate Market Trends Aug/Sep 2013Jon Weaver
 

Semelhante a Real Estate Forecast Case-Shiller index (20)

precio vivienda eeuu - marzo 2013
precio vivienda eeuu - marzo 2013precio vivienda eeuu - marzo 2013
precio vivienda eeuu - marzo 2013
 
Lazard Investment Research: Update on the Improving Foundations of US House P...
Lazard Investment Research: Update on the Improving Foundations of US House P...Lazard Investment Research: Update on the Improving Foundations of US House P...
Lazard Investment Research: Update on the Improving Foundations of US House P...
 
February 25 2013 economic update
February 25 2013 economic updateFebruary 25 2013 economic update
February 25 2013 economic update
 
Annie Williams Real Estate Report - March 2019
Annie Williams Real Estate Report - March 2019Annie Williams Real Estate Report - March 2019
Annie Williams Real Estate Report - March 2019
 
San Francisco Market Focus November 2013
San Francisco Market Focus November 2013San Francisco Market Focus November 2013
San Francisco Market Focus November 2013
 
San Francisco Market Focus October 2013
San Francisco Market Focus October 2013San Francisco Market Focus October 2013
San Francisco Market Focus October 2013
 
Survey of Realtor Perspectives on the Housing Market Nationally
Survey of Realtor Perspectives on the Housing Market Nationally Survey of Realtor Perspectives on the Housing Market Nationally
Survey of Realtor Perspectives on the Housing Market Nationally
 
Jumbo Loans Cheaper Than Conforming Loans - The Real Estate Report September/...
Jumbo Loans Cheaper Than Conforming Loans - The Real Estate Report September/...Jumbo Loans Cheaper Than Conforming Loans - The Real Estate Report September/...
Jumbo Loans Cheaper Than Conforming Loans - The Real Estate Report September/...
 
Annie Williams: Real Estate Market Trends Sep/Oct 2013
Annie Williams: Real Estate Market Trends Sep/Oct 2013Annie Williams: Real Estate Market Trends Sep/Oct 2013
Annie Williams: Real Estate Market Trends Sep/Oct 2013
 
Sr mag june2013stats.3-8
Sr mag june2013stats.3-8Sr mag june2013stats.3-8
Sr mag june2013stats.3-8
 
Zillow Sued Over Zestimates - June/July Real Estate Report
Zillow Sued Over Zestimates - June/July Real Estate ReportZillow Sued Over Zestimates - June/July Real Estate Report
Zillow Sued Over Zestimates - June/July Real Estate Report
 
Major league investments oct 15 2012
Major league investments oct 15 2012Major league investments oct 15 2012
Major league investments oct 15 2012
 
Southern California CRE Overview
Southern California CRE OverviewSouthern California CRE Overview
Southern California CRE Overview
 
Major league investments october 1 2012 economic and investment update
Major league investments october 1 2012 economic and investment updateMajor league investments october 1 2012 economic and investment update
Major league investments october 1 2012 economic and investment update
 
Annie Williams Real Estate Report Aug-Sept 2016
Annie Williams Real Estate Report Aug-Sept 2016Annie Williams Real Estate Report Aug-Sept 2016
Annie Williams Real Estate Report Aug-Sept 2016
 
The Real Estate Report for the Las Vegas Metropolitan Area (February/March 2...
The Real Estate Report for the Las Vegas Metropolitan Area  (February/March 2...The Real Estate Report for the Las Vegas Metropolitan Area  (February/March 2...
The Real Estate Report for the Las Vegas Metropolitan Area (February/March 2...
 
Annie Williams Real Estate Report Nov-Dec 2016
Annie Williams Real Estate Report Nov-Dec 2016Annie Williams Real Estate Report Nov-Dec 2016
Annie Williams Real Estate Report Nov-Dec 2016
 
Dec2005
Dec2005Dec2005
Dec2005
 
11 This Month In Real Estate November Canada
11 This Month In Real Estate   November   Canada11 This Month In Real Estate   November   Canada
11 This Month In Real Estate November Canada
 
Annie Williams Real Estate Market Trends Aug/Sep 2013
Annie Williams Real Estate Market Trends Aug/Sep 2013Annie Williams Real Estate Market Trends Aug/Sep 2013
Annie Williams Real Estate Market Trends Aug/Sep 2013
 

Mais de BEND OREGON REAL ESTATE

Mais de BEND OREGON REAL ESTATE (8)

Bend Oregon
Bend OregonBend Oregon
Bend Oregon
 
Real Estate 2014 Housing Outlook Wells Fargo
Real Estate 2014 Housing Outlook Wells FargoReal Estate 2014 Housing Outlook Wells Fargo
Real Estate 2014 Housing Outlook Wells Fargo
 
Oregon real estate agency
Oregon real estate agencyOregon real estate agency
Oregon real estate agency
 
Oregon Real Estate history
Oregon Real Estate historyOregon Real Estate history
Oregon Real Estate history
 
Bratton report, Central Oregon Real Estate, February 2014
Bratton report, Central Oregon Real Estate, February 2014Bratton report, Central Oregon Real Estate, February 2014
Bratton report, Central Oregon Real Estate, February 2014
 
Bend oregon trail map
Bend oregon trail mapBend oregon trail map
Bend oregon trail map
 
Real Estate trends in 2014
Real Estate trends in 2014Real Estate trends in 2014
Real Estate trends in 2014
 
Bend, Oregon real estate "Bratton Report" Jan. 2014
Bend, Oregon real estate "Bratton Report" Jan. 2014Bend, Oregon real estate "Bratton Report" Jan. 2014
Bend, Oregon real estate "Bratton Report" Jan. 2014
 

Último

What-are-the-latest-modular-wardrobe-designs.pdf
What-are-the-latest-modular-wardrobe-designs.pdfWhat-are-the-latest-modular-wardrobe-designs.pdf
What-are-the-latest-modular-wardrobe-designs.pdfKams Designer Zone
 
Dynamic Netsoft A leader In Property management Software
Dynamic Netsoft A leader In Property management SoftwareDynamic Netsoft A leader In Property management Software
Dynamic Netsoft A leader In Property management SoftwareDynamic Netsoft
 
What Is Biophilic Design .pdf
What Is Biophilic Design            .pdfWhat Is Biophilic Design            .pdf
What Is Biophilic Design .pdfyamunaNMH
 
Affordable and Quality Construction SVTN's Signature Blend of Cost-Efficiency...
Affordable and Quality Construction SVTN's Signature Blend of Cost-Efficiency...Affordable and Quality Construction SVTN's Signature Blend of Cost-Efficiency...
Affordable and Quality Construction SVTN's Signature Blend of Cost-Efficiency...AditiAlishetty
 
Shapoorji Spectra Sensorium Hinjewadi Pune | E-Brochure
Shapoorji Spectra Sensorium Hinjewadi Pune | E-BrochureShapoorji Spectra Sensorium Hinjewadi Pune | E-Brochure
Shapoorji Spectra Sensorium Hinjewadi Pune | E-BrochureOmanaConsulting
 
Pride Wonderland Dhanori Pune Brochure.pdf
Pride Wonderland Dhanori Pune Brochure.pdfPride Wonderland Dhanori Pune Brochure.pdf
Pride Wonderland Dhanori Pune Brochure.pdfabbu831446
 
Choose Noida's Leading Architect
Choose    Noida's    Leading   ArchitectChoose    Noida's    Leading   Architect
Choose Noida's Leading ArchitectMM Design Studio
 
MADHUGIRI FARM LAND BROCHURES (11)_compressed (1).pdf
MADHUGIRI FARM LAND BROCHURES (11)_compressed (1).pdfMADHUGIRI FARM LAND BROCHURES (11)_compressed (1).pdf
MADHUGIRI FARM LAND BROCHURES (11)_compressed (1).pdfknoxdigital1
 
Anandtara Iris Residences Mundhwa Pune Brochure.pdf
Anandtara Iris Residences Mundhwa Pune Brochure.pdfAnandtara Iris Residences Mundhwa Pune Brochure.pdf
Anandtara Iris Residences Mundhwa Pune Brochure.pdfabbu831446
 
Radiance Majestic Valasaravakkam Chennai.pdf
Radiance Majestic Valasaravakkam Chennai.pdfRadiance Majestic Valasaravakkam Chennai.pdf
Radiance Majestic Valasaravakkam Chennai.pdfashiyadav24
 
A Brief History of Intangibles in Ad Valorem Taxation.pdf
A Brief History of Intangibles in Ad Valorem Taxation.pdfA Brief History of Intangibles in Ad Valorem Taxation.pdf
A Brief History of Intangibles in Ad Valorem Taxation.pdfTim Wilmath
 
_Navigating Inflation's Influence on Commercial Real Estate (CRE) Investing I...
_Navigating Inflation's Influence on Commercial Real Estate (CRE) Investing I..._Navigating Inflation's Influence on Commercial Real Estate (CRE) Investing I...
_Navigating Inflation's Influence on Commercial Real Estate (CRE) Investing I...SyndicationPro, LLC
 
Sobha Aranya Sector 80 Gurgaon E- Brochure.pdf
Sobha Aranya Sector 80 Gurgaon E- Brochure.pdfSobha Aranya Sector 80 Gurgaon E- Brochure.pdf
Sobha Aranya Sector 80 Gurgaon E- Brochure.pdffaheemali990101
 
Ebullient Investments Limited specializes in Building contractor
Ebullient Investments Limited specializes in Building contractorEbullient Investments Limited specializes in Building contractor
Ebullient Investments Limited specializes in Building contractorEbullient Investments Limited
 
Prestige Sector 94 at Noida E Brochure.pdf
Prestige Sector 94 at Noida E Brochure.pdfPrestige Sector 94 at Noida E Brochure.pdf
Prestige Sector 94 at Noida E Brochure.pdfsarak0han45400
 
Ajmera Prive at Juhu, Mumbai E-Brochure.pdf
Ajmera Prive at Juhu, Mumbai  E-Brochure.pdfAjmera Prive at Juhu, Mumbai  E-Brochure.pdf
Ajmera Prive at Juhu, Mumbai E-Brochure.pdfManishSaxena95
 
8 Key Elements for Comfortable Farmland Living
8 Key Elements for Comfortable Farmland Living 8 Key Elements for Comfortable Farmland Living
8 Key Elements for Comfortable Farmland Living Farmland Bazaar
 
How to Navigate the Eviction Process in Pennsylvania: A Landlord's Guide
How to Navigate the Eviction Process in Pennsylvania: A Landlord's GuideHow to Navigate the Eviction Process in Pennsylvania: A Landlord's Guide
How to Navigate the Eviction Process in Pennsylvania: A Landlord's GuideezLandlordForms
 

Último (20)

What-are-the-latest-modular-wardrobe-designs.pdf
What-are-the-latest-modular-wardrobe-designs.pdfWhat-are-the-latest-modular-wardrobe-designs.pdf
What-are-the-latest-modular-wardrobe-designs.pdf
 
Dynamic Netsoft A leader In Property management Software
Dynamic Netsoft A leader In Property management SoftwareDynamic Netsoft A leader In Property management Software
Dynamic Netsoft A leader In Property management Software
 
What Is Biophilic Design .pdf
What Is Biophilic Design            .pdfWhat Is Biophilic Design            .pdf
What Is Biophilic Design .pdf
 
Affordable and Quality Construction SVTN's Signature Blend of Cost-Efficiency...
Affordable and Quality Construction SVTN's Signature Blend of Cost-Efficiency...Affordable and Quality Construction SVTN's Signature Blend of Cost-Efficiency...
Affordable and Quality Construction SVTN's Signature Blend of Cost-Efficiency...
 
Shapoorji Spectra Sensorium Hinjewadi Pune | E-Brochure
Shapoorji Spectra Sensorium Hinjewadi Pune | E-BrochureShapoorji Spectra Sensorium Hinjewadi Pune | E-Brochure
Shapoorji Spectra Sensorium Hinjewadi Pune | E-Brochure
 
Pride Wonderland Dhanori Pune Brochure.pdf
Pride Wonderland Dhanori Pune Brochure.pdfPride Wonderland Dhanori Pune Brochure.pdf
Pride Wonderland Dhanori Pune Brochure.pdf
 
young call girls in Lajpat Nagar,🔝 9953056974 🔝 escort Service
young call girls in Lajpat Nagar,🔝 9953056974 🔝 escort Serviceyoung call girls in Lajpat Nagar,🔝 9953056974 🔝 escort Service
young call girls in Lajpat Nagar,🔝 9953056974 🔝 escort Service
 
Choose Noida's Leading Architect
Choose    Noida's    Leading   ArchitectChoose    Noida's    Leading   Architect
Choose Noida's Leading Architect
 
MADHUGIRI FARM LAND BROCHURES (11)_compressed (1).pdf
MADHUGIRI FARM LAND BROCHURES (11)_compressed (1).pdfMADHUGIRI FARM LAND BROCHURES (11)_compressed (1).pdf
MADHUGIRI FARM LAND BROCHURES (11)_compressed (1).pdf
 
Anandtara Iris Residences Mundhwa Pune Brochure.pdf
Anandtara Iris Residences Mundhwa Pune Brochure.pdfAnandtara Iris Residences Mundhwa Pune Brochure.pdf
Anandtara Iris Residences Mundhwa Pune Brochure.pdf
 
Radiance Majestic Valasaravakkam Chennai.pdf
Radiance Majestic Valasaravakkam Chennai.pdfRadiance Majestic Valasaravakkam Chennai.pdf
Radiance Majestic Valasaravakkam Chennai.pdf
 
A Brief History of Intangibles in Ad Valorem Taxation.pdf
A Brief History of Intangibles in Ad Valorem Taxation.pdfA Brief History of Intangibles in Ad Valorem Taxation.pdf
A Brief History of Intangibles in Ad Valorem Taxation.pdf
 
_Navigating Inflation's Influence on Commercial Real Estate (CRE) Investing I...
_Navigating Inflation's Influence on Commercial Real Estate (CRE) Investing I..._Navigating Inflation's Influence on Commercial Real Estate (CRE) Investing I...
_Navigating Inflation's Influence on Commercial Real Estate (CRE) Investing I...
 
Sobha Aranya Sector 80 Gurgaon E- Brochure.pdf
Sobha Aranya Sector 80 Gurgaon E- Brochure.pdfSobha Aranya Sector 80 Gurgaon E- Brochure.pdf
Sobha Aranya Sector 80 Gurgaon E- Brochure.pdf
 
Call Girls in Mahavir Nagar whatsaap call US +919953056974
Call Girls in Mahavir Nagar  whatsaap call US  +919953056974Call Girls in Mahavir Nagar  whatsaap call US  +919953056974
Call Girls in Mahavir Nagar whatsaap call US +919953056974
 
Ebullient Investments Limited specializes in Building contractor
Ebullient Investments Limited specializes in Building contractorEbullient Investments Limited specializes in Building contractor
Ebullient Investments Limited specializes in Building contractor
 
Prestige Sector 94 at Noida E Brochure.pdf
Prestige Sector 94 at Noida E Brochure.pdfPrestige Sector 94 at Noida E Brochure.pdf
Prestige Sector 94 at Noida E Brochure.pdf
 
Ajmera Prive at Juhu, Mumbai E-Brochure.pdf
Ajmera Prive at Juhu, Mumbai  E-Brochure.pdfAjmera Prive at Juhu, Mumbai  E-Brochure.pdf
Ajmera Prive at Juhu, Mumbai E-Brochure.pdf
 
8 Key Elements for Comfortable Farmland Living
8 Key Elements for Comfortable Farmland Living 8 Key Elements for Comfortable Farmland Living
8 Key Elements for Comfortable Farmland Living
 
How to Navigate the Eviction Process in Pennsylvania: A Landlord's Guide
How to Navigate the Eviction Process in Pennsylvania: A Landlord's GuideHow to Navigate the Eviction Process in Pennsylvania: A Landlord's Guide
How to Navigate the Eviction Process in Pennsylvania: A Landlord's Guide
 

Real Estate Forecast Case-Shiller index

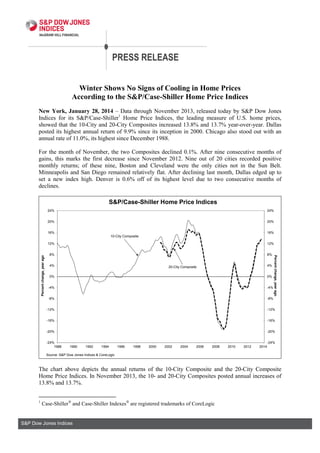
  • 1. PRESS RELEASE Winter Shows No Signs of Cooling in Home Prices According to the S&P/Case-Shiller Home Price Indices New York, January 28, 2014 – Data through November 2013, released today by S&P Dow Jones Indices for its S&P/Case-Shiller1 Home Price Indices, the leading measure of U.S. home prices, showed that the 10-City and 20-City Composites increased 13.8% and 13.7% year-over-year. Dallas posted its highest annual return of 9.9% since its inception in 2000. Chicago also stood out with an annual rate of 11.0%, its highest since December 1988. For the month of November, the two Composites declined 0.1%. After nine consecutive months of gains, this marks the first decrease since November 2012. Nine out of 20 cities recorded positive monthly returns; of these nine, Boston and Cleveland were the only cities not in the Sun Belt. Minneapolis and San Diego remained relatively flat. After declining last month, Dallas edged up to set a new index high. Denver is 0.6% off of its highest level due to two consecutive months of declines. S&P/Case-Shiller Home Price Indices 24% 24% 20% 20% 16% 16% 10-City Composite Percent change, year ago 12% 8% 8% 4% 4% 20-City Composite Percent change, year ago 12% 0% 0% -4% -4% -8% -8% -12% -12% -16% -16% -20% -20% -24% 1988 1990 1992 1994 1996 1998 2000 2002 2004 2006 2008 2010 2012 2014 -24% Source: S&P Dow Jones Indices & CoreLogic The chart above depicts the annual returns of the 10-City Composite and the 20-City Composite Home Price Indices. In November 2013, the 10- and 20-City Composites posted annual increases of 13.8% and 13.7%. 1 Case-Shiller and Case-Shiller Indexes are registered trademarks of CoreLogic S&P Dow Jones Indices
  • 2. S&P DOW JONES INDICES PRESS RELEASE “November was a good month for home prices,” says David M. Blitzer, Chairman of the Index Committee at S&P Dow Jones Indices. “Despite the slight decline, the 10-City and 20-City Composites showed their best November performance since 2005. Prices typically weaken as we move closer to the winter. Las Vegas, Los Angeles and Phoenix stand out as they have posted 20 or more consecutive monthly gains. “Beginning June 2012, we saw a steady rise in year-over-year increases. November continued that trend with another strong month although the rate of increase slowed. Looking at the year-over-year returns, the Sun Belt continues to push ahead with Atlanta, Las Vegas, Los Angeles, Miami, Phoenix, San Diego, San Francisco and Tampa taking eight of the top nine spots. Detroit continues to recover but remains the only city with prices below its 2000 level. “Home prices continue to rise despite last May’s jump in mortgage interest rates. Mortgage applications for purchase were up in recent weeks confirming home builders’ optimism shown by the NAHB survey. Combined with low inflation -- 1.5% in 2013 – home owners are enjoying real appreciation and rising equity values. While housing will make further contributions to the economy in 2014, the pace of price gains is likely to slow during the year.” S&P/Case-Shiller Home Price Indices 250 250 20-City Composite 225 225 200 200 175 175 150 150 10-City and 20-City Composites are both back to their mid-2004 levels 125 10-City Composite 125 100 100 75 75 50 1987 1989 1991 1993 1995 1997 1999 2001 2003 2005 2007 2009 2011 2013 50 Source: S&P Dow Jones Indices and CoreLogic The chart above shows the index levels for the 10-City and 20-City Composite Indices. As of November 2013, average home prices across the United States are back to their mid-2004 levels. Measured from their June/July 2006 peaks, the peak-to-current decline for both Composites is approximately 20%. The recovery from the March 2012 lows is 23.0% and 23.7% for the 10-City and 20-City Composites. S&P Dow Jones Indices
  • 3. S&P DOW JONES INDICES PRESS RELEASE Nine cities showed price increases from October to November. Miami took the lead with a gain of 1.4% and Las Vegas, the previous leader, followed at +0.6%. Chicago experienced the largest decline of 1.2%. Nine MSAs showed acceleration as measured by their monthly returns – Boston, Cleveland and San Francisco showed returns that were over 50 basis points higher in November compared to October. Last month after experiencing its first decline in 19 months, San Francisco rebounded to positive territory with a 0.4% gain in November. Las Vegas, Los Angeles, Miami, Phoenix and Tampa are the only cities that recorded positive gains for 12 or more consecutive months. Boston, Chicago, Cleveland, Dallas, Las Vegas, Miami, New York, Tampa and Washington were the nine cities to accelerate on an annual basis. Boston showed an annual rate of 9.8%, an improvement of 1.2 percentage points from last month. Cleveland and New York followed with November year-overyear returns of 6.0% compared to 4.9% for October. Despite the improvement, Cleveland and New York remain the two lowest ranked cities. More than 26 years of history for these data series are available, and can be accessed in full by going to www.homeprice.spdji.com. Additional content on the housing market may also be found on S&P Dow Jones Indices’ housing blog: www.housingviews.com. The table below summarizes the results for November 2013. The S&P/Case-Shiller Home Price Indices are revised for the 24 prior months, based on the receipt of additional source data. Novem ber 2013 Novem ber/October Metropolitan Area Level Change (%) Atlanta 113.37 -0.3% Boston 168.78 0.2% Charlotte 124.83 -0.6% Chicago 125.87 -1.2% Cleveland 106.91 0.3% Dallas 132.58 0.1% Denver 146.45 -0.2% Detroit 94.70 -0.1% Las Vegas 128.00 0.6% Los Angeles 214.79 0.1% Miami 176.02 1.4% Minneapolis 139.05 0.0% New York 172.54 -0.4% Phoenix 144.86 0.3% Portland 159.92 -0.3% San Diego 194.15 0.0% San Francisco 180.19 0.4% Seattle 160.17 -0.1% Tampa 154.70 0.2% Washington 203.71 -0.3% Composite-10 180.15 -0.1% Composite-20 165.80 -0.1% Source: S&P Dow Jones Indices and CoreLogic Data through November 2013 October/Septem ber Change (%) -0.2% -0.4% 0.6% -0.5% -0.2% -0.1% -0.4% 0.9% 1.2% 0.9% 1.1% 0.5% 0.0% 0.9% 0.2% 0.3% -0.2% -0.3% 0.1% -0.4% 0.2% 0.2% 1-Year Change (%) 18.5% 9.8% 8.7% 11.0% 6.0% 9.9% 8.9% 17.3% 27.3% 21.6% 16.5% 10.5% 6.0% 16.7% 12.5% 18.7% 23.2% 12.4% 15.7% 7.8% 13.8% 13.7% Since its launch in early 2006, the S&P/Case-Shiller Home Price Indices have published, and the markets have followed and reported on, the non-seasonally adjusted data set used in the headline indices. For analytical purposes, S&P Dow Jones Indices publishes a seasonally adjusted data set covered in the headline indices, as well as for the 17 of 20 markets with tiered price indices and the five condo markets that are tracked. S&P Dow Jones Indices
  • 4. S&P DOW JONES INDICES PRESS RELEASE A summary of the monthly changes using the seasonally adjusted (SA) and non-seasonally adjusted (NSA) data can be found in the table below. Novem ber/October Change (%) October/Septem ber Change (%) Metropolitan Area NSA SA NSA SA Atlanta -0.3% 1.6% -0.2% 1.9% Boston 0.2% 1.3% -0.4% 0.9% Charlotte -0.6% 0.5% 0.6% 1.2% Chicago -1.2% 0.8% -0.5% 0.8% Cleveland 0.3% 1.2% -0.2% 0.8% Dallas 0.1% 1.0% -0.1% 1.0% Denver -0.2% 0.5% -0.4% 0.3% Detroit -0.1% 1.3% 0.9% 1.9% Las Vegas 0.6% 1.2% 1.2% 1.0% Los Angeles 0.1% 0.8% 0.9% 1.5% Miami 1.4% 1.6% 1.1% 1.8% Minneapolis 0.0% 0.8% 0.5% 1.6% New York -0.4% 0.8% 0.0% 0.8% Phoenix 0.3% 0.4% 0.9% 1.1% Portland -0.3% 0.7% 0.2% 0.5% San Diego 0.0% 0.7% 0.3% 0.6% San Francisco 0.4% 1.3% -0.2% 0.7% Seattle -0.1% 0.4% -0.3% 0.4% Tampa 0.2% 1.1% 0.1% 0.9% Washington -0.3% 0.7% -0.4% 0.6% Composite-10 -0.1% 0.9% 0.2% 1.0% Composite-20 -0.1% 0.9% 0.2% 1.1% Source: S&P Dow Jones Indices and CoreLogic Data through November 2013 About S&P Dow Jones Indices S&P Dow Jones Indices LLC, a part of McGraw Hill Financial, is the world’s largest, global resource for index-based concepts, data and research. Home to iconic financial market indicators, such as the S&P 500® and the Dow Jones Industrial Average™, S&P Dow Jones Indices LLC has over 115 years of experience constructing innovative and transparent solutions that fulfill the needs of investors. More assets are invested in products based upon our indices than any other provider in the world. With over 830,000 indices covering a wide range of asset classes across the globe, S&P Dow Jones Indices LLC defines the way investors measure and trade the markets. To learn more about our company, please visit www.spdji.com. Standard & Poor’s and S&P are registered trademarks of Standard & Poor’s Financial Services LLC, a part of McGraw Hill Financial. Dow Jones is a registered trademark of Dow Jones Trademark Holdings LLC (“Dow Jones”). These trademarks have been licensed to S&P Dow Jones Indices LLC. It is not possible to invest directly in an index. S&P Dow Jones Indices LLC, Dow Jones, S&P and their respective affiliates (collectively “S&P Dow Jones Indices”) do not sponsor, endorse, sell, or promote any investment fund or other investment vehicle that is offered by third parties and that seeks to provide an investment return based on the performance of any index. This document does not constitute an offer of services in jurisdictions where S&P Dow Jones Indices does not have the necessary licenses. S&P Dow Jones Indices receives compensation in connection with licensing its indices to third parties. S&P Dow Jones Indices
  • 5. S&P DOW JONES INDICES PRESS RELEASE For more information: Dave Guarino Communications S&P Dow Jones Indices dave.guarino@spdji.com 212-438-1471 David Blitzer Managing Director and Chairman of the Index Committee S&P Dow Jones Indices david.blitzer@spdji.com 212-438-3907 917-376-1204 S&P Dow Jones Indices has introduced a new blog called HousingViews.com. This interactive blog delivers real-time commentary and analysis from across the Standard & Poor’s organization on a wide-range of topics impacting residential home prices, homebuilding and mortgage financing in the United States. Readers and viewers can visit the blog at www.housingviews.com, where feedback and commentary is certainly welcomed and encouraged. The S&P/Case-Shiller Home Price Indices are published on the last Tuesday of each month at 9:00 am ET. They are constructed to accurately track the price path of typical single-family homes located in each metropolitan area provided. Each index combines matched price pairs for thousands of individual houses from the available universe of arms-length sales data. The S&P/Case-Shiller National U.S. Home Price Index tracks the value of single-family housing within the United States. The index is a composite of single-family home price indices for the nine U.S. Census divisions and is calculated quarterly. The S&P/Case-Shiller Composite of 10 Home Price Index is a value-weighted average of the 10 original metro area indices. The S&P/Case-Shiller Composite of 20 Home Price Index is a value-weighted average of the 20 metro area indices. The indices have a base value of 100 in January 2000; thus, for example, a current index value of 150 translates to a 50% appreciation rate since January 2000 for a typical home located within the subject market. These indices are generated and published under agreements between S&P Dow Jones Indices and CoreLogic. The S&P/Case-Shiller Home Price Indices are produced by CoreLogic. In addition to the S&P/Case-Shiller Home Price Indices, CoreLogic also offers home price index sets covering thousands of zip codes, counties, metro areas, and state markets. The indices, published by S&P Dow Jones Indices, represent just a small subset of the broader data available through CoreLogic. For more information about S&P Dow Jones Indices, please visit www.spdji.com. S&P Dow Jones Indices