Why High-Throughput Screening Data quality is important: Ephrin pharmacophores and statistical correlations

Dispensing processes and the tools used have a profound influence on estimates of compound activity. Researchers have shown that leachates from plastic labware can profoundly affect biological assays. Data derived using disposable tip-based serial dilution and dispensing have shown a reduction in inhibition compared to acoustic dispensing with some compounds appearing hundreds of times more active with the acoustic process. Furthermore, there was no correlation of compound activity between the two processes. Studies of high-throughput screening (HTS) present confounding results that may influence scientific judgment and promote faulty decisions. Some researchers showed that differences in biological activity could vary by three or more orders of magnitude. What we address is how these errors may affect computational models and data manifested in external databases. We show that dispensing processes impact computational and statistical results.
Recomendados

Recomendados
Mais conteúdo relacionado
Mais procurados
Mais procurados (19)
Destaque
Semelhante a Why High-Throughput Screening Data quality is important: Ephrin pharmacophores and statistical correlations
Semelhante a Why High-Throughput Screening Data quality is important: Ephrin pharmacophores and statistical correlations (20)
Último
Último (20)
Why High-Throughput Screening Data quality is important: Ephrin pharmacophores and statistical correlations
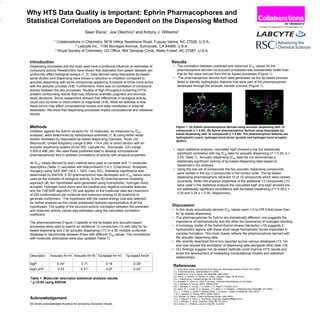
- 1. Introduction Dispensing processes and the tools used have a profound influence on estimates of compound activity. Researchers have shown that leachates from plastic labware can profoundly affect biological assays (1, 2). Data derived using disposable tip-based serial dilution and dispensing have shown a reduction in inhibition compared to acoustic dispensing with some compounds appearing hundreds of times more active with the acoustic process (3-6). Furthermore, there was no correlation of compound activity between the two processes. Studies of high-throughput screening (HTS) present confounding results that may influence scientific judgment and promote faulty decisions. Some researchers showed that differences in biological activity could vary by three or more orders of magnitude (3-6). What we address is how these errors may affect computational models and data manifested in external databases. We show that dispensing processes impact computational and statistical results. Methods Inhibition against the Ephrin receptor for 14 molecules, as measured by IC50 analyses, were determined by AstraZeneca scientists (7, 8) using either serial dilution facilitated by disposable tip-based dispensing (Genesis, Tecan Ltd, Weymouth, United Kingdom) (range 0.049- >14.4 µM) or direct dilution with an acoustic dispensing system (Echo 550, Labcyte Inc., Sunnyvale, CA) (range 0.002-0.486 µM). We used these published data to develop computational pharmacophores and to address correlations of activity with physical properties. All IC50 values derived by each method were used to correlate with 11 molecular descriptors (Table 1) calculated with MarvinSketch 5.9.3, (ChemAxon, Budapest, Hungary) using SAS JMP (v8.0.1, SAS, Cary, NC). Statistical significance was determined by ANOVA. A 3D pharmacophore was developed and IC50 values were used as the indicator of biological activity. In the 3D pharmacophore modeling approach (9), ten hypotheses were generated using hydrophobic, hydrogen bond acceptor, hydrogen bond donor and the positive and negative ionizable features, and the CAESAR algorithm (10) was applied to the molecular data set (maximum of 255 conformations per molecule and maximum energy of 20 kcal/mol) to generate conformers. The hypothesis with the lowest energy cost was selected for further analysis as this model possessed features representative of all the hypotheses. The quality of the structure-activity correlation between the predicted and observed activity values was estimated using the calculated correlation coefficient. The pharmacophores (Figure 1) specific to the tip-based and acoustic-based processes were used to search an additional 12 compounds (10 with data for tip- based dispensing and 2 for acoustic dispensing) (11) in a 3D multiple conformer database to discriminate between those with different IC50 values. The correlations with molecular descriptors were also updated (Table 1). Results Discussion • In this study acoustically-derived IC50 values were 1.5 to 276.5-fold lower than for tip-based dispensing. • The pharmacophores for Ephrin are dramatically different; one suggests the importance of hydrophobicity and the other the dominance of hydrogen bonding. • A homology model of the Ephrin:Ephrin kinase interaction (12) suggests 3 hydrophobic regions with these short-range hydrophobic forces implicated in complex formation. This most closely reflects the pharmacophore derived with the acoustic dispensing data. • We recently described the errors reported across various databases (13, 14) and now request the annotation of dispensing data alongside other data (15). • Our findings suggest non tip-based methods could improve HTS results and avoid the development of misleading computational models and statistical relationships. References 1.T. Spicer et al., poster presented at Drug Discovery Technology meeting, Boston, MA, (2005). 2.G. R. McDonald et al., Science 322, 917 (2008). 3.C. Belaiche, A. Holt, A. Saada, Clin Chem 55, 1883 (2009). 4.D. Harris, J. Olechno, S. Datwani, R. Ellson, J Biomol Screen 15, 86 (2010). 5.S. L. Matson et al., J Biomol Screen 14, 476 (2009). 6.J. Wingfield, D. Jones, R. Clark, P. Simpson, American Drug Discovery 3, 24 (2008). 7.B. C. Barlaam, R. Ducray, WIPO, 2009/010794. 8.B. C. Barlaam, R. Ducray, J. G. Kettle, U. S. Patent 7,718,653. 2010 9.S. Ekins, W. J. Crumb, R. D. Sarazan, J. H. Wikel, S. A. Wrighton, J Pharmacol Exp Thera 301, 427 (2002). 10.J. Li, T. Ehlers, J. Sutter, S. Varma-O'Brien, J. Kirchmair, J Chem Inf Model 47, 1923 (2007). 11.B. C. Barlaam, R. Ducray, WIPO, 2008/132505. 12.E. Myshkin, B. Wang, J Chem Inf Comput Sci 43, 1004 (2003). 13.A. J. Williams, S. Ekins, V. Tkachenko, Drug Disc Today In Press (2012). 14.A. J. Williams, S. Ekins, Drug Disc Today 16, 747 (2011). 15.S. Ekins, A. J. Williams, Lab on a Chip 10, 13 (2010). Acknowledgement SE kindly acknowledges Accelrys for providing Discovery Studio. Why HTS Data Quality is Important: Ephrin Pharmacophores and Statistical Correlations are Dependent on the Dispensing Method Sean Ekins1, Joe Olechno2 and Antony J. Williams3 1 Collaborations in Chemistry, 5616 Hilltop Needmore Road, Fuquay-Varina, NC 27526, U.S.A. 2 Labcyte Inc., 1190 Borregas Avenue, Sunnyvale, CA 94089, U.S.A. 3 Royal Society of Chemistry, US Office, 904 Tamaras Circle, Wake Forest, NC 27587, U.S.A. A. B. Descriptor Acoustic N=14 Acoustic N=16 Tip-based N=14 Tip-based N=24 logP 0.34* 0.11 0.16 0.39* logD pH7 0.23 0.31* 0.07 0.24* Table 1. Molecular descriptor statistical analysis results * p <0.05 using ANOVA • The correlation between predicted and observed IC50 values for the pharmacophore derived via acoustic processes was substantially better than that for the value derived from the tip based processes (Figure 1). • The pharmacophore derived from data generated via the tip-based process failed to identify hydrophobic features that were part of the pharmacophore developed through the acoustic transfer process (Figure 1). • Upon statistical analysis, calculated logP showed a low but statistically significant correlation with log IC50 data for acoustic dispensing (r2 = 0.34, p < 0.05, Table 1). Acoustic dispensing IC50 data did not demonstrate a statistically significant ranking of tip-based dispensing data based on Spearman’s rho analysis. • Using the test set of compounds the two acoustic dispensing compounds were ranked in the top 3 compounds in the correct order. The tip-based dispensing pharmacophore retrieved 10 of 12 compounds which were ranked incorrectly. When the physical properties of the additional 12 compounds (11) were used in the statistical analysis the calculated logP and logD showed low but statistically significant correlations with tip-based dispensing (r2= 0.39 p < 0.05 and 0.24 p < 0.05, respectively). Figure 1. (A) Ephrin pharmacophore derived using acoustic dispensing with 14 compounds (r = 0.92). (B) Ephrin pharmacophore derived using disposable tip- based dispensing with 14 compounds (r = 0.80). The pharmacophore features are hydrophobic (cyan), hydrogen bond donor (purple) and hydrogen bond acceptor (green). A B