The Holography Times, March 2012, Volume 6, Issue no 17
CETA_STUDY
1. 1
InTraCoM GmbH | Sigmaringerstr. 35 | 70567 Stuttgart (Möhringen) | Tel.: +49 (0) 711/ 797 328-0 | Fax: +49 (0) 711/ 797 328-29 | Internet: www.intracomgroup.de
Stuttgart, 8. Nov. 2016, Prof. Dipl.-Ing. Andreas Zagos (Management Partner InTraCoM GmbH)
Comprehensive Economic and Trade Agreement
between the EU and Canada (CETA)
POSSIBLE OVERPERFOMERS IN STOCK MARKET (STOXX600 INDEX) DERIVED FROM PATENT
ACTIVITIES OF THE COMPANIES
CETA in general
CETA will bring opportunities to different
branches in Canada and to the European Union.
Studies1
expect for Canada a boost in the field of
raw materials like ore mining (Gold, Silver, non-
ferrous, copper, nickel, lead etc.), in the food
market (beef, pork, soybean, fish, seafood, corn,
wheat etc.) while for Europe manufacturers of
pharmaceuticals, medicine, engines, vehicles,
machineries will receive benefits from CETA.
Canada is a strong trade and investment partner
for the European Union, a fact which is reflected
throughout the agreement. CETA should unleash
opportunities for both sides by liberalising
markets and enhancing cooperation while
reducing the costs of business transactions. Since
small and medium-sized enterprises (SMEs) are
more sensitive to transaction costs, CETA should
be of particular benefit for this business group2
.
1
RBC, The Comprehensive Economic and Trade Agreement,
October 2013
2
IN-DEPTH ANALYSIS Negotiations on the EU-Canada
Comprehensive Economic and Trade Agreement (CETA) concluded,
DIRECTORATE-GENERAL FOR EXTERNALPOLICIES POLICY
DEPARTMENT, 2014
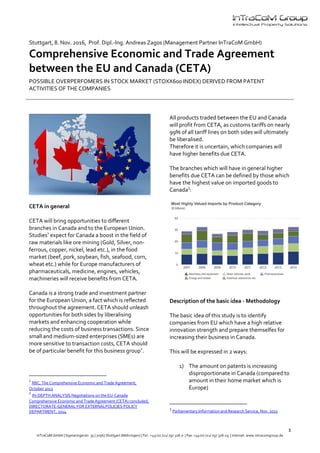
All products traded between the EU and Canada
will profit from CETA, as customs tariffs on nearly
99% of all tariff lines on both sides will ultimately
be liberalised.
Therefore it is uncertain, which companies will
have higher benefits due CETA.
The branches which will have in general higher
benefits due CETA can be defined by those which
have the highest value on imported goods to
Canada3
:
Description of the basic idea - Methodology
The basic idea of this study is to identify
companies from EU which have a high relative
innovation strength and prepare themselfes for
increasing their business in Canada.
This will be expressed in 2 ways:
1) The amount on patents is increasing
disproportionate in Canada (compared to
amount in their home market which is
Europe)
3
Parliamentary Information and Research Service, Nov. 2015
2. P. 2
2) The IP value shows a significant increase
(applications and grants) in Canada
(compared to the IP value in their home
market which is Europe)
Both indicators are expressing a self assessment
of the companies and their expectations for the
Canadian market. This means that they have
either a relevant a market share for their products
in Canada and expect to increase their business or
they are still increasing their activities.
The IP value is determined by an innovative
approach of InTraCoM which is based on a
pattern recognition algorithm on bibliometric
data from patents. The methodology is temper
proof in over 100 patent valuation projects with
commercial clients as well as legal authorities and
has a pending patent4
in Europe and USA.
Samples of the rating – Healthcare companies
From Stoxx600 index the life science companies
were analysed regarding the change of patent
applications and grants for Europe and for
Canada, and the change of the value of those
patents in Europe and for Canada.
Further the change of the total IP value divided
through the total assets was determined in order
to identify an increasing or decreasing patent
activity.
The analysis was performed for the years 2010 to
2016.
The results of the most beneficiary European
companies are shown in the graph at the next
page.
Analysis of European companies:
From the 33 stocks in total only 7 have clear
advantages for the Canadian market:
ESSILOR INTERNATIONAL
FRESENIUS MEDICAL CARE
GETINGE AB
GRIFOLS
4
EP2923296A1, US20160004998A1
IPSEN PHARMA
NOVOZYMES
QIAGEN
STADA ARZNEIMITTEL
They are clear overperforming in the amount on
patents for Canada compared with the activities
in their home market which is Europe, and the IP
value is as well overperforming. Further the total
IP value divided through the total assets is rising,
this means that the overall patent activities of the
company are increasing.
The clear underperformers derived from their
own IP statement (patent activity in CA) for the
Canadian market are:
COLOPLAST B
GN STORE NORD
LONZA
MERCK
NOVO NORDISK B
ORION OYJ
SONOVA
SWEDISH ORPHAN BIOVITRUM
These companies have decreasing amount on
patents in Canada and the IP values are
decreasing as well.
Conclusion
Based on the above analysis the complete STOXX
600 Index could be analysed and a financial
product derived out of it. The different sectors
from the Index could be weighted differently, in
analogy to the expected impact from the CETA
agreement and from the amount on imports for
the different goods in Canada.
About the Author
Prof. Dipl.-Ing. Andreas Zagos is founder and
management Partner of the
Stuttgart based InTraCoM GmbH (Germany) and
internationally recognized patent valuation
expert. He was participating in the first standard
for patent valuation and is doing research in
patent valuation for more than 16 years. He is
guest professor at the Technical University of
Cluj-Napoca in the field of innovation
management.
3. P. 3
InTraCoM GmbH is a patent valuation boutique
with a long list of patent valuation customers.
InTraCoM GmbH is performing patent valuations
for M&A, patent transactions, licensing value
determination, internal balancing purposes, sale
and lease back, transfer pricing and many more
valuation scopes. Their customers are
international big blue chip companies,
governmentals, banks, official authorities, SMEs,
Universities as well as big research organisations.
InTraCoM Group is supported by different
international partners offering patent
Valuation -specific data and business information.
Within these partnerships also software and
patent valuation-specific data can be offered
based the InTraCoM-patent valuation
methodology. With all these approaches, patent
values can be determined within unbeatable
precision, time and cost.
Timeframe for the analysis are the years 2010 to 2016
No. Patents
(EU+CA)
IP value/total
assets change in %
No. Patents EU
change in %
No. Patents CA
change in %
IP VALUE EU
change in %
IP value CA
change in %
STADA ARZNEIMITTEL 75 861% 39% 600% 343% 2182%
IPSEN PHARMA 162 27% 27% 15% 168% 361%
FRESENIUS MEDICAL CARE 1304 109% 97% 95% 109% 359%
GRIFOLS 238 100% 75% 126% 93% 329%
NOVOZYMES 1480 0% 27% 50% 45% 289%
QIAGEN 512 95% 37% 29% 122% 243%
ESSILOR INTERNATIONAL 1473 0% 27% 24% 47% 218%
GETINGE AB 531 86% 23% 29% 67% 171%
INDIVIOR 20 473% 183% 200% 2514% 235%
GENMAB 75 0% 36% 10% 339% 113%
CHR HANSEN HLDG 179 96% 34% 25% 70% 73%
GERRESHEIMER 86 158% 177% -25% 244% 569%
SMITH & NEPHEW 988 0% 40% -2% 64% 152%
ACTELION 294 0% 21% -7% 136% 176%
ROCHE HLDG P 10522 0% 40% -4% 60% 74%
NOVARTIS 6400 0% -20% -14% -9% 69%
UCB 572 0% -32% -24% 1% 58%
ELEKTA B 298 -33% 8% -45% -4% 57%
FRESENIUS 507 -11% 21% -3% 13% 55%
ASTRAZENECA 2290 0% -49% -35% -26% 52%
STRAUMANN 225 0% 27% -65% 33% 52%
BTG 210 0% -45% -33% -33% 50%
GLAXOSMITHKLINE 3026 0% -26% -12% -12% 40%
H. LUNDBECK 342 0% -48% -41% -11% 16%
SANOFI 5556 0% -5% -9% -31% 15%
LONZA 516 0% -32% -45% -42% -1%
NOVO NORDISK B 930 0% -22% -36% 3% -1%
ORION OYJ 196 0% -43% -30% -28% -2%
SWEDISH ORPHAN BIOVITRUM 59 0% -77% -57% -79% -5%
SONOVA 510 0% 32% -51% 28% -5%
MERCK 4182 0% -30% -64% -31% -9%
COLOPLAST B 487 0% 9% -85% 12% -50%
GN STORE NORD 296 144% 132% -75% 113% -58%
Overperforming in IP value CA and number of patent families in CA increasing
Fair performance in IP value CA and number of patent families in CA increasing
Overperforming in IP value CA but number of patent families in CA decreasing
IP value in CA decreasing and number of patent families in CA decreasing