SlideShare uma empresa Scribd logo
1 de 30
Baixar para ler offline
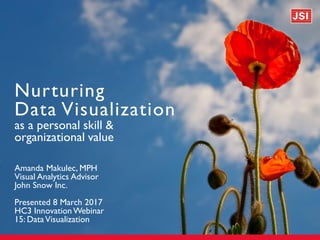
Nurturing
Data Visualization
as a personal skill &
organizational value
Amanda Makulec, MPH
Visual Analytics Advisor
John Snow Inc.
Presented 8 March 2017
HC3 InnovationWebinar
15: DataVisualization
M y s t o r y
( a n d w h a t I ’ve l e a r n e d )
O r g a n i z a t i o n s h ave
c o m p l e x e c o s y s t e m s .
T h e Tre e s
(Building your own skills.)
BuildingYour Skills
READFlowingData.com
InformationisBeautiful.net
thefunctionalart.com
PolicyViz.com
AnnKEmery.com
EvergreenData.com
StorytellingwithData.com
For inspiration For instruction
Learn from experts who
have spent years exploring
information design.
BuildingYour Skills
CRITI
QUE
Look at examples and
think about what works,
what doesn’t, and why.
1980 2008
BuildingYour Skills
PRAC
TICE
Find opportunities to
practice your design skills
at work or for fun.
BuildingYour Skills
SHARE
Join communities
where you can connect with data
viz enthusiasts working in different
areas of information design.
T h e Fo re s t
(Creating change where you work)
Show rather than tell.
0 200000 400000 600000 800000
Washington DC
Los Angeles, CA
New York, NY
Chicago, IL
Boston, MA
Mean Estimate
Mean Estimate
Data Visualization Hub
Find the people who are
interested…
…and connect them in a
multidisciplinary community.
Mobilize an internal network.
Data
Developers
CommsDesign
Adapted from Kotter (2012)
Find your champions and nurture them.
Research
Technology
Design
Communication
Adapted from: https://onthinktanks.org/articles/visualising-data-both-a-science-and-an-art/
Look for people with
different perspectives
on information design.
Heavy
lift
Light
touch
Quick
impact
Sustained
change
Sustained ChangeTakes Time
Invite someone
whose data viz
work you admire
to do a lunch
presentation
Heavy
lift
Light
touch
Quick
impact
Sustained
change
Sustained ChangeTakes Time
Bring in an
external
facilitator for
an all day viz
workshop
Invite someone
whose data viz
work you
admire to do a
lunch
presentation
Heavy
lift
Light
touch
Quick
impact
Sustained
change
Sustained ChangeTakes Time
Bring in an
external
facilitator for
an all day viz
workshop
Start an internal
data viz listserv
& send monthly
resources
Invite someone
whose data viz
work you
admire to do a
lunch
presentation
Heavy
lift
Light
touch
Quick
impact
Sustained
change
Sustained ChangeTakes Time
Bring in an
external
facilitator for
an all day viz
workshop
Identify a list of
internal viz
experts who can
help project
teams
Start an internal
data viz listserv
& send monthly
resources
Invite someone
whose data viz
work you
admire to do a
lunch
presentation
Heavy
lift
Light
touch
Quick
impact
Sustained
change
Sustained ChangeTakes Time
Bring in an
external
facilitator for
an all day viz
workshop
Identify a list of
internal viz
experts who
can help
project teams
Start an internal
data viz listserv
& send monthly
resources
Hire specifically for
visualization design
skills in your MERL,
comms, and
dev teams
Invite someone
whose data viz
work you
admire to do a
lunch
presentation
A T h r i v i n g E c o s y s t e m
5Tips for Success in DataViz Collaborations
Speak the same
language.
conceptual data driven
declarative
exploratory
idea illustration everyday data viz
idea generation visual discovery
Matrix credit: Harvard Business Review’s Good Charts
Ask lots of
questions.
Measure twice,
cut once.
Program
start
Program
end
TIME
With program
Without program
Start thinking about
WHO
WHAT
HOW
at the start
Program
impact
Understand your
audience.
Put yourself
in their shoes.
Not just
job titles
stakeholder groups
organization names
Focus on the human side of
your data viz audience.
Sketch first.
Be realistic
with deadlines.
(especially when you’re first
honing your design skills)
Amanda Makulec, MPH
John Snow Inc.
Visual Analytics Advisor
@abmakulec

Mais conteúdo relacionado

Mais procurados

Designing Data Visualizations to Strengthen Health Systems
Designing Data Visualizations to Strengthen Health SystemsDesigning Data Visualizations to Strengthen Health Systems
Designing Data Visualizations to Strengthen Health SystemsAmanda Makulec
 
Visualizations with Empathy: Developing Audience Personas
Visualizations with Empathy: Developing Audience PersonasVisualizations with Empathy: Developing Audience Personas
Visualizations with Empathy: Developing Audience PersonasAmanda Makulec
 
Creating Functional Art in Excel
Creating Functional Art in ExcelCreating Functional Art in Excel
Creating Functional Art in ExcelAmanda Makulec
 
August Designstorm: Alternative Reporting Formats
August Designstorm: Alternative Reporting FormatsAugust Designstorm: Alternative Reporting Formats
August Designstorm: Alternative Reporting FormatsAmanda Makulec
 
Alternative Reporting Formats
Alternative Reporting FormatsAlternative Reporting Formats
Alternative Reporting FormatsAmanda Makulec
 
Data Visualization: Impact, Intrigue, Value Add for APLIC 2014
Data Visualization: Impact, Intrigue, Value Add for APLIC 2014Data Visualization: Impact, Intrigue, Value Add for APLIC 2014
Data Visualization: Impact, Intrigue, Value Add for APLIC 2014Amanda Makulec
 
Data Visualization for the Public Sector
Data Visualization for the Public SectorData Visualization for the Public Sector
Data Visualization for the Public SectorJESS3
 
Data Visualization Design Best Practices Workshop
Data Visualization Design Best Practices WorkshopData Visualization Design Best Practices Workshop
Data Visualization Design Best Practices WorkshopJSI
 
Real-life Data Visualization - guest lecture for McGill INSY-442
Real-life Data Visualization - guest lecture for McGill INSY-442Real-life Data Visualization - guest lecture for McGill INSY-442
Real-life Data Visualization - guest lecture for McGill INSY-442Mike Deutsch
 
Techniques of Data Visualization for Data & Business Analytics
Techniques of Data Visualization for Data & Business AnalyticsTechniques of Data Visualization for Data & Business Analytics
Techniques of Data Visualization for Data & Business AnalyticsMercy Akinseinde
 
Data science and the art of persuasion
Data science and the art of persuasionData science and the art of persuasion
Data science and the art of persuasionAlex Clapson
 
Data Visualization - What can you see? #baai17
Data Visualization - What can you see? #baai17Data Visualization - What can you see? #baai17
Data Visualization - What can you see? #baai17Eugene O'Loughlin
 
The 8 Hats of Data Visualisation
The 8 Hats of Data VisualisationThe 8 Hats of Data Visualisation
The 8 Hats of Data VisualisationAndy Kirk
 
You Can Hack That: How to Use Hackathons to Solve Your Toughest Challenges
You Can Hack That: How to Use Hackathons to Solve Your Toughest ChallengesYou Can Hack That: How to Use Hackathons to Solve Your Toughest Challenges
You Can Hack That: How to Use Hackathons to Solve Your Toughest ChallengesBooz Allen Hamilton
 
Is big data handicapped by "design"? Seven design principles for communicatin...
Is big data handicapped by "design"? Seven design principles for communicatin...Is big data handicapped by "design"? Seven design principles for communicatin...
Is big data handicapped by "design"? Seven design principles for communicatin...Zach Gemignani
 
"Introduction to Data Visualization" Workshop for General Assembly by Hunter ...
"Introduction to Data Visualization" Workshop for General Assembly by Hunter ..."Introduction to Data Visualization" Workshop for General Assembly by Hunter ...
"Introduction to Data Visualization" Workshop for General Assembly by Hunter ...Hunter Whitney
 
Design Thinking for Data Science #StrataHadoop
Design Thinking for Data Science #StrataHadoopDesign Thinking for Data Science #StrataHadoop
Design Thinking for Data Science #StrataHadoopIntuit Inc.
 

Mais procurados (20)

Designing Data Visualizations to Strengthen Health Systems
Designing Data Visualizations to Strengthen Health SystemsDesigning Data Visualizations to Strengthen Health Systems
Designing Data Visualizations to Strengthen Health Systems
 
Visualizations with Empathy: Developing Audience Personas
Visualizations with Empathy: Developing Audience PersonasVisualizations with Empathy: Developing Audience Personas
Visualizations with Empathy: Developing Audience Personas
 
Creating Functional Art in Excel
Creating Functional Art in ExcelCreating Functional Art in Excel
Creating Functional Art in Excel
 
August Designstorm: Alternative Reporting Formats
August Designstorm: Alternative Reporting FormatsAugust Designstorm: Alternative Reporting Formats
August Designstorm: Alternative Reporting Formats
 
Alternative Reporting Formats
Alternative Reporting FormatsAlternative Reporting Formats
Alternative Reporting Formats
 
Data Visualization: Impact, Intrigue, Value Add for APLIC 2014
Data Visualization: Impact, Intrigue, Value Add for APLIC 2014Data Visualization: Impact, Intrigue, Value Add for APLIC 2014
Data Visualization: Impact, Intrigue, Value Add for APLIC 2014
 
Data+Design
Data+DesignData+Design
Data+Design
 
Design for Delight
Design for DelightDesign for Delight
Design for Delight
 
Data Visualization for the Public Sector
Data Visualization for the Public SectorData Visualization for the Public Sector
Data Visualization for the Public Sector
 
Data Visualization Design Best Practices Workshop
Data Visualization Design Best Practices WorkshopData Visualization Design Best Practices Workshop
Data Visualization Design Best Practices Workshop
 
Real-life Data Visualization - guest lecture for McGill INSY-442
Real-life Data Visualization - guest lecture for McGill INSY-442Real-life Data Visualization - guest lecture for McGill INSY-442
Real-life Data Visualization - guest lecture for McGill INSY-442
 
Techniques of Data Visualization for Data & Business Analytics
Techniques of Data Visualization for Data & Business AnalyticsTechniques of Data Visualization for Data & Business Analytics
Techniques of Data Visualization for Data & Business Analytics
 
5thingsyourspreadsheetcantdo eng
5thingsyourspreadsheetcantdo eng5thingsyourspreadsheetcantdo eng
5thingsyourspreadsheetcantdo eng
 
Data science and the art of persuasion
Data science and the art of persuasionData science and the art of persuasion
Data science and the art of persuasion
 
Data Visualization - What can you see? #baai17
Data Visualization - What can you see? #baai17Data Visualization - What can you see? #baai17
Data Visualization - What can you see? #baai17
 
The 8 Hats of Data Visualisation
The 8 Hats of Data VisualisationThe 8 Hats of Data Visualisation
The 8 Hats of Data Visualisation
 
You Can Hack That: How to Use Hackathons to Solve Your Toughest Challenges
You Can Hack That: How to Use Hackathons to Solve Your Toughest ChallengesYou Can Hack That: How to Use Hackathons to Solve Your Toughest Challenges
You Can Hack That: How to Use Hackathons to Solve Your Toughest Challenges
 
Is big data handicapped by "design"? Seven design principles for communicatin...
Is big data handicapped by "design"? Seven design principles for communicatin...Is big data handicapped by "design"? Seven design principles for communicatin...
Is big data handicapped by "design"? Seven design principles for communicatin...
 
"Introduction to Data Visualization" Workshop for General Assembly by Hunter ...
"Introduction to Data Visualization" Workshop for General Assembly by Hunter ..."Introduction to Data Visualization" Workshop for General Assembly by Hunter ...
"Introduction to Data Visualization" Workshop for General Assembly by Hunter ...
 
Design Thinking for Data Science #StrataHadoop
Design Thinking for Data Science #StrataHadoopDesign Thinking for Data Science #StrataHadoop
Design Thinking for Data Science #StrataHadoop
 

Destaque

The Be-All, End-All List of Small Business Tax Deductions
The Be-All, End-All List of Small Business Tax DeductionsThe Be-All, End-All List of Small Business Tax Deductions
The Be-All, End-All List of Small Business Tax DeductionsWagepoint
 
10 Things You Didn’t Know About Mobile Email from Litmus & HubSpot
 10 Things You Didn’t Know About Mobile Email from Litmus & HubSpot 10 Things You Didn’t Know About Mobile Email from Litmus & HubSpot
10 Things You Didn’t Know About Mobile Email from Litmus & HubSpotHubSpot
 
The Future of Everything
The Future of EverythingThe Future of Everything
The Future of EverythingCharbel Zeaiter
 
25 Discovery Call Questions
25 Discovery Call Questions25 Discovery Call Questions
25 Discovery Call QuestionsHubSpot
 
Modern Prospecting Techniques for Connecting with Prospects (from Sales Hacke...
Modern Prospecting Techniques for Connecting with Prospects (from Sales Hacke...Modern Prospecting Techniques for Connecting with Prospects (from Sales Hacke...
Modern Prospecting Techniques for Connecting with Prospects (from Sales Hacke...HubSpot
 
Behind the Scenes: Launching HubSpot Tokyo
Behind the Scenes: Launching HubSpot TokyoBehind the Scenes: Launching HubSpot Tokyo
Behind the Scenes: Launching HubSpot TokyoHubSpot
 
HubSpot Diversity Data 2016
HubSpot Diversity Data 2016HubSpot Diversity Data 2016
HubSpot Diversity Data 2016HubSpot
 
Why People Block Ads (And What It Means for Marketers and Advertisers) [New R...
Why People Block Ads (And What It Means for Marketers and Advertisers) [New R...Why People Block Ads (And What It Means for Marketers and Advertisers) [New R...
Why People Block Ads (And What It Means for Marketers and Advertisers) [New R...HubSpot
 
Chart Makeover: A Women's Nutrition Bar Chart
Chart Makeover: A Women's Nutrition Bar ChartChart Makeover: A Women's Nutrition Bar Chart
Chart Makeover: A Women's Nutrition Bar ChartAmanda Makulec
 
Designing Usage Dashboards for mHealth Program Monitoring
Designing Usage Dashboards for mHealth Program MonitoringDesigning Usage Dashboards for mHealth Program Monitoring
Designing Usage Dashboards for mHealth Program MonitoringAmanda Makulec
 

Destaque (10)

The Be-All, End-All List of Small Business Tax Deductions
The Be-All, End-All List of Small Business Tax DeductionsThe Be-All, End-All List of Small Business Tax Deductions
The Be-All, End-All List of Small Business Tax Deductions
 
10 Things You Didn’t Know About Mobile Email from Litmus & HubSpot
 10 Things You Didn’t Know About Mobile Email from Litmus & HubSpot 10 Things You Didn’t Know About Mobile Email from Litmus & HubSpot
10 Things You Didn’t Know About Mobile Email from Litmus & HubSpot
 
The Future of Everything
The Future of EverythingThe Future of Everything
The Future of Everything
 
25 Discovery Call Questions
25 Discovery Call Questions25 Discovery Call Questions
25 Discovery Call Questions
 
Modern Prospecting Techniques for Connecting with Prospects (from Sales Hacke...
Modern Prospecting Techniques for Connecting with Prospects (from Sales Hacke...Modern Prospecting Techniques for Connecting with Prospects (from Sales Hacke...
Modern Prospecting Techniques for Connecting with Prospects (from Sales Hacke...
 
Behind the Scenes: Launching HubSpot Tokyo
Behind the Scenes: Launching HubSpot TokyoBehind the Scenes: Launching HubSpot Tokyo
Behind the Scenes: Launching HubSpot Tokyo
 
HubSpot Diversity Data 2016
HubSpot Diversity Data 2016HubSpot Diversity Data 2016
HubSpot Diversity Data 2016
 
Why People Block Ads (And What It Means for Marketers and Advertisers) [New R...
Why People Block Ads (And What It Means for Marketers and Advertisers) [New R...Why People Block Ads (And What It Means for Marketers and Advertisers) [New R...
Why People Block Ads (And What It Means for Marketers and Advertisers) [New R...
 
Chart Makeover: A Women's Nutrition Bar Chart
Chart Makeover: A Women's Nutrition Bar ChartChart Makeover: A Women's Nutrition Bar Chart
Chart Makeover: A Women's Nutrition Bar Chart
 
Designing Usage Dashboards for mHealth Program Monitoring
Designing Usage Dashboards for mHealth Program MonitoringDesigning Usage Dashboards for mHealth Program Monitoring
Designing Usage Dashboards for mHealth Program Monitoring
 

Semelhante a Nurturing Data Visualization

Enterprise Design Introduction Webinar Season 5.pdf
Enterprise Design Introduction Webinar Season 5.pdfEnterprise Design Introduction Webinar Season 5.pdf
Enterprise Design Introduction Webinar Season 5.pdfIntersection Group
 
How Organizations Can Prepare for Microsoft Viva
How Organizations Can Prepare for Microsoft VivaHow Organizations Can Prepare for Microsoft Viva
How Organizations Can Prepare for Microsoft VivaChristian Buckley
 
WebVisions - Explore the Future of the Web
WebVisions - Explore the Future of the WebWebVisions - Explore the Future of the Web
WebVisions - Explore the Future of the WebWebVisions
 
Separating Myth from Truth in Data Visualisation
Separating Myth from Truth in Data VisualisationSeparating Myth from Truth in Data Visualisation
Separating Myth from Truth in Data VisualisationAndy Kirk
 
Intranet design strategies2011 (nx power lite)
Intranet design strategies2011 (nx power lite)Intranet design strategies2011 (nx power lite)
Intranet design strategies2011 (nx power lite)Sara Durning, MDes
 
UX South Africa 2014 - Keynote
UX South Africa 2014 - KeynoteUX South Africa 2014 - Keynote
UX South Africa 2014 - KeynotePhil Barrett
 
Artoza Presentation : Dark Color Version
Artoza Presentation : Dark Color VersionArtoza Presentation : Dark Color Version
Artoza Presentation : Dark Color VersionMadlis
 
Artoza Presentation : Light Color Version
Artoza Presentation : Light Color VersionArtoza Presentation : Light Color Version
Artoza Presentation : Light Color VersionMadlis
 
Understanding What’s Possible: Getting Business Value from Big Data Quickly
Understanding What’s Possible: Getting Business Value from Big Data QuicklyUnderstanding What’s Possible: Getting Business Value from Big Data Quickly
Understanding What’s Possible: Getting Business Value from Big Data QuicklyInside Analysis
 
Five Hacks to Weave Constituent Experience Into Your Organization
Five Hacks to Weave Constituent Experience Into Your OrganizationFive Hacks to Weave Constituent Experience Into Your Organization
Five Hacks to Weave Constituent Experience Into Your OrganizationCommunity IT Innovators
 
Intranet Design Strategies
Intranet Design StrategiesIntranet Design Strategies
Intranet Design StrategiesDelvinia
 
How Work Changes With AI & Copilots Slide Deck
How Work Changes With AI & Copilots Slide DeckHow Work Changes With AI & Copilots Slide Deck
How Work Changes With AI & Copilots Slide Deck2toLead Limited
 
Software Engineer Neural language processin.pptx
Software Engineer  Neural language processin.pptxSoftware Engineer  Neural language processin.pptx
Software Engineer Neural language processin.pptxhanadimzlout123
 
Rapid Product Design in the Wild, Agile 2013
Rapid Product Design in the Wild, Agile 2013Rapid Product Design in the Wild, Agile 2013
Rapid Product Design in the Wild, Agile 2013Michele Ide-Smith
 
Data visualisation and storytelling workshop from Data Commune
Data visualisation and storytelling workshop from Data CommuneData visualisation and storytelling workshop from Data Commune
Data visualisation and storytelling workshop from Data CommuneNeil Montes
 

Semelhante a Nurturing Data Visualization (20)

Enterprise Design Introduction Webinar Season 5.pdf
Enterprise Design Introduction Webinar Season 5.pdfEnterprise Design Introduction Webinar Season 5.pdf
Enterprise Design Introduction Webinar Season 5.pdf
 
How Organizations Can Prepare for Microsoft Viva
How Organizations Can Prepare for Microsoft VivaHow Organizations Can Prepare for Microsoft Viva
How Organizations Can Prepare for Microsoft Viva
 
UXLondon 2016 - Notes
UXLondon 2016 - NotesUXLondon 2016 - Notes
UXLondon 2016 - Notes
 
WebVisions - Explore the Future of the Web
WebVisions - Explore the Future of the WebWebVisions - Explore the Future of the Web
WebVisions - Explore the Future of the Web
 
Separating Myth from Truth in Data Visualisation
Separating Myth from Truth in Data VisualisationSeparating Myth from Truth in Data Visualisation
Separating Myth from Truth in Data Visualisation
 
Intranet design strategies2011 (nx power lite)
Intranet design strategies2011 (nx power lite)Intranet design strategies2011 (nx power lite)
Intranet design strategies2011 (nx power lite)
 
UX South Africa 2014 - Keynote
UX South Africa 2014 - KeynoteUX South Africa 2014 - Keynote
UX South Africa 2014 - Keynote
 
2014 Technical Communication Conference Program
2014 Technical Communication Conference Program2014 Technical Communication Conference Program
2014 Technical Communication Conference Program
 
Artoza Presentation : Dark Color Version
Artoza Presentation : Dark Color VersionArtoza Presentation : Dark Color Version
Artoza Presentation : Dark Color Version
 
Artoza Presentation : Light Color Version
Artoza Presentation : Light Color VersionArtoza Presentation : Light Color Version
Artoza Presentation : Light Color Version
 
Understanding What’s Possible: Getting Business Value from Big Data Quickly
Understanding What’s Possible: Getting Business Value from Big Data QuicklyUnderstanding What’s Possible: Getting Business Value from Big Data Quickly
Understanding What’s Possible: Getting Business Value from Big Data Quickly
 
Five Hacks to Weave Constituent Experience Into Your Organization
Five Hacks to Weave Constituent Experience Into Your OrganizationFive Hacks to Weave Constituent Experience Into Your Organization
Five Hacks to Weave Constituent Experience Into Your Organization
 
Deloitte at SXSW 2014
Deloitte at SXSW 2014Deloitte at SXSW 2014
Deloitte at SXSW 2014
 
Intranet Design Strategies
Intranet Design StrategiesIntranet Design Strategies
Intranet Design Strategies
 
Covenant Power BI JumpStart
Covenant Power BI JumpStartCovenant Power BI JumpStart
Covenant Power BI JumpStart
 
How Work Changes With AI & Copilots Slide Deck
How Work Changes With AI & Copilots Slide DeckHow Work Changes With AI & Copilots Slide Deck
How Work Changes With AI & Copilots Slide Deck
 
Software Engineer Neural language processin.pptx
Software Engineer  Neural language processin.pptxSoftware Engineer  Neural language processin.pptx
Software Engineer Neural language processin.pptx
 
David cutler slides shared at mit ilp update
David cutler slides shared at mit ilp   updateDavid cutler slides shared at mit ilp   update
David cutler slides shared at mit ilp update
 
Rapid Product Design in the Wild, Agile 2013
Rapid Product Design in the Wild, Agile 2013Rapid Product Design in the Wild, Agile 2013
Rapid Product Design in the Wild, Agile 2013
 
Data visualisation and storytelling workshop from Data Commune
Data visualisation and storytelling workshop from Data CommuneData visualisation and storytelling workshop from Data Commune
Data visualisation and storytelling workshop from Data Commune
 

Mais de Amanda Makulec

Adapting Agile for MERL
Adapting Agile for MERLAdapting Agile for MERL
Adapting Agile for MERLAmanda Makulec
 
The Simpsons, Design, and Data Use
The Simpsons, Design, and Data UseThe Simpsons, Design, and Data Use
The Simpsons, Design, and Data UseAmanda Makulec
 
Are Dashboards the Magic Bullet?
Are Dashboards the Magic Bullet?Are Dashboards the Magic Bullet?
Are Dashboards the Magic Bullet?Amanda Makulec
 
Designstorm How-to: Dot Plots
Designstorm How-to: Dot PlotsDesignstorm How-to: Dot Plots
Designstorm How-to: Dot PlotsAmanda Makulec
 
Data Visualization Design Best Practices Workshop
Data Visualization Design Best Practices WorkshopData Visualization Design Best Practices Workshop
Data Visualization Design Best Practices WorkshopAmanda Makulec
 
Making Data Meaningful
Making Data MeaningfulMaking Data Meaningful
Making Data MeaningfulAmanda Makulec
 
A Data Viz Makeover: Approaches for Improving your Visualizations
A Data Viz Makeover: Approaches for Improving your VisualizationsA Data Viz Makeover: Approaches for Improving your Visualizations
A Data Viz Makeover: Approaches for Improving your VisualizationsAmanda Makulec
 
Introduction to Infographic Design
Introduction to Infographic DesignIntroduction to Infographic Design
Introduction to Infographic DesignAmanda Makulec
 
June Design-storm : Piktochart
June Design-storm : PiktochartJune Design-storm : Piktochart
June Design-storm : PiktochartAmanda Makulec
 
Creating Functional Art in Excel
Creating Functional Art in ExcelCreating Functional Art in Excel
Creating Functional Art in ExcelAmanda Makulec
 
July Design-storm : Slidedocs
July Design-storm : SlidedocsJuly Design-storm : Slidedocs
July Design-storm : SlidedocsAmanda Makulec
 

Mais de Amanda Makulec (12)

Adapting Agile for MERL
Adapting Agile for MERLAdapting Agile for MERL
Adapting Agile for MERL
 
The Simpsons, Design, and Data Use
The Simpsons, Design, and Data UseThe Simpsons, Design, and Data Use
The Simpsons, Design, and Data Use
 
Are Dashboards the Magic Bullet?
Are Dashboards the Magic Bullet?Are Dashboards the Magic Bullet?
Are Dashboards the Magic Bullet?
 
Designstorm How-to: Dot Plots
Designstorm How-to: Dot PlotsDesignstorm How-to: Dot Plots
Designstorm How-to: Dot Plots
 
The Human Element
The Human ElementThe Human Element
The Human Element
 
Data Visualization Design Best Practices Workshop
Data Visualization Design Best Practices WorkshopData Visualization Design Best Practices Workshop
Data Visualization Design Best Practices Workshop
 
Making Data Meaningful
Making Data MeaningfulMaking Data Meaningful
Making Data Meaningful
 
A Data Viz Makeover: Approaches for Improving your Visualizations
A Data Viz Makeover: Approaches for Improving your VisualizationsA Data Viz Makeover: Approaches for Improving your Visualizations
A Data Viz Makeover: Approaches for Improving your Visualizations
 
Introduction to Infographic Design
Introduction to Infographic DesignIntroduction to Infographic Design
Introduction to Infographic Design
 
June Design-storm : Piktochart
June Design-storm : PiktochartJune Design-storm : Piktochart
June Design-storm : Piktochart
 
Creating Functional Art in Excel
Creating Functional Art in ExcelCreating Functional Art in Excel
Creating Functional Art in Excel
 
July Design-storm : Slidedocs
July Design-storm : SlidedocsJuly Design-storm : Slidedocs
July Design-storm : Slidedocs
 

Último

6 Tips for Interpretable Topic Models _ by Nicha Ruchirawat _ Towards Data Sc...
6 Tips for Interpretable Topic Models _ by Nicha Ruchirawat _ Towards Data Sc...6 Tips for Interpretable Topic Models _ by Nicha Ruchirawat _ Towards Data Sc...
6 Tips for Interpretable Topic Models _ by Nicha Ruchirawat _ Towards Data Sc...Dr Arash Najmaei ( Phd., MBA, BSc)
 
Learn How Data Science Changes Our World
Learn How Data Science Changes Our WorldLearn How Data Science Changes Our World
Learn How Data Science Changes Our WorldEduminds Learning
 
Data Analysis Project Presentation: Unveiling Your Ideal Customer, Bank Custo...
Data Analysis Project Presentation: Unveiling Your Ideal Customer, Bank Custo...Data Analysis Project Presentation: Unveiling Your Ideal Customer, Bank Custo...
Data Analysis Project Presentation: Unveiling Your Ideal Customer, Bank Custo...Boston Institute of Analytics
 
Student Profile Sample report on improving academic performance by uniting gr...
Student Profile Sample report on improving academic performance by uniting gr...Student Profile Sample report on improving academic performance by uniting gr...
Student Profile Sample report on improving academic performance by uniting gr...Seán Kennedy
 
Data Factory in Microsoft Fabric (MsBIP #82)
Data Factory in Microsoft Fabric (MsBIP #82)Data Factory in Microsoft Fabric (MsBIP #82)
Data Factory in Microsoft Fabric (MsBIP #82)Cathrine Wilhelmsen
 
Decoding the Heart: Student Presentation on Heart Attack Prediction with Data...
Decoding the Heart: Student Presentation on Heart Attack Prediction with Data...Decoding the Heart: Student Presentation on Heart Attack Prediction with Data...
Decoding the Heart: Student Presentation on Heart Attack Prediction with Data...Boston Institute of Analytics
 
Data Analysis Project : Targeting the Right Customers, Presentation on Bank M...
Data Analysis Project : Targeting the Right Customers, Presentation on Bank M...Data Analysis Project : Targeting the Right Customers, Presentation on Bank M...
Data Analysis Project : Targeting the Right Customers, Presentation on Bank M...Boston Institute of Analytics
 
Semantic Shed - Squashing and Squeezing.pptx
Semantic Shed - Squashing and Squeezing.pptxSemantic Shed - Squashing and Squeezing.pptx
Semantic Shed - Squashing and Squeezing.pptxMike Bennett
 
Student profile product demonstration on grades, ability, well-being and mind...
Student profile product demonstration on grades, ability, well-being and mind...Student profile product demonstration on grades, ability, well-being and mind...
Student profile product demonstration on grades, ability, well-being and mind...Seán Kennedy
 
Decoding Patterns: Customer Churn Prediction Data Analysis Project
Decoding Patterns: Customer Churn Prediction Data Analysis ProjectDecoding Patterns: Customer Churn Prediction Data Analysis Project
Decoding Patterns: Customer Churn Prediction Data Analysis ProjectBoston Institute of Analytics
 
Real-Time AI Streaming - AI Max Princeton
Real-Time AI  Streaming - AI Max PrincetonReal-Time AI  Streaming - AI Max Princeton
Real-Time AI Streaming - AI Max PrincetonTimothy Spann
 
Decoding Movie Sentiments: Analyzing Reviews with Data Analysis model
Decoding Movie Sentiments: Analyzing Reviews with Data Analysis modelDecoding Movie Sentiments: Analyzing Reviews with Data Analysis model
Decoding Movie Sentiments: Analyzing Reviews with Data Analysis modelBoston Institute of Analytics
 
Minimizing AI Hallucinations/Confabulations and the Path towards AGI with Exa...
Minimizing AI Hallucinations/Confabulations and the Path towards AGI with Exa...Minimizing AI Hallucinations/Confabulations and the Path towards AGI with Exa...
Minimizing AI Hallucinations/Confabulations and the Path towards AGI with Exa...Thomas Poetter
 
IBEF report on the Insurance market in India
IBEF report on the Insurance market in IndiaIBEF report on the Insurance market in India
IBEF report on the Insurance market in IndiaManalVerma4
 
SMOTE and K-Fold Cross Validation-Presentation.pptx
SMOTE and K-Fold Cross Validation-Presentation.pptxSMOTE and K-Fold Cross Validation-Presentation.pptx
SMOTE and K-Fold Cross Validation-Presentation.pptxHaritikaChhatwal1
 
Networking Case Study prepared by teacher.pptx
Networking Case Study prepared by teacher.pptxNetworking Case Study prepared by teacher.pptx
Networking Case Study prepared by teacher.pptxHimangsuNath
 
World Economic Forum Metaverse Ecosystem By Utpal Chakraborty.pdf
World Economic Forum Metaverse Ecosystem By Utpal Chakraborty.pdfWorld Economic Forum Metaverse Ecosystem By Utpal Chakraborty.pdf
World Economic Forum Metaverse Ecosystem By Utpal Chakraborty.pdfsimulationsindia
 
English-8-Q4-W3-Synthesizing-Essential-Information-From-Various-Sources-1.pdf
English-8-Q4-W3-Synthesizing-Essential-Information-From-Various-Sources-1.pdfEnglish-8-Q4-W3-Synthesizing-Essential-Information-From-Various-Sources-1.pdf
English-8-Q4-W3-Synthesizing-Essential-Information-From-Various-Sources-1.pdfblazblazml
 
Bank Loan Approval Analysis: A Comprehensive Data Analysis Project
Bank Loan Approval Analysis: A Comprehensive Data Analysis ProjectBank Loan Approval Analysis: A Comprehensive Data Analysis Project
Bank Loan Approval Analysis: A Comprehensive Data Analysis ProjectBoston Institute of Analytics
 
Cyber awareness ppt on the recorded data
Cyber awareness ppt on the recorded dataCyber awareness ppt on the recorded data
Cyber awareness ppt on the recorded dataTecnoIncentive
 

Último (20)

6 Tips for Interpretable Topic Models _ by Nicha Ruchirawat _ Towards Data Sc...
6 Tips for Interpretable Topic Models _ by Nicha Ruchirawat _ Towards Data Sc...6 Tips for Interpretable Topic Models _ by Nicha Ruchirawat _ Towards Data Sc...
6 Tips for Interpretable Topic Models _ by Nicha Ruchirawat _ Towards Data Sc...
 
Learn How Data Science Changes Our World
Learn How Data Science Changes Our WorldLearn How Data Science Changes Our World
Learn How Data Science Changes Our World
 
Data Analysis Project Presentation: Unveiling Your Ideal Customer, Bank Custo...
Data Analysis Project Presentation: Unveiling Your Ideal Customer, Bank Custo...Data Analysis Project Presentation: Unveiling Your Ideal Customer, Bank Custo...
Data Analysis Project Presentation: Unveiling Your Ideal Customer, Bank Custo...
 
Student Profile Sample report on improving academic performance by uniting gr...
Student Profile Sample report on improving academic performance by uniting gr...Student Profile Sample report on improving academic performance by uniting gr...
Student Profile Sample report on improving academic performance by uniting gr...
 
Data Factory in Microsoft Fabric (MsBIP #82)
Data Factory in Microsoft Fabric (MsBIP #82)Data Factory in Microsoft Fabric (MsBIP #82)
Data Factory in Microsoft Fabric (MsBIP #82)
 
Decoding the Heart: Student Presentation on Heart Attack Prediction with Data...
Decoding the Heart: Student Presentation on Heart Attack Prediction with Data...Decoding the Heart: Student Presentation on Heart Attack Prediction with Data...
Decoding the Heart: Student Presentation on Heart Attack Prediction with Data...
 
Data Analysis Project : Targeting the Right Customers, Presentation on Bank M...
Data Analysis Project : Targeting the Right Customers, Presentation on Bank M...Data Analysis Project : Targeting the Right Customers, Presentation on Bank M...
Data Analysis Project : Targeting the Right Customers, Presentation on Bank M...
 
Semantic Shed - Squashing and Squeezing.pptx
Semantic Shed - Squashing and Squeezing.pptxSemantic Shed - Squashing and Squeezing.pptx
Semantic Shed - Squashing and Squeezing.pptx
 
Student profile product demonstration on grades, ability, well-being and mind...
Student profile product demonstration on grades, ability, well-being and mind...Student profile product demonstration on grades, ability, well-being and mind...
Student profile product demonstration on grades, ability, well-being and mind...
 
Decoding Patterns: Customer Churn Prediction Data Analysis Project
Decoding Patterns: Customer Churn Prediction Data Analysis ProjectDecoding Patterns: Customer Churn Prediction Data Analysis Project
Decoding Patterns: Customer Churn Prediction Data Analysis Project
 
Real-Time AI Streaming - AI Max Princeton
Real-Time AI  Streaming - AI Max PrincetonReal-Time AI  Streaming - AI Max Princeton
Real-Time AI Streaming - AI Max Princeton
 
Decoding Movie Sentiments: Analyzing Reviews with Data Analysis model
Decoding Movie Sentiments: Analyzing Reviews with Data Analysis modelDecoding Movie Sentiments: Analyzing Reviews with Data Analysis model
Decoding Movie Sentiments: Analyzing Reviews with Data Analysis model
 
Minimizing AI Hallucinations/Confabulations and the Path towards AGI with Exa...
Minimizing AI Hallucinations/Confabulations and the Path towards AGI with Exa...Minimizing AI Hallucinations/Confabulations and the Path towards AGI with Exa...
Minimizing AI Hallucinations/Confabulations and the Path towards AGI with Exa...
 
IBEF report on the Insurance market in India
IBEF report on the Insurance market in IndiaIBEF report on the Insurance market in India
IBEF report on the Insurance market in India
 
SMOTE and K-Fold Cross Validation-Presentation.pptx
SMOTE and K-Fold Cross Validation-Presentation.pptxSMOTE and K-Fold Cross Validation-Presentation.pptx
SMOTE and K-Fold Cross Validation-Presentation.pptx
 
Networking Case Study prepared by teacher.pptx
Networking Case Study prepared by teacher.pptxNetworking Case Study prepared by teacher.pptx
Networking Case Study prepared by teacher.pptx
 
World Economic Forum Metaverse Ecosystem By Utpal Chakraborty.pdf
World Economic Forum Metaverse Ecosystem By Utpal Chakraborty.pdfWorld Economic Forum Metaverse Ecosystem By Utpal Chakraborty.pdf
World Economic Forum Metaverse Ecosystem By Utpal Chakraborty.pdf
 
English-8-Q4-W3-Synthesizing-Essential-Information-From-Various-Sources-1.pdf
English-8-Q4-W3-Synthesizing-Essential-Information-From-Various-Sources-1.pdfEnglish-8-Q4-W3-Synthesizing-Essential-Information-From-Various-Sources-1.pdf
English-8-Q4-W3-Synthesizing-Essential-Information-From-Various-Sources-1.pdf
 
Bank Loan Approval Analysis: A Comprehensive Data Analysis Project
Bank Loan Approval Analysis: A Comprehensive Data Analysis ProjectBank Loan Approval Analysis: A Comprehensive Data Analysis Project
Bank Loan Approval Analysis: A Comprehensive Data Analysis Project
 
Cyber awareness ppt on the recorded data
Cyber awareness ppt on the recorded dataCyber awareness ppt on the recorded data
Cyber awareness ppt on the recorded data
 

Nurturing Data Visualization