
Recommended
Recommended
More Related Content
Similar to Contents lists available at ScienceDirectNeuroscience and
Similar to Contents lists available at ScienceDirectNeuroscience and (20)
More from AlleneMcclendon878
More from AlleneMcclendon878 (20)
Recently uploaded
Recently uploaded (20)
Contents lists available at ScienceDirectNeuroscience and
- 1. Contents lists available at ScienceDirect Neuroscience and Biobehavioral Reviews journal homepage: www.elsevier.com/locate/neubiorev Changing conceptualizations of regression: What prospective studies reveal about the onset of autism spectrum disorder Sally Ozonoffa,⁎ , Ana-Maria Iosifb a Department of Psychiatry and Behavioral Sciences, MIND Institute, University of California – Davis, 2825 50th Street, Sacramento CA, 95817, USA b Department of Public Health Sciences, University of California – Davis, Medical Sciences 1C, Davis CA, 95616, USA A R T I C L E I N F O Keywords: Autism spectrum disorder Onset patterns Regression Prospective studies A B S T R A C T Until the last decade, studies of the timing of early symptom emergence in autism spectrum disorder (ASD) relied upon retrospective methods. Recent investigations, however, are
- 2. raising significant questions about the accuracy and validity of such data. Questions about when and how behavioral signs of autism emerge may be better answered through prospective studies, in which infants are enrolled near birth and followed longitudinally until the age at which ASD can be confidently diagnosed or ruled out. This review summarizes the results of recent studies that utilized prospective methods to study infants at high risk of developing ASD due to family history. Collectively, prospective studies demonstrate that the onset of ASD involves declines in the rates of key social and communication behaviors during the first years of life for most children. This corpus of literature suggests that regressive onset patterns occur much more frequently than previously recognized and may be the rule rather than the exception. 1. Introduction The onset of behavioral signs of autism spectrum disorder (ASD) is usually conceptualized as occurring in one of two ways: an early onset pattern, in which children demonstrate delays and deviances in social and communication development early in life, and a regressive pattern, in which children develop largely as expected for some period and then experience a substantial decline in or loss of previously developed skills. While it was long believed that the majority of children with ASD demonstrated an early onset pattern, more recent studies suggest that regressive onset occurs more frequently than previously
- 3. recognized (Brignell et al., 2017; Hansen et al., 2008; Kern et al., 2015; Pickles et al., 2009; Shumway et al., 2011; Thurm et al., 2014; for a review, see meta-analysis by Barger et al., 2013). Studies occasional ly also identify a third onset pattern, that of developmental stagnation or plateau (Shumway et al., 2011), that is characterized by intact early skills that fail to progress or transform into more advanced developmental achievements. This onset pattern is distinct from regression, in that the child does not lose acquired skills, but instead fails to make expected gains. 1.1. Methods for measuring onset patterns The most common procedure for collecting information about the timing of early symptoms is retrospective parent report. A number of factors can influence report validity, including awareness of the child’s eventual diagnosis and knowledge of developmental milestones. It has long been understood that retrospective reports are subject to problems of memory and interpretation (Finney, 1981; Henry et al., 1994; Pickles et al., 1996), including in studies of ASD (Andrews et al., 2002). Mul- tiple studies have documented the ways in which recall
- 4. problems and other biases can influence parent report. Changes in recall occur over time, with past events often reported to occur more recently, closer to the time of recollection, than they actually took place, an error called forward telescoping (Loftus and Marburger, 1983). Studies of children with ASD have demonstrated significant forward telescoping in parent report of milestones, resulting in parents being less likely to report re- gression and more likely to report early delays as their children grow older (Hus et al., 2011; Lord et al., 2004). A recent study from our research team (Ozonoff et al., 2018a) conducted longitudinal inter- views with parents about onset of ASD symptoms when their child was 2–3 years old (Time 1) and approximately 6 years old (Time 2). Sig- nificant forward telescoping was found in both age of regression and age when milestones were achieved. The correspondence between Time 1 and Time 2 parent report of onset was low (kappa = .38). One- quarter of the sample changed onset categories, most often due to parents not recalling a regression at Time 2 that they had reported at Time 1. Analysis of home movies of children later diagnosed with ASD is
- 5. https://doi.org/10.1016/j.neubiorev.2019.03.012 Received 24 September 2018; Received in revised form 12 February 2019; Accepted 14 March 2019 ⁎ Corresponding author. E-mail addresses: [email protected] (S. Ozonoff), [email protected] (A.-M. Iosif). Neuroscience and Biobehavioral Reviews 100 (2019) 296–304 Available online 15 March 2019 0149-7634/ © 2019 Elsevier Ltd. All rights reserved. T http://www.sciencedirect.com/science/journal/01497634 https://www.elsevier.com/locate/neubiorev https://doi.org/10.1016/j.neubiorev.2019.03.012 https://doi.org/10.1016/j.neubiorev.2019.03.012 mailto:[email protected] mailto:[email protected] https://doi.org/10.1016/j.neubiorev.2019.03.012 http://crossmark.crossref.org/dialog/?doi=10.1016/j.neubiorev.2 019.03.012&domain=pdf another retrospective method used in research studies to study symptom emergence (Goldberg et al., 2008; Palomo et al., 2006). Video analysis may be a more objective procedure for documenting early symptoms than parent recall (Werner and Dawson, 2005) but it is labor- intensive and subject to other limitations, such as selective recording
- 6. (e.g., tendency of parents to film positive behaviors). In a study from our team that compared classification of onset based on coding of fa- mily movies to onset type as recalled by parents (Ozonoff et al., 2011a), less than half of children whose home video displayed clear evidence of a major decline in social and communication behavior were reported to have had a regression by parents. Similarly, only 40% of participants with clear evidence of early delays and little evidence of skill decline on video were reported by parents to show an early onset pattern. 1.2. Prospective studies of onset Questions about when and how behavioral signs of autism emerge may be better answered through prospective investigations, in which infants are recruited and enrolled near birth, prior to the advent of parent concerns, and then followed longitudinally through the window of developmental risk, until the age at which ASD can be confidently diagnosed or ruled out, usually 36 months. A few large general popu- lation cohorts have been studied prospectively to examine onset pat- terns (Brignell et al., 2017; Havdahl et al., 2018) but this study design is inefficient, since fewer than 2 in 100 participants will develop ASD
- 7. (Centers for Disease Control and Prevention, 2018), making it difficult to achieve an appropriate sample size. Additionally, large prospective cohort studies must, of necessity, rely upon parent questionnaires and rarely provide the opportunity for in-person clinical assessments to verify diagnosis or onset pattern. For this reason, most prospective investigations utilize high-risk samples in order to increase the number of ASD outcomes that are in- formative for study. The most widely used high-risk group has been later-born siblings of children with ASD, who are known to be at higher ASD risk than the general population (Constantino et al., 2010). Most investigations compare high-risk infants to lower-risk participants with no known family history of ASD in first-, second-, and sometimes third- degree relatives. This study design improves on retrospective methods in a number of important ways. Serial comprehensive assessments, in standardized testing contexts, are used to document the timing of symptom emergence, thus avoiding reliance on potentially fallible parent recall or non-representative home video. Assessments can utilize a wide range of tools, including eye tracking, EEG, and imaging, al- lowing broader investigations of symptom onset and testing of
- 8. specific hypotheses. And while most retrospective studies recruit samples through clinics, which may influence the results by including more severely affected children, infant sibling studies avoid such potential biases by ascertaining participants via family history alone. Several recent papers provide comprehensive reviews of the infant sibling literature (Bölte et al., 2013; Jones et al., 2014; Pearson et al., 2018; Szatmari et al., 2016). Here we focus on research reports of greatest relevance to symptom emergence, specifically those that study infants beginning in the first year of life on measures that are appro- priate for examining potential skill decline over time. Using a variety of different prospective methods, these studies have reported largely in- tact early development, followed by developmental declines and onset of symptoms around the first birthday and in the second year of life. For example, Zwaigenbaum et al. (2005), using the Autism Observation Scale for Infants (AOSI), reported no differences at 6 months between infants subsequently diagnosed with ASD and both high- and low-risk infants without ASD outcomes; significant group differences emerged at 12 months and increased over time. This pattern on the AOSI
- 9. was later replicated by an independent research team (Gammer et al., 2015). Wan et al. (2013) found that infant-parent interaction quality at 6–10 months did not predict which children would be diagnosed with ASD at age 3, but by 12–15 months, such variables were significantly associated with diagnostic outcome. Similar findings of lack of early group differences (or lack of early predictive ability), followed by later divergence from typically developing infants, have been reported by Landa and Garrett-Mayer (2006) using the Mullen Scales of Early Learning, Rozga et al. (2011) in joint attention, Bedford et al. (2012) on a gaze-following eye-tracking task, Elsabbagh et al. (2013) on a gap- overlap attention task, and Wolff et al. (2014) studying repetitive be- havior. In an incisive recent review that attempts to reconcile retro- spective and prospective studies of regression and expl ore how study design affects the likelihood of capturing regression, Pearson et al. (2018) conclude that, among infants who later develop ASD, “the ma- jority show declining fixation of eyes, gaze to faces, and social en- gagement, from typical levels in early infancy (2–6 months) to sig- nificantly reduced levels by 24–36 months (p. 14).”
- 10. 2. Findings from the University of California Davis infant sibling study In our laboratory, we have taken the analytic approach of growth curve modeling to examine directly the evidence of longitudinal de- velopmental change in the first three years of life. Between 2003 and 2015, the UC Davis Infant Sibling Study recruited three cohorts of later- born siblings, each composed of 50 low-risk and 100 high-risk infants. Participants were tested as early as 6 months of age and then seen every 3 to 6 months until their 3rd birthday (up to 7 in-person evaluations). They have since been followed into school age and tested at approxi- mately three-year intervals. The oldest children from Cohort 1 are now 16 years of age and the retention rate is over 80%. At each infant and preschool visit, a battery of age-appropriate standardized tests and experimental tasks was administered that measured language, cogni- tion, social, communication, motor, and many other domains. Approximately 20% of the high-risk infants were later diagnosed with ASD (Ozonoff et al., 2011b). Diagnoses of ASD were made at any point that a child met criteria (mean age 24.2 months) but a full diagnostic
- 11. assessment was completed on all children, regardless of previous find- ings, at 36 months by examiners unaware of family risk or prior as- sessment results. In the following sections, we summarize several stu- dies from these cohorts that consistently demonstrate declining trajectories across a variety of different measures and developmental domains. The phenomenon of regression is defined by loss or significant de- crease in already-acquired skills. Thus, a critical methodological issue in prospective studies that wish to examine onset patterns is selection of which behaviors to measure. They must be 1) developmentally appro- priate across the full age window of risk and 2) robustly present, at high frequency, in the first year of life. Such behaviors have the capacity to decrease and are therefore of highest relevance to the study of onset patterns. Measures that focus on socio-communicative behaviors that have not yet emerged in the first year of life, such as joint attention, imitation, and verbal communication, will be less useful for testing hypotheses about declining capacities. The behaviors our laboratory has focused on, including gaze to faces and eyes of others, shared affect, and social interest/engagement, are well developed in the first
- 12. year of life (Inada et al., 2010) and therefore of highest relevance in the pro- spective measurement of regression. 2.1. Behavioral coding of social-communication rates Our first exploration of longitudinal change in early social and communicative behaviors used video recordings of participants inter- acting with examiners during structured developmental testing (Ozonoff et al., 2010). Research assistants, unaware of family risk group or diagnostic outcome, were trained to 90% reliability to detect three behaviors: gaze to an adult’s face, smiles at an adult that were paired with eye contact, and vocalizations directed at an adult that were ac- companied by eye contact. Rate per minute of eye gaze, shared affect, S. Ozonoff and A.-M. Iosif Neuroscience and Biobehavioral Reviews 100 (2019) 296–304 297 and directed vocalizations of the 25 children in Cohort 1 with outcomes of ASD were compared to those of 25 children who did not have ASD outcomes randomly selected from the low-risk group. The two groups behaved similarly at 6 months: frequencies of none of the three
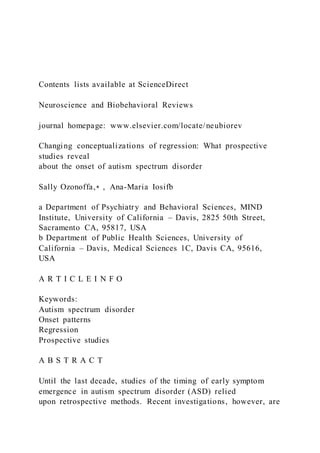
- 13. beha- viors differed between the groups and effect sizes were in the small range. Over time, the Low-Risk (LR) Non-ASD group had a significant increase in social smiles and directed vocalizations, while maintaining the same consistently high level of gaze to faces. In the ASD group, in contrast, the rates of all three behaviors dramatically decreased over time. Fig. 1A displays longitudinal trajectories of eye contact rate per minute, showing comparable values between groups at 6 months, fol- lowed by group differences that became statistically significant by 12 months and persisted and widened over time. These longitudinal de- creases in the rates of key social and communicative behaviors provided the first prospectively measured evidence consistent with a regressive onset pattern. We have since replicated these findings (see Fig. 1B) using the same methods in an independent sample of 46 infants later diagnosed with ASD from Cohorts 2 and 3 of our longitudinal project. In this analysis (Gangi et al., in preparation), a third group, composed of high- risk (HR) infants who did not have ASD outcomes, was also included. This group was not different from the LR Non-ASD group in the frequency
- 14. of gaze to adult faces at any age and did not show any evidence of decline in development, which was evident only in the participants developing ASD, replicating our 2010 study. 2.2. Observer ratings of social engagement Coding behavior frequencies from video is time-consuming, labor- intensive, expensive, and not transferable to clinical contexts, so our research program has also sought to establish whether declining tra- jectories are evident using other methodological approaches. At the end of each visit, examiners rate the frequency of eye contact, shared affect, and overall social engagement (number of social initiations and social responses) made by the infant throughout the session, across all tasks, using a 3-point scale (1 = rare, 2 = occasional, 3 = frequent). These scores are summed to create a composite that ranges from 3 to 9. As reported in Ozonoff et al. (2010) and depicted in Fig. 2A, these ex- aminer ratings of social engagement showed similar longitudinal pat- terns to the social behaviors coded from video. There w ere no group differences in the 6-month examiner ratings; however, while the LR Non-ASD group showed a significant increase in social
- 15. engagement ratings over time, reaching close to the maximum score by 36 months, the children in the ASD outcome group had a strong decline in social engagement ratings over the same time period. This finding was recently replicated in an independent group of 32 infants with ASD outcomes from Cohorts 2 and 3 of our sample (Ozonoff et al., 2018b). We used the same examiner rating variable (this time with an expanded 5-point scale) and compared the ASD group to both a low-risk and a high-risk group without ASD. Again, all three groups had comparable levels of social engagement based on examiner scores at 6 months of age. The ASD group then demonstrated a decrease in scores with age, while the HR Non-ASD group showed stable high scores over time and the LR Non-ASD group demonstrated increasing scores longitudinally. By 12 months, the two Non-ASD groups demon- strated significantly higher rates of social engagement, as judged by examiners, than the ASD group and these differences widened over time, as can be seen in Fig. 2B. Along with our 2010 paper, these findings demonstrate that the declines in the frequency of social and communication behaviors detected through more labor-intensive
- 16. video coding methods are also detectable through much simpler methods that would be feasible for broader use, such as brief observational ratings of social engagement by clinical professionals. 2.3. Longitudinal parent ratings of social behavior The question remained, however, whether such findings could be an artifact or byproduct of the assessment context with an unfamiliar ex- aminer. For both clinical use and future development of screening methods, it is critical to also establish whether parent ratings are sen- sitive to the developmental decline phenomenon we have reported. In a recent study (Ozonoff et al., 2018b), we examined parent prospective ratings of the same early-appearing socio-communicative behaviors measured in the video and examiner ratings. Parents in our study completed the Early Development Questionnaire (EDQ; Ozonoff et al., 2005) prior to each visit. The EDQ consists of 45 questions about the child’s current functioning in social, communication, and repetitive behavior domains. Each item is rated on a 4-point frequency scale (0=behavior never occurs, 3=behavior often occurs). Three items, comparable in content to the video codes and examiner ratings,
- 17. were summed: item 1 (“my child looks at me during social interactions”), item 4 (“my child smiles back at me when I smile at him/her”), and item 13 (“when I call my child’s name, he/she looks at me right away”). In addition to being parallel to the behaviors rated by examiners, these items were selected because they represent early-appearing behaviors that are relevant and developmentally appropriate across all ages of the Fig. 1. Declining trajectories of gaze to eyes in children developing ASD, coded from a videotaped interaction with an examiner. Panel A: Cohort 1, Panel B: Cohorts 2 and 3. S. Ozonoff and A.-M. Iosif Neuroscience and Biobehavioral Reviews 100 (2019) 296–304 298 study (6–36 months). In contrast to other EDQ items that measure later- developing skills (e.g., joint attention, language), the items selected for the composite measure behaviors present in the first year of life (Inada et al., 2010). As with the behaviors we selected for coding and examiner observational ratings, it was critical that the behaviors rated by parents
- 18. have the potential to demonstrate decreases over time as ASD signs emerge. The composite variable, quantifying parent report of the fre- quency of key early social behaviors, had a potential range of 0 – 9. On the parent-rated EDQ, there were again no group differences at 6 months. As with the other measures, the ASD group showed a decline in levels of social engagement with age, while both the high-risk and low- risk Non-ASD groups demonstrated gains in social engagement over time. The ASD group’s scores were significantly lower than both Non- ASD groups by 12 months and the differences increased with age, de- monstrating the same declining trajectory as evident in the coded be- havior and examiner ratings (see Fig. 3A). Employing a similar approach, we replicated the ability of parent report to capture the decline in social and communication development using a standardized, normed measure (Parikh et al., 2018), the Infant- Toddler Checklist (ITC), a 24-item parent questionnaire from the Communication and Social Behavior Scales (CSBS; Wetherby and Prizant, 2002). This instrument is normed from 6 to 24 months and includes questions that span this developmental range, from
- 19. early-ap- pearing behaviors like social smiling to those that emerge at older ages, such as spoken language and pretend play. We created a composite of three items that represent behaviors typically present in the first year of life (item 2: “when your child plays with toys, does he/she look at you to see if you are watching?”; item 3: “does your child smile or laugh while looking at you?”; item 19: “when you call your child’s name, does he/she respond by looking or turning toward you?”). We then com- pared growth trajectories in infants subsequently diagnosed with ASD (n = 46) to the HR Non-ASD (n = 139) and LR Non-ASD groups (n = 96). There were no group differences on the 3-item ITC composite at 6 months of age; however, over time, the ASD group showed a de- cline in scores, while the two Non-ASD groups demonstrated gains (see Fig. 3B). This resulted in the ASD group having significantly lower scores at 24 months than both comparison groups. These studies from our lab show that children with ASD, as a group, evidence declines in development from 6 to 36 months. Such declines are seen only in the ASD group and not in comparison samples, even those with elevated genetic risk or other developmental concerns.
- 20. Findings of declining trajectories have since been replicated by other Fig. 2. Declining trajectories of social engagement in children developing ASD, as rated by examiners unaware of risk group or outcome. Panel A: Cohort 1, Panel B: Cohorts 2 and 3. Fig. 3. Declining trajectories of social engagement in children developing ASD, as rated by parents, Cohorts 2 and 3. Panel A: Early Development Questionnaire, Panel B: Infant Toddler Checklist. S. Ozonoff and A.-M. Iosif Neuroscience and Biobehavioral Reviews 100 (2019) 296–304 299 independent research teams. Landa et al. (2013) examined growth trajectories in infants later diagnosed with ASD and Non-ASD partici- pants. Approximately half of the children with ASD, labeled the Early- ASD group, demonstrated differences from the Non-ASD cases at 14 months but the other half (Later-ASD group) did not diverge from ty- pical infants until 24 months. The Later-ASD group demonstrated a steep decline in shared positive affect, as measured by the CSBS (Wetherby and Prizant, 2002), between 14 and 24 months. Jones and
- 21. Klin (2013) conducted a prospective eye-tracking study with high- and low-risk infants to assess attention to eyes. The authors reported that very early in development (i.e., first two months of life), both low-risk and high-risk infants displayed high levels of attention to eyes, with no group differences. However, high-risk infants who were later diagnosed with ASD began to demonstrate a steady decline in looking at eyes at four months, reaching a level that was approximately half that of low- risk infants by 24 months. What was most predictive of a later ASD outcome was not the amount of visual fixation on eyes displayed at any particular age, but the overall declining trajectory over time. This study found that the majority of infants developing ASD demonstrated this declining pattern. 2.4. Growth curve modeling approaches to determining onset classifications In aggregate, the studies reviewed up to this point converge on the conclusion that longitudinal decreases in key social behaviors are a signature of the early emergence of ASD. But these data do not clarify how widespread such phenomena are within ASD and whether the group-level findings are driven by extreme outliers or
- 22. characterize a majority of young children developing ASD. In our lab, we have ap- proached this issue analytically using multivariate Latent Class Analysis (LCA; Muthen, 2004), permitting us to identify distinct subgroups of children based on their longitudinal patterns on multiple measures of social communication. This technique does not rely on preconceived notions or poorly defined definitions of onset phenomena, but instead uses statistical modeling to empirically derive the optimum number of classes described by the patterns of performance demonstrated in the measures. Data from a recent paper (Ozonoff et al., 2018b) address the ques- tion of how widespread the declining trajectories pattern is within a group of 32 infants subsequently diagnosed with ASD. We employed latent class growth models to examine potential within-group variation in onset patterns, using both examiner ratings of social engagement and parent ratings from the EDQ (see Sections 2.2 and 2.3 for instrument descriptions). Best model fit for examiner ratings was a two- group so- lution. Using their highest posterior group probability, the 32 partici- pants were classified into two trajectories (see Fig. 4A, which
- 23. also presents the Low- and High-Risk Non-ASD groups as contrasts). Only a small proportion of the ASD cases (n = 4; 13%) were assigned to an Early Onset/No Regression group by the latent class analyses, based on examiners prospectively reporting low levels of social behavior at all ages. The vast majority (n = 28; 88%) were classified by these analyses into a Regression group, in which examiners prospectively rated in- itially high levels of social engagement that dropped significantly over time. The best fit for the parent EDQ 3-item composite in the latent class models was a three-group solution: Group 1, an Early Onset trajectory, Group 2, a Declining trajectory, and Group 3, an Improving trajectory (see Fig. 4B). Parents prospectively reported low levels of social en- gagement at all ages for Group 1, which again made up a small minority of the sample (n = 4; 13% of the sample). The majority of the sample (n = 22; 69%) was classified in Group 2; these children were pro- spectively reported by parents to show high rates of social engagement early in life, which significantly declined over time. Parents of children in Group 3 (n = 6; 19%) prospectively reported low levels of
- 24. skills at early ages that then significantly increased over time. 2.5. Concordance between retrospective and prospective onset classifications In several of our studies, we have examined the correspondence between prospectively- and retrospectively-defined onset patterns and in each case have found them to be quite poor. For example, in our initial paper (Ozonoff et al., 2010), we compared onset classifications based upon coded frequencies of social and communicative behaviors to onset classifications employing retrospective parent report on the Autism Diagnostic Interview-Revised (ADI-R; Le Couteur et al., 2003). Using prospective observational data, 86% of the ASD sample showed decreasing rates of eye contact, social smiles, and vocalizations over time, but by parental recall using the ADI-R, only 17% of the children were classified as having regressive onset. In a more recent study (Ozonoff et al., 2018b), 69% of parents rated their child in a manner consistent with regression on a prospective questionnaire (the EDQ, described in section 2.3), but only 29% rated that same child as losing skills using a retrospective measure (the ADI-R). Parents were able to implicitly identify the changes in their child’s development over
- 25. time when making ratings of the frequencies of current behaviors, but often did not explicitly label these changes as skill loss or regression when asked in a more categorical way. These results were particularly striking since both relied upon parental observations of the child. Si- milar findings of low concordance between retrospecti ve and pro- spective methods of defining onset were reported by Landa et al. (2013). And a recent large general population study (Havdahl et al., 2018) found similar under-reporting of losses based on a retrospective parent interview. Of parents who prospectively reported a loss, defined as rating certain social behaviors as present at 18 months but absent at 36 months, only a striking 2% of them recalled such a decline, or la- beled it as a loss, when asked at age 3. 3. Conclusions and theoretical implications A number of conclusions can be drawn from the collective body of work reviewed in this paper. 3.1. Onset involves declining social development ASD emerges over the first two years of life and is not present “from the beginning of life” as stated by Kanner (1943, p. 242) in his seminal
- 26. paper. For many years, it was presumed that ASD signs were present, but were just challenging to measure, from birth. Diagnostic criteria for ASD were developed at a time when children with autism were rarely, if ever, identified in infancy and thus many symptoms in the DSM and ICD criteria, such as delays or deficits in gestures, language, imitation, and pretense, are less relevant to the first year of life. As we have empha- sized in this review, one key to understanding early symptom emer- gence is to focus on very early-appearing social behaviors, those that are robustly present in early infancy, such as social interest, shared affect, gaze to faces and eyes, and response to name. When such a methodological approach is taken, there is clear evidence, across mul- tiple methods, replicated by independent research teams, of declining social behavior over time, after a period of relatively typical develop- ment. There is convergence across studies of a lack of group differences from comparison samples without ASD before 9 months of age, fol- lowed by statistically significant differences starting at 12 months that widen over time. Logically, if certain skills are evident at typical rates at an early point in development and then those same skills, defined and
- 27. measured the same way later in development, have substantially di- minished, resulting in statistically significant differences from typical infants, a loss or regression of some magnitude must have occurred. This paper advocates for taking a dimensional approach and using trajectories to identify patterns of onset. We are not arguing, however, for a fundamental reconsideration of the use of the word “regression.” The Merriam-Webster definition of the word regression is “a trend or S. Ozonoff and A.-M. Iosif Neuroscience and Biobehavioral Reviews 100 (2019) 296–304 300 shift toward a lower or less perfect state, such as (a) progressive decline of a manifestation of disease or (b) gradual loss of acquired skills.” This aptly describes the loss of established skills (e.g., eye contact, response to name, social interest) that occurs during the declines in social de- velopment described in this paper. 3.2. Regression in ASD is the Rule, not the exception The data summarized in this review suggest that a regressive
- 28. pattern of onset is much more common than previously thought, the rule rather than the exception. While retrospective studies yielded regression es- timates of 20–30%, prospective data put them much higher, in some studies well over 80%. We and others (Jones et al., 2014; Ozonoff et al., 2018b; Pearson et al., 2018) have suggested that the regressions re- ported by parents retrospectively on measures like the ADI-R represent just “the tip of the iceberg,” while prospective studies are able to cap- ture earlier, more gradual, subtle changes that may be less noticeable in real-time observation. A hypothesis deriving from this supposition is that concordance between retrospective and prospective methods should be most frequent when the regression occurs later, is more drastic or severe, and involves loss of clearly defined skills like lan- guage. No published studies have yet examined this question and it would be a fruitful avenue for future investigation. We propose that the way ASD starts, for all children, is through declines in early social and communication abilities. This presents a testable hypothesis: that all infants developing ASD lose some skills, but at different ages, some of which may be harder to detect with current
- 29. measurement approaches than others. It may be difficult for parents to perceive and describe changing patterns of development that occur over many months during infancy, particularly when the period of normalcy is fairly brief. Our team (Ozonoff et al., 2010, 2011a) and others (Pearson et al., 2018; Rogers, 2009; Szatmari et al., 2016; Thurm et al., 2014) have suggested that onset is better thought of dimensionally, as a continuum of age when social and communication behaviors begin to diverge or decline, rather than a dichotomy (regression v. early onset). In a dimensional conceptualization of onset, at one end of the con- tinuum lie children who display declines so early that they are difficult to measure and symptoms appear to have always been present. At the other end of the continuum are children who experience losses so late, when more skills have been acquired and thus there are more skills to lose, that the regression appears quite overt and dramatic. We propose that variable timing of these processes across children leads to symp- toms exceeding the threshold for diagnosis at different points in the first 3 years of life, resulting in a distributed curve of onset timing. 3.3. Simplex v. multiplex samples
- 30. An important question to consider is whether regression in infant sibling samples is representative of regression in children with ASD who are the first in their families to be diagnosed with the condition. If symptoms emerge differently in multiplex and simplex families, then the insights about onset afforded by prospective research may not be applicable to the general population of children with ASD. For example, perhaps children in multiplex families are more likely to experience a regression than children from simplex families, accounting for the higher rates of decline apparent in prospective studies. We have no reason to believe this is the case. In fact, the rate of retrospectively- reported regression in multiplex families has been reported to be similar or lower than in simplex families (Boterberg et al., 2019b; Parr et al., 2011), failing to account for the high rates apparent in infant sibling studies, whose participants are, by definition, from multiplex families. A related issue is that parents participating in infant si bling investiga- tions have an older child with ASD. It is possible that these parents may be different reporters than other parents, given their previous experi- ence with ASD. This may make them more astute observers of
- 31. devel- opment than parents in the general population and therefore more likely to recognize skill decline. This hypothesis, however, is not sup- ported by the data presented earlier in this review in which parents in multiplex families also under-report skill loss (Landa et al., 2013; Ozonoff et al., 2010, 2018a, 2018b). Nevertheless, it is important to keep these cautions in mind in interpreting the extant data on onset patterns. Validating these results in different kinds of samples, such as community-based epidemiological cohorts or other high-risk groups like very preterm infants, will be critical. 3.4. Improving the measurement of onset Collectively, the studies reviewed in this paper present significant concerns about the accuracy of the most widely used methods of measuring regression, that is, retrospective parent report, and argue against their widespread use. The challenge currently faced by the field is that there are no practical alternative strategies to parent report for characterizing onset status. The time-intensive process and cost of home videotape analysis is prohibitive for large samples. Future studies will continue to rely on retrospective data, of necessity, since inclusion
- 32. criteria for most samples require a confirmed ASD diagnosis (i.e., not Fig. 4. Latent classes of social engagement, demonstrating declining trajectories in the majority of children developing ASD, Cohorts 2 and 3. Panel A: Examiner ratings, Panel B: Parent ratings. S. Ozonoff and A.-M. Iosif Neuroscience and Biobehavioral Reviews 100 (2019) 296–304 301 prospective data). Several strategies have been proposed to improve reporting (Ayhan and Isiksal, 2005). To minimize comprehension or interpretation pro- blems, it is recommended that further specific information about the behavior in question be provided. ASD screening instruments have begun to incorporate video to improve accuracy (Marrus et al., 2018; Smith et al., 2017) and this strategy could be adapted to improve re- porting of onset patterns. For example, longitudinal video of a child experiencing skill loss could be shown to parents to illustrate the kinds of changes in behavior that define regression. To minimize recall pro- blems, the simplest approach, and the one shown to have the
- 33. best va- lidity, is to ask respondents to consult relevant records prior to com- pleting the interview (Ayhan and Isiksal, 2005). Parents could, for example, review entries in baby books or journals or watch home video of the child prior to the interview. Another approach is to link reporting to key events in the respondent’s life by creating a detailed timeline and context that assist recall of specific details (Loftus and Marburger, 1983). This method has already been used by Werner et al. (2005) to improve recall of early development in ASD and it could be further adapted for reporting about onset patterns. Whether these methods will enhance the validity of parent report of onset remains to be seen and would be a fruitful area of future study. For further discussion, see also Boterberg et al. (2019a). 3.5. Validity of previous studies of regression The studies reviewed in this paper call into serious question the validity of previous studies of regression, which have, of necessity and the lack of alternatives, relied upon retrospective measures. Refining methods of studying the onset of ASD has the potential to transform research programs on etiological factors that contribute to the devel-
- 34. opment of ASD by providing more precise and accurate measurements of an important phenotype (Barbaresi, 2016; Thurm et al ., 2018). A better understanding of the inflection points at which development diverges from a typical trajectory to an autism trajectory could be highly informative to the search for risk factors. Better measures of onset are urgently needed for etiologic studies, which have been hin- dered already by the tremendous heterogeneity of the autism pheno- type (Constantino and Charman, 2016). Many recent studies have ex- amined whether onset types are associated with potential etiologic factors and biological correlates, such as brain growth (Nordahl et al., 2011; Valvo et al., 2016), seizures (Barger et al., 2017), vaccinations (Goin-Kochel et al., 2016), gastrointestinal problems (Downs et al., 2014; Richler et al., 2006), immunological function (Scott et al., 2017; Wasilewska et al., 2012), and genetic and genomic variations (Goin- Kochel et al., 2017; Gupta et al., 2017; Parr et al., 2011), including mitochondrial and MeCP2 mutations (Shoffner et al., 2010; Veeraragavan et al., 2016; Xi et al., 2007). So far, none of these factors has been firmly associated with onset patterns. This may be due to the errors that are likely to have occurred in the classifications of
- 35. onset done in these studies. Clearly, examining the biological underpinnings of an imprecise measure is problematic. In a review of autism genetics, one of the major priorities identified for future research is the characterization of ASD subtypes to relate to genetic variations (Geschwind, 2011). As more and more risk genes for ASD are identified, the common molecular pathways that these genes share are becoming understood, with some expressed early in neuro- biological development and others later (Konopka et al., 2012). A twin study (Hallmayer et al., 2011) suggested a greater role for environ- mental factors in ASD than previously appreciated. A more precise timing of first symptom emergence would enhance identification of etiological factors and when they might operate, with potential im- plications for intervention and prevention. 4. Clinical implications Finally, the studies reviewed here provide hope and promise for improvements in screening, early diagnosis, and treatment. Many pro- spective studies (e.g., Bosl et al., 2018; Jones and Klin, 2013; Ozonoff et al., 2010) used measures, such as behavioral coding, eye tracking,
- 36. and EEG, that are expensive, labor intensive, and not practical for routine use. Studies reviewed in this paper, however, have demon- strated that prospective parent report can identify declining trajectories of development (Ozonoff et al., 2018b; Parikh et al., 2018), as long as the instruments focus on early-appearing social behaviors, present in the first year of life, that have the potential to demonstrate decreases over time as ASD signs emerge. Brief rating scales of this type, ad- ministered longitudinally at regular well-child health care visits, could provide a clinically feasible and cost-effective screening tool capable of detecting declines over time. We hypothesize that dynamic screening, which utilizes longitudi nal screenings over time and comparison of scores across ages to identify declining trajectories, will improve identification over static, cross-sectional screenings examining whether a single score at a single age exceeds a cutoff. This approach has been successfully used in identifying Rett syndrome (RTT), where head cir- cumference is normal at birth, followed by deceleration of head growth between 5 months and 4 years (Hagberg et al., 2001; Tarquinio et al., 2012). Through the development of RTT-specific growth references
- 37. throughout early childhood, based on mapping head circumference trajectories, diagnosis of RTT has been possible at earlier ages (Schultz et al., 1993; Tarquinio et al., 2012). We (Ozonoff et al., 2010, 2018b) and others (Landa et al., 2013; Pearson et al., 2018; Thomas et al., 2009) have suggested that this kind of dimensional, trajectory- based methodological approach, percentiling social and communication milestones as we percentile other growth parameters, could be applied to detect ASD early. Prospective studies have repeatedly demonstrated that develop- mental declines follow a period in the first year of life when socio- communicative skills are largely intact. Such early intact skills can be capitalized upon in treatment, presenting opportunities for preventive intervention when the brain is rapidly developing and maximally malleable. For many years, the holy grail has been finding a marker present prior to symptom emergence, thus affording the possibility of earlier, possibly preventative, treatment during the prodromal period. If the prospective methods described in this paper can be harnessed to identify infants at risk for ASD, during the decline of skills, rather than after the decline was over, it might be possible to disrupt these
- 38. trajec- tories prior to the full onset of symptoms (Dawson, 2011). Children could be provided immediate access to infant interventions (Fein et al., 2016; Rogers et al., 2014), capitalizing on still-preserved skills and harnessing the brain plasticity of early infancy to improve outcomes, lessen disability, and perhaps, prevent the full disorder from devel- oping. Conflict of interest The authors have no competing interests to declare. Acknowledgments This work was supported by NIH grants R01 MH068398 (Ozonoff) and R01 MH099046 (Ozonoff). Thank you to Sofie Boterberg for her reading of an earlier version of this manuscript. We are deeply grateful to all the children and parents who participated in and showed sus- tained commitment to our longitudinal program of research. References Andrews, N., Miller, E., Taylor, B., Lingam, R., Simmons, A., Stowe, J., et al., 2002. Recall bias, MMR, and autism. Arch. Diseases Childhood 87, 493–494. S. Ozonoff and A.-M. Iosif Neuroscience and Biobehavioral
- 39. Reviews 100 (2019) 296–304 302 http://refhub.elsevier.com/S0149-7634(18)30721-8/sbref0005 http://refhub.elsevier.com/S0149-7634(18)30721-8/sbref0005 Ayhan, H.O., Isiksal, S., 2005. Memory recall errors in retrospective surveys: a reverse record check study. Qual. Quant. 38, 475–493. Barbaresi, W.J., 2016. Commentary: the meaning of “regression” in children with autism spectrum disorder: why does it matter? J. Dev. Behav. Pediatr. 37, 506–507. Barger, B.D., Campbell, J.M., McDonough, J.D., 2013. Prevalence and onset of regression within autism spectrum disorders: a meta-analytic review. J. Autism Dev. Disord. 43, 817–828. Barger, B.D., Campbell, J., Simmons, C., 2017. The relationship between regression in autism spectrum disorder, epilepsy, and atypical epileptiform EEGs: a meta-analytic review. J. Intellect. Dev. Disabil. 42, 45–60. Bedford, R., Elsabbagh, M., Gliga, T., Pickles, A., Senju, A., et al., 2012. Precursors to social and communication difficulties in infants at-risk for autism: gaze following and attentional engagement. J. Autism Dev. Disord. 42, 2208–2218. Bölte, S., Marschik, P.B., Falck-Ytter, T., Charman, T.,
- 40. Roeyers, H., et al., 2013. Infants at risk for autism: a European perspective on current status, challenges, and opportu- nities. Eur. Child Adolesc. Psychiatry 22, 341–348. Bosl, W.J., Tager-Flusberg, H., Nelson, C.A., 2018. EEG analytics for early detection of autism spectrum disorder: a data-driven approach. Sci. Rep. 8, 6828. Boterberg, S., Charman, T., Marschik, P., Bolte, S., Roeyers, H., 2019a. Regression in Autism Spectrum Disorder: Characteristics, Etiology, Early Development, and Outcomes – a Review of Retrospective Studies (this issue). . Boterberg, S., Van Coster, R., Roeyers, H., 2019b. The Clinical Contribution of Parent Reported Regression in Autism Spectrum Disorder: Characteristics, Early Development, and Later Outcomes (under review). . Brignell, A., Williams, K., Prior, M., Donath, S., Reilly, S., et al., 2017. Parent-reported patterns of loss and gain in communica tion in 1- to 2-year-old children are not unique to autism spectrum disorder. Autism 21, 344–356. Centers for Disease Control and Prevention, 2018. Prevalence of autism spectrum disorder among children aged 8 years – autism and developmental disabilities monitoring network, 11 sites, United States, 2014. MMWR Surv. Summary 67, 1–23. Constantino, J.N., Charman, T., 2016. Diagnosis of autism
- 41. spectrum disorder: reconciling the syndrome, its diverse origins, and variation in expression. Lancet Neurol. 15, 279–291. Constantino, J.N., Zhang, Y., Frazier, T., Abbacchi, A.M., Law, P., 2010. Sibling recur- rence and the genetic epidemiology of autism. Am. J. Psychiatry 167, 1349–1356. Dawson, G., 2011. Editorial: coming closer to describing the variable onset patterns in autism. J. Am. Acad. Child Adolesc. Psychiatry 50, 744–746. Downs, R., Perna, J., Vitelli, A., et al., 2014. Model-based hypothesis of gut microbe populations and gut-brain barrier permeability in the development of regressive autism. Med. Hypotheses 83, 649–655. Elsabbagh, M., Fernandes, J., Webb, S.J., Dawson, G., Charman, T., et al., 2013. Disengagement of visual attention in infancy is associated with emerging autism in toddlerhood. Biol. Psychiatry 74, 189–194. Fein, D., Helt, M., Brennan, L., Barton, M., 2016. The Activity Kit for Babies and Toddlers at Risk: How to Use Everyday Routines to Build Social and Communication Skills. Guilford Press, New York, NY. Finney, H.C., 1981. Improving the reliability of retrospective survey measures: results of a longitudinal field survey. Eval. Rev. 5, 207–229.
- 42. Gammer, I., Bedford, R., Elsabbagh, M., Garwood, H., Pasco, G., Tucker, L., et al., 2015. Behavioral markers for autism in infancy: Scores on the Autism Observational Scale for Infants in a prospective study of at-risk siblings. Infant Behav. Dev. 38, 107–115. Geschwind, D.H., 2011. Genetics of autism spectrum disorders. Trends Cogn. Sci. (Regul. Ed.) 15, 409–416. Goin-Kochel, R.P., Mire, S.S., Dempsey, A.G., et al., 2016. Parental report of vaccine re- ceipt in children with autism spectrum disorder: do rates differ by pattern of ASD onset? Vaccine 34, 1335–1342. Goin-Kochel, R.P., Trinh, S., Barber, S., Bernier, R., 2017. Gene disrupting mutations associated with regression in autism spectrum disorder. J. Autism Dev. Disord. 47, 3600–3607. Goldberg, W.A., Thorsen, K.L., Osann, K., Spence, M.A., 2008. Use of home videotapes to confirm parental reports of regression in autism. J. Autism Dev. Disord. 38, 1136–1146. Gupta, A.R., Westphal, A., Yang, D.Y., Sullivan, C.A., Eilbott, J., et al., 2017. Neurogenetic analysis of childhood disintegrative disorder. Mol. Autism 8, 19. Hagberg, G., Stenbom, Y., Engerstrom, I.W., 2001. Head grown in Rett syndrome. Brain
- 43. Dev. 23 (Supplement), S227–S229. Hallmayer, J., Cleveland, S., Torres, A., Phillips, J., Cohen, B., et al., 2011. Genetic heritability and shared environmental factors among twin pairs with autism. Arch. Gen. Psychiatry 68, 1095–1102. Hansen, R.L., Ozonoff, S., Krakowiak, P., Angkustsiri, K., Jones, C., et al., 2008. Regression in autism: prevalence and associated factors in the CHARGE study. Ambul. Pediatr. 8, 25–31. Havdahl, A., Bishop, S., Farmer, C., Schjolberg, S., Bresnahan, M., et al., 2018. Loss of Social-communication Skills and Outcomes During Childhood in a Large General Population Cohort. Paper presented at the International Society for Autism Research meeting, Rotterdam. Henry, B., Moffitt, T.E., Caspi, A., Langley, J., Silva, P.A., 1994. On the “remembrance of things past.” A longitudinal evaluation of the retrospective method. Psychol. Assess. 6, 92–101. Hus, V., Taylor, A., Lord, C., 2011. Telescoping of caregiver report on the autism diag- nostic interview-revised. J. Child Psychol. Psychiatry 52, 753– 760. Inada, N., Kamio, Y., Koyama, T., 2010. Developmental chronology of preverbal social behaviors in infancy using the M-CHAT: baseline for early
- 44. detection of atypical social development. Res. Autism Spectr. Disord. 4, 605–611. Jones, W., Klin, A., 2013. Attention to eyes is present but in decline in 2 to 6 month old infants later diagnosed with autism. Nature 504, 427–431. Jones, E.J.H., Gliga, T., Bedford, R., Charman, T., Johnson, M.H., 2014. Developmental pathways to autism: a review of prospective studies of infants at risk. Neurosci. Biobehav. Rev. 39, 1–33. Kanner, L., 1943. Autistic disturbances of affective contact. Nerv. Child 2, 217–250. Kern, J.K., Geier, D.A., Geier, M.R., 2015. Evaluation of regression in autism spectrum disorder based on parental reports. N. Am. J. Med. Sci. 6, 41– 47. Konopka, G., Wexler, E., Rosen, E., Mukamel, Z., Osborn, G.E., et al., 2012. Modeling the functional genomics of autism using human neurons. Mol. Psychiatry 17, 202–214. Landa, R., Garrett-Mayer, E., 2006. Development in infants with autism spectrum dis- orders: a prospective study. J. Child Psychol. Psychiatry 47, 629–638. Landa, R.J., Stuart, E.A., Gross, A.L., Faherty, A., 2013. Developmental trajectories in children with and without autism spectrum disorders: the first 3 years. Child Dev. 84, 429–442.
- 45. Le Couteur, A., Lord, C., Rutter, M., 2003. Autism Diagnostic Interview-Revised (ADI-R). Western Psychological Services, Los Angeles. Loftus, E.F., Marburger, W., 1983. Since the eruption of Mt. St. Helens, has anyone beaten you up? Improving the accuracy of retrospective reports with landmark events. Mem. Cognit. 11, 114–120. Lord, C., Shulman, C., DiLavore, P., 2004. Regression and word loss in autistic spectrum disorders. J. Child Psychol. Psychiatry 45, 936–955. Marrus, N., Kennon-McGill, S., Harris, B., Zhang, Y., Glowinski, A.L., et al., 2018. Use of a video scoring anchor for rapid serial assessment of social communication in toddlers. J. Vis. Exp. 133, 57041. https://doi.org/10.3791/57041. Muthen, B., 2004. Latent variable analysis: growth mixture modeling and related tech- niques for longitudinal data. In: Kaplan, D. (Ed.), Handbook of Quantitative Methodology for the Social Sciences. Sage Publications, Thousand Oaks, CA, pp. 345–368. Nordahl, C.W., Lange, N., Li, D.D., et al., 2011. Brain enlargement is associated with regression in preschool-age boys with autism spectrum disorders. Proc. Natl. Acad. Sci. 108, 20195–20200. Ozonoff, S., Williams, B.J., Landa, R., 2005. Parental report of
- 46. the early development of children with regressive autism: the “delays-plus-regression” phenotype. Autism 9, 495–520. Ozonoff, S., Iosif, A., Baguio, F., Cook, I.C., Hill, M.M., et al., 2010. A prospective study of the emergence of early behavioral signs of autism. J. Am. Acad. Child Adolesc. Psychiatry 49, 258–268. Ozonoff, S., Iosif, A., Young, G.S., Hepburn, S., Thompson, M., et al., 2011a. Onset pat- terns in autism: correspondence between home video and parent report. J. Am. Acad. Child Adolesc. Psychiatry 50, 796–806. Ozonoff, S., Young, G.S., Carter, A., Messinger, D., Yirmiya, N., et al., 2011b. Recurrence risk for autism spectrum disorders: a Baby Siblings Research Consortium study. Pediatrics 128, e488–e495. Ozonoff, S., Li, D., Deprey, L., Hanzel, E.P., Iosif, A., 2018a. Reliability of parent recall of ASD symptom onset and timing. Autism 22, 891–896. Ozonoff, S., Gangi, D., Hanzel, E.P., Hill, A., Hill, M.M., et al., 2018b. Onset patterns in autism: variation across informants, methods, and timing. Autism Res. 11, 788–797. Palomo, R., Belinchon, M., Ozonoff, S., 2006. Autism and family home movies: a com- prehensive review. J. Dev. Behav. Pediatr. 27 (Supplement), S59–S68.
- 47. Parikh, C., Iosif, A., Ozonoff, S., 2018. A longitudinal examination of onset patterns and developmental trajectories among infant siblings of children with autism spectrum disorder. Paper Presented at the Annual Gatlinburg Conference. Parr, J.R., LeCouteur, A., Baird, G., Rutter, M., Pickles, A., the International Molecular Genetic Study of Autism Consortium, et al., 2011. Early developmental regression in ASD: evidence from an international multiplex sample. J. Autism Dev. Disord. 41, 332–340. Pearson, N., Charman, T., Happe, F., Bolton, P.F., McEwen, F.S., 2018. Regression in autism spectrum disorder: reconciling findings from retrospective and prospective research. Autism Res. 11, 1602–1620. Pickles, A., Pickering, K., Taylor, C., 1996. Reconciling recalled dates of developmental milestones, events and transitions: a mixed generalized linear model with random mean and variance functions. J. R. Stat. Soc. Ser. A Stat. Soc. 159 (Part 2), 225–234. Pickles, A., Simonoff, E., Conti-Ramsden, G., Falcaro, M., Simkin, Z., et al., 2009. Loss of language in early development of autism and specific language impairment. J. Child Psychol. Psychiatry 50, 843–852. Richler, J., Luyster, R., Risi, S., Hsu, W., Dawson, G., et al., 2006. Is there a ‘regressive
- 48. phenotype’ of autism spectrum disorder associated with the measles-mumps-rubella vaccine? A CPEA study. J. Autism Dev. Disord. 36, 299–316. Rogers, S.J., 2009. What are infant siblings teaching us about autism in infancy? Autism Res. 2, 125–137. Rogers, S.J., Vismara, L., Wagner, A.L., McCormick, C., Young, G., Ozonoff, S., 2014. Autism treatment in the first year of life: a pilot study of Infant Start, a parent-im- plemented intervention for symptomatic infants. J. Autism Dev. Disord. 44, 2981–2995. Rozga, A., Hutman, T., Young, G.S., Rogers, S.J., Ozonoff, S., Dapretto, M., Sigman, M., 2011. Behavioral profiles of affected and unaffected siblings of children with autism in the first year of life: contributions of measures of mother - infant interaction and triadic communication. J. Autism Dev. Disord. 41, 287–301. Schultz, R.J., Glaze, D.G., Motil, K.J., Armstrong, D.D., del Junco, D.J., et al., 1993. The pattern of growth failure in Rett syndrome. Am. J. Dis. Child. 147, 633–637. Scott, O., Shi, D., Andriashek, D., Clark, B., Goez, H.R., 2017. Clinical clues for auto- immunity and neuroinflammation in patients with autistic regression. Dev. Med. Child Neurol. 59, 947–951. Shoffner, J., Hyams, L., Langley, G.N., Cossette, S.,
- 49. Mylacraine, L., et al., 2010. Fever plus mitochondrial disease could be risk factors for autistic regression. J. Child Neurol. 25, 429–434. Shumway, S., Thurm, A., Swedo, S.E., Deprey, L., Barnett, L.A., Amaral, D.G., Rogers, S.J., S. Ozonoff and A.-M. Iosif Neuroscience and Biobehavioral Reviews 100 (2019) 296–304 303 http://refhub.elsevier.com/S0149-7634(18)30721-8/sbref0010 http://refhub.elsevier.com/S0149-7634(18)30721-8/sbref0010 http://refhub.elsevier.com/S0149-7634(18)30721-8/sbref0015 http://refhub.elsevier.com/S0149-7634(18)30721-8/sbref0015 http://refhub.elsevier.com/S0149-7634(18)30721-8/sbref0020 http://refhub.elsevier.com/ S0149-7634(18)30721-8/sbref0020 http://refhub.elsevier.com/S0149-7634(18)30721-8/sbref0020 http://refhub.elsevier.com/S0149-7634(18)30721-8/sbref0025 http://refhub.elsevier.com/S0149-7634(18)30721-8/sbref0025 http://refhub.elsevier.com/S0149-7634(18)30721-8/sbref0025 http://refhub.elsevier.com/S0149-7634(18)30721-8/sbref0030 http://refhub.elsevier.com/S0149-7634(18)30721-8/sbref0030 http://refhub.elsevier.com/S0149-7634(18)30721-8/sbref0030 http://refhub.elsevier.com/S0149-7634(18)30721-8/sbref0035 http://refhub.elsevier.com/S0149-7634(18)30721-8/sbref0035 http://refhub.elsevier.com/S0149-7634(18)30721-8/sbref0035 http://refhub.elsevier.com/S0149-7634(18)30721-8/sbref0040 http://refhub.elsevier.com/S0149-7634(18)30721-8/sbref0040 http://refhub.elsevier.com/S0149-7634(18)30721-8/sbref0045 http://refhub.elsevier.com/S0149-7634(18)30721-8/sbref0045 http://refhub.elsevier.com/S0149-7634(18)30721-8/sbref0045 http://refhub.elsevier.com/S0149-7634(18)30721-8/sbref0050 http://refhub.elsevier.com/S0149-7634(18)30721-8/sbref0050
- 54. http://refhub.elsevier.com/S0149-7634(18)30721-8/sbref0320 http://refhub.elsevier.com/S0149-7634(18)30721-8/sbref0320 http://refhub.elsevier.com/S0149-7634(18)30721-8/sbref0325 Ozonoff, S., 2011. Symptom onset patterns and functional outcomes in young chil- dren with autism spectrum disorders. J. Autism Dev. Disord. 41, 1727–1732. Smith, C.J., Rozga, A., Matthews, N., Oberleitner, R., Nazneen, N., et al., 2017. Investigating the accuracy of a novel telehealth diagnostic approach for autism spectrum disorder. Psychol. Assess. 29, 245–252. Szatmari, P., Chawarska, K., Dawson, G., Georgiades, S., Landa, R., et al., 2016. Prospective longitudinal studies of infant siblings of children with autism: lessons learned and future directions. J. Am. Acad. Child Adolesc. Psychiatry 55, 179–187. Tarquinio, D.C., Motil, K.J., Hou, W., Lee, H.S., Glaze, D.G., et al., 2012. Growth failure and outcome in Rett syndrome: specific growth references. Neurology 79, 1653–1661. Thomas, M.S.C., Annaz, D., Ansari, D., Scerif, G., Jarrold, C., Karmiloff-Smith, A., 2009. Using developmental trajectories to understand developmental disorders. J. Speech Lang. Hear. Res. 52, 336–358. Thurm, A., Manwaring, S.S., Luckenbaugh, D.A., Lord, C.,
- 55. Swedo, S.E., 2014. Patterns of skill attainment and loss in young children with autism. Dev. Psychopathol. 26, 203–214. Thurm, A., Powell, E.M., Neul, J.L., Wagner, A., Zwaigenbaum, L., 2018. Loss of skills and onset patterns in neurodevelopmental disorders: understanding the neurobiological mechanisms. Autism Res. 11, 212–222. Valvo, G., Baldini, S., Retico, A., et al., 2016. Temporal lobe connects regression and macrocephaly to autism spectrum disorders. Eur. Child Adolesc. Psychiatry 25, 421–429. Veeraragavan, S., Wan, Y.W., Connolly, D.R., Hamilton, S.M., Ward, C.S., et al., 2016. Loss of MeCP2 in the rat models regression, impaired sociability and transcriptional deficits of Rett syndrome. Hum. Mol. Genet. 25, 3284–3302. Wan, M.W., Green, J., Elsabbagh, M., Johnson, M., Charman, T., et al., 2013. Quality of interaction between at-risk infants and caregivers at 12-15 months is associated with 3-year autism outcome. J. Child Psychol. Psychiatry 54, 763– 771. Wasilewska, J., Kaczmarski, M., Stasiak-Barmuta, A., Tobolczyk, J., Kowalewska, E., 2012. Low serum IgA and increased expression of CD23 on B lymphocytes in per- ipheral blood in children with regressive autism aged 3-6 years
- 56. old. Arch. Med. Sci. 8, 324–331. Werner, E., Dawson, G., 2005. Validation of the phenomenon of autistic regression using home videotapes. Arch. Gen. Psychiatry 62, 889–895. Werner, E., Dawson, G., Munson, J., Osterling, J., 2005. Variation in early developmental course in autism and relation with behavioral outcome at 3-4 years of age. J. Autism Dev. Disord. 35, 337–350. Wetherby, A., Prizant, B., 2002. Communication and Symbolic Behavior Scales Developmental Profile–First Normed Edition. Paul H. Brookes, Baltimore. Wolff, J.J., Botteron, K.N., Dager, S.R., Elison, J.T., Estes, A.M., et al., 2014. Longitudinal patterns of repetitive behavior in toddlers with autism. J. Child Psychol. Psychiatry 55, 945–953. Xi, C.Y., Ma, H.W., Lu, Y., Zhao, Y.J., Hua, T.Y., Zhao, Y., Ji, Y.H., 2007. MeCP2 gene mutation analysis in autistic boys with developmental regression. Psychiatr. Genet. 17, 113–116. Zwaigenbaum, L., Bryson, S., Rogers, T., Roberts, W., Brian, J., Szatmari, P., 2005. Behavioral manifestations of autism in the first year of life. Int. J. Dev. Neurosci. 23, 143–152.
- 57. S. Ozonoff and A.-M. Iosif Neuroscience and Biobehavioral Reviews 100 (2019) 296–304 304 http://refhub.elsevier.com/S0149-7634(18)30721-8/sbref0325 http://refhub.elsevier.com/S0149-7634(18)30721-8/sbref0325 http://refhub.elsevier.com/S0149-7634(18)30721-8/sbref0330 http://refhub.elsevier.com/S0149-7634(18)30721-8/sbref0330 http://refhub.elsevier.com/S0149-7634(18)30721-8/sbref0330 http://refhub.elsevier.com/S0149-7634(18)30721-8/sbref0335 http://refhub.elsevier.com/S0149-7634(18)30721-8/sbref0335 http://refhub.elsevier.com/S0149-7634(18)30721-8/sbref0335 http://refhub.elsevier.com/S0149-7634(18)30721-8/sbref0340 http://refhub.elsevier.com/S0149-7634(18)30721-8/sbref0340 http://refhub.elsevier.com/S0149-7634(18)30721-8/sbref0340 http://refhub.elsevier.com/S0149-7634(18)30721-8/sbref0345 http://refhub.elsevier.com/S0149-7634(18)30721-8/sbref0345 http://refhub.elsevier.com/S0149-7634(18)30721-8/sbref0345 http://refhub.elsevier.com/S0149-7634(18)30721-8/sbref0350 http://refhub.elsevier.com/S0149-7634(18)30721-8/sbref0350 http://refhub.elsevier.com/S0149-7634(18)30721-8/sbref0350 http://refhub.elsevier.com/S0149-7634(18)30721-8/sbref0355 http://refhub.elsevier.com/S0149-7634(18)30721-8/sbref0355 http://refhub.elsevier.com/S0149-7634(18)30721-8/sbref0355 http://refhub.elsevier.com/ S0149-7634(18)30721-8/sbref0360 http://refhub.elsevier.com/S0149-7634(18)30721-8/sbref0360 http://refhub.elsevier.com/S0149-7634(18)30721-8/sbref0360 http://refhub.elsevier.com/S0149-7634(18)30721-8/sbref0365 http://refhub.elsevier.com/S0149-7634(18)30721-8/sbref0365 http://refhub.elsevier.com/S0149-7634(18)30721-8/sbref0365 http://refhub.elsevier.com/S0149-7634(18)30721-8/sbref0370 http://refhub.elsevier.com/S0149-7634(18)30721-8/sbref0370 http://refhub.elsevier.com/S0149-7634(18)30721-8/sbref0370 http://refhub.elsevier.com/S0149-7634(18)30721-8/sbref0375 http://refhub.elsevier.com/S0149-7634(18)30721-8/sbref0375
- 58. http://refhub.elsevier.com/S0149-7634(18)30721-8/sbref0375 http://refhub.elsevier.com/S0149-7634(18)30721-8/sbref0375 http://refhub.elsevier.com/S0149-7634(18)30721-8/sbref0380 http://refhub.elsevier.com/S0149-7634(18)30721-8/sbref0380 http://refhub.elsevier.com/S0149-7634(18)30721-8/sbref0385 http://refhub.elsevier.com/S0149-7634(18)30721-8/sbref0385 http://refhub.elsevier.com/S0149-7634(18)30721-8/sbref0385 http://refhub.elsevier.com/S0149-7634(18)30721-8/sbref0390 http://refhub.elsevier.com/S0149-7634(18)30721-8/sbref0390 http://refhub.elsevier.com/S0149-7634(18)30721-8/sbref0395 http://refhub.elsevier.com/S0149-7634(18)30721-8/sbref0395 http://refhub.elsevier.com/S0149-7634(18)30721-8/sbref0395 http://refhub.elsevier.com/S0149-7634(18)30721-8/sbref0400 http://refhub.elsevier.com/S0149-7634(18)30721-8/sbref0400 http://refhub.elsevier.com/S0149-7634(18)30721-8/sbref0400 http://refhub.elsevier.com/S0149-7634(18)30721-8/sbref0405 http://refhub.elsevier.com/S0149-7634(18)30721-8/sbref0405 http://refhub.elsevier.com/S0149-7634(18)30721- 8/sbref0405Changing conceptualizations of regression: What prospective studies reveal about the onset of autism spectrum disorderIntroductionMethods for measuring onset patternsProspective studies of onsetFindings from the University of California Davis infant sibling studyBehavioral coding of social-communication ratesObserver ratings of social engagementLongitudinal parent ratings of social behaviorGrowth curve modeling approaches to determining onset classificationsConcordance between retrospective and prospective onset classificationsConclusions and theoretical implicationsOnset involves declining social developmentRegression in ASD is the Rule, not the exceptionSimplex v. multiplex samplesImproving the measurement of onsetValidity of previous studies of regressionClinical implicationsConflict of interestAcknowledgmentsReferences
- 59. Human Resource ManagementHuman Resource Management Human Resource ManagementHuman Resource Management [AUTHOR REMOVED AT REQUEST OF ORIGINAL PUBLISHER] U N I V E R S I T Y O F M I N N E S O T A L I B R A R I E S P U B L I S H I N G E D I T I O N , 2 0 1 6 . T H I S E D I T I O N A D A P T E D F R O M A W O R K O R I G I N A L L Y P R O D U C E D I N 2 0 1 1 B Y A P U B L I S H E R W H O H A S R E Q U E S T E D T H A T I T N O T R E C E I V E A T T R I B U T I O N . M I N N E A P O L I S , M N Human Resource Management by University of Minnesota is licensed under a Creative Commons Attribution- NonCommercial-ShareAlike 4.0 International License, except where otherwise noted. http://creativecommons.org/licenses/by-nc-sa/4.0/ http://creativecommons.org/licenses/by-nc-sa/4.0/ http://open.lib.umn.edu/humanresourcemanagement http://creativecommons.org/licenses/by-nc-sa/4.0/ http://creativecommons.org/licenses/by-nc-sa/4.0/
- 60. Contents Publisher Information viii Chapter 1: The Role of Human Resources 1.1 What Is Human Resources? 2 1.2 Skills Needed for HRM 11 1.3 Today’s HRM Challenges 16 1.4 Cases and Problems 27 Chapter 2: Developing and Implementing Strategic HRM Plans 2.1 Strategic Planning 31 2.2 Writing the HRM Plan 41 2.3 Tips in HRM Planning 49 2.4 Cases and Problems 53 Chapter 3: Diversity and Multiculturalism 3.1 Diversity and Multiculturalism 56 3.2 Diversity Plans 62 3.3 Multiculturalism and the Law 70 3.4 Cases and Problems 79 Chapter 4: Recruitment 4.1 The Recruitment Process 82 4.2 The Law and Recruitment 91 4.3 Recruitment Strategies 97 4.4 Cases and Problems 109 Chapter 5: Selection
- 61. 5.1 The Selection Process 113 5.2 Criteria Development and Résumé Review 118 5.3 Interviewing 124 5.4 Testing and Selecting 132 5.5 Making the Offer 139 5.6 Cases and Problems 142 Chapter 6: Compensation and Benefits 6.1 Goals of a Compensation Plan 147 6.2 Developing a Compensation Package 151 6.3 Types of Pay Systems 155 6.4 Other Types of Compensation 170 6.5 Cases and Problems 182 Chapter 7: Retention and Motivation 7.1 The Costs of Turnover 187 7.2 Retention Plans 193 7.3 Implementing Retention Strategies 207 7.4 Cases and Problems 218 Chapter 8: Training and Development 8.1 Steps to Take in Training an Employee 224 8.2 Types of Training 230 8.3 Training Delivery Methods 237 8.4 Designing a Training Program 244 8.5 Cases and Problems 261 Chapter 9: Successful Employee Communication 9.1 Communication Strategies 267 9.2 Management Styles 279 9.3 Cases and Problems 287
- 62. Chapter 10: Managing Employee Performance 10.1 Handling Performance 291 10.2 Employee Rights 308 10.3 Cases and Problems 319 Chapter 11: Employee Assessment 11.1 Performance Evaluation Systems 325 11.2 Appraisal Methods 332 11.3 Completing and Conducting the Appraisal 345 11.4 Cases and Problems 354 Chapter 12: Working with Labor Unions 12.1 The Nature of Unions 361 12.2 Collective Bargaining 373 12.3 Administration of the Collective Bargaining Agreement 380 12.4 Cases and Problems 385 Chapter 13: Safety and Health at Work 13.1 Workplace Safety and Health Laws 390 13.2 Health Hazards at Work 399 13.3 Cases and Problems 419 Chapter 14: International HRM 14.1 Offshoring, Outsourcing 424 14.2 Staffing Internationally 437 14.3 International HRM Considerations 442 14.4 Cases and Problems 459
- 63. Please share your supplementary material! 462 Publisher Information Human Resource Management is adapted from a work produced and distributed under a Creative Commons license (CC BY-NC-SA) in 2011 by a publisher who has requested that they and the original author not receive attribution. This adapted edition is produced by the University of Minnesota Libraries Publishing through the eLearning Support Initiative. This adaptation has reformatted the original text, and replaced some images and figures to make the resulting whole more shareable. This adaptation has not significantly altered or updated the original 2011 text. This work is made available under the terms of a Creative Commons Attribution-NonCommercial-ShareAlike license. viii http://www.lib.umn.edu/publishing http://www.lib.umn.edu/publishing https://www.lib.umn.edu/elearning
- 64. http://creativecommons.org/licenses/by-nc-sa/4.0/ Chapter 1: The Role of Human Resources Human Resource Management Day to DayHuman Resource Management Day to Day You have just been hired to work in the human resource department of a small company. You heard about the job through a conference you attended, put on by the Society for Human Resource Management (SHRM). Previously, the owner of the company, Jennifer, had been doing everything related to human resource management (HRM). You can tell she is a bit critical about paying a good salary for something she was able to juggle all on her own. On your first day, you meet the ten employees and spend several hours with the company owner, hoping to get a handle on which human resource processes are already set up. Shortly after the meeting begins, you see she has a completely different perspective of what HRM is, and you realize it will be your job to educate her on the value of a human resource manager. You look at it as a personal challenge—both to educate her and also to show her the value of this role in the organization. First, you tell her that HRM is a strategic process having to do with the staffing, compensation, retention, training,
- 65. and employment law and policies side of the business. In other words, your job as human resources (HR) manager will be not only to write policy and procedures and to hire people (the administrative role) but also to use strategic plans to ensure the right people are hired and trained for the right job at the right time. For example, you ask her if she knows what the revenue will be in six months, and Jennifer answers, “Of course. We expect it to increase by 20 percent.” You ask, “Have you thought about how many people you will need due to this increase?” Jennifer looks a bit sheepish and says, “No, I guess I haven’t gotten that far.” Then you ask her about the training programs the company offers, the software used to allow employees to access pay information online, and the compensation policies. She responds, “It looks like we have some work to do. I didn’t know that human resources involved all of that.” You smile at her and start discussing some of the specifics of the business, so you can get started right away writing the strategic human resource management plan. The Role of Human ResourcesThe Role of Human Resources (click to see video) The author introduces the chapter defining the role of human resource management.
- 66. 1 http://app.wistia.com/embed/medias/f325acb504 1.1 What Is Human Resources? Learning Objectives 1. Explain the role of HRM in organizations. 2. Define and discuss some of the major HRM activities. Every organization, large or small, uses a variety of capital to make the business work. Capital includes cash, valuables, or goods used to generate income for a business. For example, a retail store uses registers and inventory, while a consulting firm may have proprietary software or buildings. No matter the industry, all companies have one thing in common: they must have people to make their capital work for them. This will be our focus throughout the text: generation of revenue through the use of people’s skills and abilities. What Is HRM?What Is HRM? Human resource management (HRM) is the process of employing people, training them, compensating them, developing policies relating to them, and developing strategies to retain them. As a field, HRM has undergone
- 67. many changes over the last twenty years, giving it an even more important role in today’s organizations. In the past, HRM meant processing payroll, sending birthday gifts to employees, arranging company outings, and making sure forms were filled out correctly—in other words, more of an administrative role rather than a strategic role crucial to the success of the organization. Jack Welch, former CEO of General Electric and management guru, sums up the new role of HRM: “Get out of the parties and birthdays and enrollment forms.… Remember, HR is important in good times, HR is defined in hard times” (Frasch, et. al., 2010). It’s necessary to point out here, at the very beginning of this text, that every manager has some role relating to human resource management. Just because we do not have the title of HR manager doesn’t mean we won’t perform all or at least some of the HRM tasks. For example, most managers deal with compensation, motivation, and retention of employees—making these aspects not only part of HRM but also part of management. As a result, this book is equally important to someone who wants to be an HR manager and to someone who will manage a business.
- 68. 2 Human Resource RecallHuman Resource Recall Have you ever had to work with a human resource department at your job? What was the interaction like? What was the department’s role in that specific organization? The Role of HRMThe Role of HRM Keep in mind that many functions of HRM are also tasks other department managers perform, which is what makes this information important, despite the career path taken. Most experts agree on seven main roles that HRM plays in organizations. These are described in the following sections. StaffingStaffing You need people to perform tasks and get work done in the organization. Even with the most sophisticated machines, humans are still needed. Because of this, one of the major tasks in HRM is staffing. Staffing involves the entire hiring process from posting a job to negotiating a salary package. Within the staffing function, there are four main steps: 1. Development of a staffing plan. This plan allows HRM to see how many people they should hire based
- 69. on revenue expectations. 2. Development of policies to encourage multiculturalism at work. Multiculturalism in the workplace is becoming more and more important, as we have many more people from a variety of backgrounds in the workforce. 3. Recruitment. This involves finding people to fill the open positions. 4. Selection. In this stage, people will be interviewed and selected, and a proper compensation package will be negotiated. This step is followed by training, retention, and motivation. Development of Workplace PoliciesDevelopment of Workplace Policies Every organization has policies to ensure fairness and continuity within the organization. One of the jobs of HRM is to develop the verbiage surrounding these policies. In the development of policies, HRM, management, and executives are involved in the process. For example, the HRM professional will likely recognize the need for a policy or a change of policy, seek opinions on the policy, write the policy, and then communicate that policy to employees. It is key to note here that HR departments do not
- 70. and cannot work alone. Everything they do needs to involve all other departments in the organization. Some examples of workplace policies might be the following: • Discipline process policy • Vacation time policy • Dress code 1 . 1 W H A T I S H U M A N R E S O U R C E S ? • 3 • Ethics policy • Internet usage policy These topics are addressed further in Chapter 6 “Compensation and Benefits”, Chapter 7 “Retention and Motivation”, Chapter 8 “Training and Development”, and Chapter 9 “Successful Employee Communication”. Compensation and Benefits AdministrationCompensation and Benefits Administration HRM professionals need to determine that compensation is fair, meets industry standards, and is high enough to entice people to work for the organization. Compensation includes anything the employee receives for his or her work. In addition, HRM professionals need to make sure the pay is comparable to what other people performing
- 71. similar jobs are being paid. This involves setting up pay systems that take into consideration the number of years with the organization, years of experience, education, and similar aspects. Examples of employee compensation include the following: • Pay • Health benefits • 401(k) (retirement plans) • Stock purchase plans • Vacation time • Sick leave • Bonuses • Tuition reimbursement Since this is not an exhaustive list, compensation is discussed further in Chapter 6 “Compensation and Benefits”. RetentionRetention Retention involves keeping and motivating employees to stay with the organization. Compensation is a major factor in employee retention, but there are other factors as well. Ninety percent of employees leave a company for
- 72. the following reasons: 1. Issues around the job they are performing 2. Challenges with their manager 3. Poor fit with organizational culture 4. Poor workplace environment Despite this, 90 percent of managers think employees leave as a result of pay (Rivenbark, 2010). As a result, managers often try to change their compensation packages to keep people from leaving, when compensation isn’t 4 • H U M A N R E S O U R C E M A N A G E M E N T the reason they are leaving at all. Chapter 7 “Retention and Motivation” and Chapter 11 “Employee Assessment” discuss some strategies to retain the best employees based on these four factors. Training and DevelopmentTraining and Development Once we have spent the time to hire new employees, we want to make sure they not only are trained to do the job but also continue to grow and develop new skills in their job. This results in higher productivity for the organization. Training is also a key component in employee motivation. Employees who feel they are developing
- 73. their skills tend to be happier in their jobs, which results in increased employee retention. Examples of training programs might include the following: • Job skills training, such as how to run a particular computer program • Training on communication • Team-building activities • Policy and legal training, such as sexual harassment training and ethics training We address each of these types of training and more in detail in Chapter 8 “Training and Development”. Dealing with Laws Affecting EmploymentDealing with Laws Affecting Employment Human resource people must be aware of all the laws that affect the workplace. An HRM professional might work with some of these laws: • Discrimination laws • Health-care requirements • Compensation requirements such as the minimum wage • Worker safety laws • Labor laws
- 74. The legal environment of HRM is always changing, so HRM must always be aware of changes taking place and then communicate those changes to the entire management organization. Rather than presenting a chapter focused on HRM laws, we will address these laws in each relevant chapter. Worker ProtectionWorker Protection Safety is a major consideration in all organizations. Oftentimes new laws are created with the goal of setting federal or state standards to ensure worker safety. Unions and union contracts can also impact the requirements for worker safety in a workplace. It is up to the human resource manager to be aware of worker protection requirements and ensure the workplace is meeting both federal and union standards. Worker protection issues might include the following: • Chemical hazards 1 . 1 W H A T I S H U M A N R E S O U R C E S ? • 5 • Heating and ventilation requirements • Use of “no fragrance” zones
- 75. • Protection of private employee information We take a closer look at these issues in Chapter 12 “Working with Labor Unions” and Chapter 13 “Safety and Health at Work”. Figure 1.1 Caption: Knowing the law regarding worker protection is generally the job of human resources. In some industries it is extremely important; in fact, it can mean life or death. ReSurge International – Tom Davenport Operating On A Patient – CC BY-NC-ND 2.0. CommunicationCommunication Besides these major roles, good communication skills and excellent management skills are key to successful human resource management as well as general management. We discuss these issues in Chapter 9 “Successful Employee Communication”. Awareness of External FactorsAwareness of External Factors In addition to managing internal factors, the HR manager needs to consider the outside forces at play that may affect the organization. Outside forces, or external factors, are those things the company has no direct control
- 76. 6 • H U M A N R E S O U R C E M A N A G E M E N T http://open.lib.umn.edu/humanresourcemanagement/wp- content/uploads/sites/7/2015/10/1.1.0.jpg http://open.lib.umn.edu/humanresourcemanagement/wp- content/uploads/sites/7/2015/10/1.1.0.jpg https://www.flickr.com/photos/interplast/415854485/ over; however, they may be things that could positively or negatively impact human resources. External factors might include the following: 1. Globalization and offshoring 2. Changes to employment law 3. Health-care costs 4. Employee expectations 5. Diversity of the workforce 6. Changing demographics of the workforce 7. A more highly educated workforce 8. Layoffs and downsizing 9. Technology used, such as HR databases 10. Increased use of social networking to distribute information to employees For example, the recent trend in flexible work schedules
- 77. (allowing employees to set their own schedules) and telecommuting (allowing employees to work from home or a remote location for a specified period of time, such as one day per week) are external factors that have affected HR. HRM has to be aware of these outside issues, so they can develop policies that meet not only the needs of the company but also the needs of the individuals. Another example is the Patient Protection and Affordable Care Act, signed into law in 2010. Compliance with this bill has huge implications for HR. For example, a company with more than fifty employees must provide health-care coverage or pay a penalty. Currently, it is estimated that 60 percent of employers offer health-care insurance to their employees (Cappelli, 2010). Because health- care insurance will be mandatory, cost concerns as well as using health benefits as a recruitment strategy are big external challenges. Any manager operating without considering outside forces will likely alienate employees, resulting in unmotivated, unhappy workers. Not understanding the external factors can also mean breaking the law, which has a concerning set of implications as well. Figure 1.2
- 78. 1 . 1 W H A T I S H U M A N R E S O U R C E S ? • 7 An understanding of key external factors is important to the successful HR professional. This allows him or her to be able to make strategic decisions based on changes in the external environment. To develop this understanding, reading various publications is necessary. One way managers can be aware of the outside forces is to attend conferences and read various articles on the web. For example, the website of the Society for Human Resource Management, SHRM Online1, not only has job postings in the field but discusses many contemporary human resource issues that may help the manager make better decisions when it comes to people management. In Section 1.3 “Today’s HRM Challenges”, we go into more depth about some recent external issues that are affecting human resource management roles. In Section 1.1.2 “The Role of HRM”, we discuss some of the skills needed to be successful in HRM. Figure 1.3 8 • H U M A N R E S O U R C E M A N A G E M E N T http://open.lib.umn.edu/humanresourcemanagement/wp- content/uploads/sites/7/2015/03/38f44368950c5a67d7b2c29c536
- 79. 4b0da.jpg http://open.lib.umn.edu/humanresourcemanagement/wp- content/uploads/sites/7/2015/03/38f44368950c5a67d7b2c29c536 4b0da.jpg Most professionals agree that there are seven main tasks HRM professionals perform. All these need to be considered in relation to external and outside forces. Key Takeaways • Capital includes all resources a company uses to generate revenue. Human resources or the people working in the organization are the most important resource. • Human resource management is the process of employing people, training them, compensating them, developing policies relating to the workplace, and developing strategies to retain employees. • There are seven main responsibilities of HRM managers: staffing, setting policies, compensation and benefits, retention, training, employment laws, and worker protection. In this book, each of these major areas will be included in a chapter or two. • In addition to being concerned with the seven internal aspects, HRM managers must keep up to date with changes in the external environment that may impact their employees. The trends toward flexible schedules and telecommuting are examples of external aspects. • To effectively understand how the external forces might affect
- 80. human resources, it is important for 1 . 1 W H A T I S H U M A N R E S O U R C E S ? • 9 http://open.lib.umn.edu/humanresourcemanagement/wp- content/uploads/sites/7/2015/03/0006ad93fc4da0b31ba152a320b f82ee.jpg http://open.lib.umn.edu/humanresourcemanagement/wp- content/uploads/sites/7/2015/03/0006ad93fc4da0b31ba152a320b f82ee.jpg the HR manager to read the HR literature, attend conferences, and utilize other ways to stay up to date with new laws, trends, and policies. Exercises 1. State arguments for and against the following statement: there are other things more valuable in an organization besides the people who work there. 2. Of the seven tasks an HR manager does, which do you think is the most challenging? Why? 1Society for Human Resource Management, accessed August 18, 2011, http://www.shrm.org/Pages/default.aspx. ReferencesReferences Cappelli, P., “HR Implications of Healthcare Reform,” Human Resource Executive Online, March 29, 2010, accessed August 18, 2011, http://www.hreonline.com/HRE/story.jsp?storyId=379096509.
- 81. Frasch, K. B., David Shadovitz, and Jared Shelly, “There’s No Whining in HR,” Human Resource Executive Online, June 30, 2009, accessed September 24, 2010, http://www.hreonline.com/HRE/ story.jsp?storyId=227738167. Rivenbark, L., “The 7 Hidden Reasons Why Employees Leave,” HR Magazine, May 2005, accessed October 10, 2010, http://findarticles.com/p/articles/mi_m3495/is_5_50/ai_n137214 06. 1 0 • H U M A N R E S O U R C E M A N A G E M E N T http://www.shrm.org/Pages/default.aspx http://www.hreonline.com/HRE/story.jsp?storyId=379096509 http://www.hreonline.com/HRE/story.jsp?storyId=227738167 http://www.hreonline.com/HRE/story.jsp?storyId=227738167 http://findarticles.com/p/articles/mi_m3495/is_5_50/ai_n137214 06 1.2 Skills Needed for HRM Learning Objectives 1. Explain the professional and personal skills needed to be successful in HRM. 1. Be able to define human resource management and the certifications that can be achieved in this profession.
- 82. One of the major factors of a successful manager or human resource (HR) manager is an array of skills to deal with a variety of situations. It simply isn’t enough to have knowledge of HR, such as knowing which forms need to be filled out. It takes multiple skills to create and manage people, as well as a cutting-edge human resource department. The first skill needed is organization. The need for this skill makes sense, given that you are managing people’s pay, benefits, and careers. Having organized files on your computer and good time-management skills are crucial for success in any job, but especially if you take on a role in human resources. Like most jobs, being able to multitask—that is, work on more than one task at a time—is important in managing human resources. A typical person managing human resources may have to deal with an employee issue one minute, then switch and deal with recruiting. Unlike many management positions, which only focus on one task or one part of the business, human resources focuses on all areas of the business, where multitasking is a must. As trite as it may sound, people skills are necessary in any type of management and perhaps might be the most important skills for achieving success at any job. Being able to