Determinants of higher fertility rates in igunga district, tanzania does women empowerment matters

This study investigated the relationship between women's empowerment and fertility rates in Igunga District, Tanzania, which has high fertility rates. 120 women were surveyed using questionnaires on their empowerment, measured by indicators like participation in economic and family size decisions, mobility, and coercive control, and their fertility, measured by age-specific fertility rates and total fertility rates. Results showed women in the area had low levels of empowerment on these indicators. Regression analysis found lower levels of empowerment, along with demographic and cultural factors like men's dominance, were responsible for the higher fertility rates in the area. The study recommends interventions to address cultural factors and increase women's empowerment to potentially lower fertility rates.

Recommended
Recommended
More Related Content
What's hot
What's hot (20)
Similar to Determinants of higher fertility rates in igunga district, tanzania does women empowerment matters
Similar to Determinants of higher fertility rates in igunga district, tanzania does women empowerment matters (20)
More from Alexander Decker
More from Alexander Decker (20)
Recently uploaded
Recently uploaded (20)
Determinants of higher fertility rates in igunga district, tanzania does women empowerment matters
- 1. Research on Humanities and Social Sciences www.iiste.org ISSN 2222-1719 (Paper) ISSN 2222-2863 (Online) Vol.3, No.9, 2013 50 Determinants of Higher Fertility Rates in Igunga District, Tanzania: Does Women Empowerment Matters? J.S. Mbwambo1* , E.E. Chingonikaya1 and H.W. Mwatawala2 1. Sokoine University of Agriculture, P.O.Box 3024, Morogoro Tanzania 2. Institute of Rural Development Planning, Dodoma, Tanzania * jonahtz@yahoo.com or mbwambojs@gmail.com ABSTRACT This study was conducted to investigate the relationship between women’s empowerment and fertility in rural Tanzania. Data were collected from randomly selected 120 women in four randomly selected villages from two wards in Igunga District using a structured and non-structured questionnaire. Descriptive and regression analyses using Statistical Package for Social Sciences were employed to determine the factors for fertility. Women’s empowerment was measured by five proxies: economic decision making, mobility, coercive control, family planning and contraceptive use, and family size decision making. Fertility status was measured by age specific fertility rates and total fertility rates. The main argument adopted by the study was that higher fertility rates might be lowered through interventions that enhance women empowerment. The results indicates clearly that women in the study area are less empowered based on the adopted indicators and such lower levels of empowerment together with demographic and cultural factors including men’s dominance are responsible for higher fertility in the study area. The study recommends that interventions addressing cultural factors and enhancement of women empowerment may lower higher fertility rates from the study area. Moreover, while this study dealt with women as the unit of data collection and analysis, it is important that such intervention should involve both men and women. This, as seen from male dominance, is important because any change that is expected will come from decisions made and owned by men. Keywords: Women Empowerment and Fertility 1.0 Introduction The United Nations International Conference on Population and Development (ICPD) in Cairo, 1994, and the Fourth World Conference on Women in Beijing, 1995, outlined factors considered critical to the empowerment of women (Linkages, 1994). At these meetings, 179 countries agreed on a 20 year plan to stabilise the world’s population, premised on the notions that population, development and the environment are integrally linked and empowerment of women is needed to make this vision a reality. Empowerment of women was defined to include providing women with access to employment, education, and reproductive health care, and free from discrimination, coercion, and violence. These factors were linked with fertility decline, a global phenomenon that causes growing concern for governments planning for future workforce and social security (Linkages, 1994). However, the status of individual and the power they wield in any society is culturally determined with significant influence of gender imbalances with consequences on fertility and empowerment of women in a given society. (Eguavoen et al., 2007). Gender relationship plays a vital role in power we wield and determines the opportunities and privileges reflected from the “power to” and “power over” between men and women (Riley, 1997). Riley (1997) indicates that, in most societies, women usually have less “power over” compared to men. Individuals with “power over’ are said to assert their wishes and goals including decision regarding number of children to be raised by couples. The reduction of the “power over” bestowed upon men from culture and empowerment of women is likely to work against higher fertility rates in rural areas including Igunga District, Tanzania. Following the ICPD a considerable change has taken place in the focus of population policy from demographic to non demographic themes, including reproductive health, quality of care, and gender issues (Jones and Leete, 2002; Hardee and Leahy, 2008). By locating women within the context of global development, these conferences have encouraged women to openly discuss issues that affect their status and reproductive health (Odutolu et al., 2003). However, while women’s empowerment is considered important for fertility decline, there is limited empirical evidence from Tanzania which explain the linkage between the two concepts. Few studies including Docquier (2004), Mturi and Hinde (2001), and Ayoub (2003) looked on fertility with a relation to income levels as well as educational levels. They propound that fertility level is determined by woman income and educational status. However, these and other related studies do not directly link fertility and women’s empowerment. This paper provided empirical analysis on the linkages between women empowerment and fertility. The rest of the paper is organized as follows: Following this section is a section on the adopted conceptual framework where key theoretical and empirical assumptions are resented and described. Methods of data collection and analysis are presented after the conceptual framework in section 2.0. Presentation of the results and their discussion is
- 2. Research on Humanities and Social Sciences www.iiste.org ISSN 2222-1719 (Paper) ISSN 2222-2863 (Online) Vol.3, No.9, 2013 51 done under section 3.0 and the paper is concluded under section 4.0. 1.1 Conceptual Framework The empirical analysis of women’s empowerment and fertility in this study is guided by the Framework in which fertility as a dependent variable is defined as the number of children born per woman Gelles and Levine, (1999). Empowerment as used in this study is defined as the process by which the powerless gain greater control over the circumstances of their lives (Batliwala, 1994). According to Batliwala, (1994) empowerment includes both control over resources (physical, human, intellectual, financial) and over ideology (beliefs, values, and attitudes). Women empowerment in this study is assessed based on decision making levels including economic decision making, coercive control and freedom of movement. It is assumed that such levels of empowerment have direct implication on the powers over reproductive matters including child bearing and eventually fertility levels. However, fertility is also a function of demographic variables including woman’s age, age at first birth, age at first marriage, marital status, household size), socioeconomic factors (education, income and occupation), and socio-cultural factors (sex preference and value of children). The key assumption of this analysis is that the influence of demographic and socio-economic factors is minimized with increasing women empowerment and vice versa 2.0 METHODOLOGY 2.1 Description of the Study Area The study was conducted in Igunga district, Tabora region in Tanzania. Igunga district forms the six districts in Tabora region. Other districts include Tabora urban, Uyui, Urambo, Nzega and Sikonge. Igunga district was purposely selected for study because of two main reasons. Firstly, it has high fertility rate of 7.7 children per woman. This rate is high compared to the country’s fertility rate of 5.7 per woman (URT, 2003; NBS, 2009). Secondly, total fertility rate (TFR) in the area is rising while the national TFR is falling. The trend of Tabora region shows that in the national population census undertaken in 1967 TFR was 5.5 but for the following census it rose as follows: 1978 (6.2), 1988 (6.4) and 2002 (7.7) (NBS, 2009). 2.2 Methods of data collection and analysis 2.2.1 Methods of data collection Using a cross-sectional research design and a household as a unit of data collection and analysis, the study adopted a two phase approach for collection of data. During the first phase, qualitative tools including Focus Group Discussion (FGD) and participant observation were used for collection of qualitative data. In this, eight FGDs consisting of 8-12 randomly selected members were sampled from each village and a checklist of questions regarding women empowerment and fertility were administered to guide the discussion on qualitative matters of fertility and empowerment in the study area. The second phase of this work consisted of the quantitative approach in which a questionnaire was administered to 120 randomly selected women of reproductive age. The questionnaire consisted of both open and close ended questions. The questionnaire was also made up of scale or index based questions to capture and scale key aspects of women empowerment including mobility, economic decisions, coercive control and decision regarding use of contraceptives for fertility control. 2.2.2 Methods of Data Analysis 2.2.2.1 Qualitative data analysis The qualitative data were analyzed using content and structural functional approach where summarized content of verbal discussion and observation were broken down into meaningful segments. This enabled the research to assemble pattern of discussion and end up with the general message regarding the subject under the study. In most cases this information was used to support quantitative findings and hence enriched both the analysis of quantitative data and drawing of conclusion from empirical analysis. 2.2.2.2 Quantitative data analysis Both descriptive and inferential statistics were used for the analysis of quantitative data. Analysis of fertility data adopted Age Specific Fertility Rates (ASFRs), Total Fertility Rate (TFR), and Mean Number of Children Born (MNCB). ASFRs were defined in terms of the number of live births during a specified period to women in the particular age group divided by the number of woman years lived in that age group during the specified period (NBS, 2005). It is expressed per 1000 women, and is calculated from age group of 15 – 19 years; 20 – 24 years; and 45 – 49 years and TFR is obtained from the following formular: TFR=∑ASFRs*5/1000 ............................................................................................ (1) Where: TFR = a total fertility rate expressed as per thousand women; ∑ ASFRs* 5/1000 = a sum of all age specific fertility rates multiplied by years of women in that group, that is, five years.
- 3. Research on Humanities and Social Sciences www.iiste.org ISSN 2222-1719 (Paper) ISSN 2222-2863 (Online) Vol.3, No.9, 2013 52 MNCB was taken as the average number of children born by all women in a given population as described by Newell, (1988). It was therefore considered as a measure of a life time fertility as it reflects the accumulation of births over the past thirty years to the woman interviewed in the survey. Empowerment on the other hand was determined using proxy indicators which included a a six-point scale of household economic decision in which the level of women say on household decisions were determined and analyzed. Other proxy indicators included a five point scale to determine and analyse women’s freedom of movement and a three point scale for the analysis of coercive control. To determine the relative influence of empowerment and other variables on fertility, a multiple regression model was adopted as presented in equation 2. fert = ß0 + ß1lnage + ß2agem + 3ßageb + ß4mstat + ß5edu + ß6occp + ß7inco + ß8ecodec ß9fasdec + ß10coerc ß11green + ß12mob+e……………………………………....…………………………………………………. (2) Where: fert Number of children born per woman lnage A woman’s age in log form agem Age at first marriage ageb Age at first birth mstat Marital status edu Education level occp Main occupation inco Income (asset index) ecodec Participation in household economic decisions fasdec Participation in family size decisions coerc Coercive control(control of coercion from husband) green Contraceptive use mob Mobility (freedom of movement) ß Regression coefficient explaining importance of variables e… Error term 3.0 RESULTS AND DISCUSSIONS 3.1 Demographic and Socioeconomic Characteristics of the Respondents This section presents the background and explanatory variables. They include; age, marital status, education level, household size, age at first marriage, age at first birth, main occupation, and income in asset index. Results in Table 1 shows that the mean age of the respondents is 34.7 years with the majority of the respondents falling under the age of between 34 – 45 years. In this sample, more than 72 percent of the respondents are married at an average age of between 15 – 20 years and had their first child at an average age of 20 years. This points to high potential for fertility given the age at which a child starts bearing children.
- 4. Research on Humanities and Social Sciences www.iiste.org ISSN 2222-1719 (Paper) ISSN 2222-2863 (Online) Vol.3, No.9, 2013 53 Table 1: Demographic and socioeconomic characteristics of the respondents Characteristics Name of village Total Mwanzugi (n=30) Isugilo (n 30) Mbutu (n=30) Bukama (n=30) Age < 24 years 10.0 23.3 13.3 13.3 15.0 24 - 33 years 40.0 26.7 46.7 36.7 37.5 34 - 45 years 40.0 43.3 36.7 40.0 40.0 > 45 years 10.0 6.7 3.3 2.5 7.5 Marital status Married 66.7 80.0 70.0 73.3 72.5 Divorced 13.3 6.7 20.0 10.0 12.5 Widowed 6.7 6.7 6.7 6.7 6.7 Single 13.3 6.7 3.3 10.0 8.3 Education level None formal 26.7 63.3 30.0 40.0 40.0 Primary 50.0 26.7 60.0 53.3 47.5 Secondary 23.3 10.0 10.0 6.7 12.5 Household size < 4 members 13.3 0.0 10.0 13.3 9.2 4 – 6 members 60.0 43.3 63.3 23.3 47.5 7 – 10 members 23.4 23.4 23.4 60.0 38.3 > 10 members 3.3 3.3 3.3 3.3 5.0 Age at first marriage < 15 years 6.7 40.0 30.0 10.0 21.7 15 – 20 years 56.7 60.0 53.3 83.3 63.3 21 – 26 years 33.3 0 .0 10.0 6.7 12.5 > 26 years 3.3 0.0 6.7 0.0 2.5 Age at first birth < 16 years 3.3 13.3 30.0 6.7 13.3 16-20 years 50.0 76.7 60.0 80.0 66.7 21-25 years 43.4 10.0 6.7 13.3 18.3 > 25 years 3.3 0.0 3.3 0.0 1.7 Main occupation Farming 63.3 86.7 86.7 83.3 80.0 Civil service 23.3 10.0 6.7 6.7 11.7 Business 13.3 3.3 6.7 10.0 8.3 Income (asset index) Poorer women 43.3 43.3 33.3 20.0 35.0 Poor women 43.3 20.0 30.0 30.0 30.8 Rich women 13.3 36.7 36.7 50.0 34.2 It is important to note that income in this study was defined in assets owned by women. And this was used to reveal the wealth of the women in the study area for the purpose of developing a relationship between income and reproductive behaviour. The ownership of household items may be taken as an approximate measure of a household’s wealth or in other words an indicator for poverty monitoring (URT, 2006). The results in Table 2 shows that majority of women owned very few assets in each type of asset which was indicated in the questionnaire. It was found that the mostly owned assets were bicycles and goats as 35% of interviewed women owned a bicycle (SD = 0.341) and 35% owned goats (SD = 4.370), followed by radio (17%) (SD = 0.584) and land (15%) (SD = 2.370). Not a single woman mentioned to have ownership of relatively highly priced assets such as ox - plough and ox-cut implying that such assets are exclusively owned by men. Ownership of cattle was also dominated by men. It is important to note from the study area that a significant number of women owned bicycles. This is plausible because, majority of women uses bicycles to fetch water which is often found in distant places.
- 5. Research on Humanities and Social Sciences www.iiste.org ISSN 2222-1719 (Paper) ISSN 2222-2863 (Online) Vol.3, No.9, 2013 54 Table 2: Index of assets owned by women Asset Percentage ownership Mean SD Land (acres) 15.0 0.75 2.370 Iron corrugated houses 7.5 0.08 0.322 Grass thatched houses 5.9 0.11 0.426 Ploughs 0.0 - - Ox-carts 0.0 - - Cattle 5.0 0.61 2.374 Goats 35.0 1.60 4.370 Sheep 5.8 1.26 2.980 Chicken 12.8 6.88 6.900 Bicycles 35.0 0.13 0.341 Sewing machines 13.3 0.18 0.423 Radios 16.7 0.39 0.584 3.2 Fertility status 3.2.1 Mean Number of Children Born (MNCB) The MNCB was obtained by direct counting the cumulative number of children born by all respondents by sex and geographical location. Results in Table 3 shows that the average numbers of children born by the respondents by their reproductive age groups (15 – 49 years) increases with ages of the respondents. It is 2.0 in age group 15 – 19 and reaches 7.9 in age group 45 – 49. This implies that by average a woman would reproduce up to 7.9 children at the end of her reproductive age in the study area. This is higher than the national level of 5.51 observed in the TDHS 2004-05 (NBS, 2005), implying that the area has high fertility. Table 3: Mean number of children born (MNCB) Age Group Number of children ever born per woman Total women Total children MNCEB 1 2 3 4 5 6 7 8 9 10 11 15-19 0 2 0 0 0 0 0 0 0 0 0 2 4 2.0 20-24 2 3 2 0 1 0 1 0 0 0 0 9 26 2.9 25-29 1 3 6 6 2 0 2 0 0 0 0 20 73 3.7 30-34 0 3 7 3 5 2 3 2 0 0 0 25 113 4.5 35-39 0 0 1 3 4 6 8 4 2 1 1 30 198 6.6 40-44 0 0 1 1 4 3 3 5 1 3 1 22 156 7.1 45-49 0 0 0 1 1 1 1 3 1 4 0 12 95 7.9 Total 3 11 17 14 17 12 18 14 4 8 2 120 665 5.5 However, this varies across villages where, as Table 4 shows, the Isugilo village had the highest number of children born per woman (6.4) while Mwanzugi village had the lowest average (4.6). looking at the sex of children, results in Table 4 show further that the number of boys born exceeded that of girls by 9.6% with Isugilo and Mbutu having higher percentages of 18.4% and 12%, respectively. These findings points to possibilities that sex prefeance in favour of boys might be the reason for higher fertility rates in the study area. Table 4: Cumulative number of children born by all respondents by village Ward/Village Number of children born Percentage difference by sex Male Female Total Average Male Female Difference Igunga ward Mwanzugi 73 67 140 4.6 52.0 48.0 4.0 Isugilo 115 79 194 6.4 59.2 40.8 18.4 Sub total 188 146 334 5.6 56.2 43.8 12.4 Mbutu ward Mbutu 89 70 159 5.3 56.0 44.0 12.0 Bukama 88 84 172 5.7 52.2 47.8 4.4 Sub total 177 154 331 5.5 53.4 46.6 6.8 Grand total 365 300 665 5.5 54.8 45.2 9.6
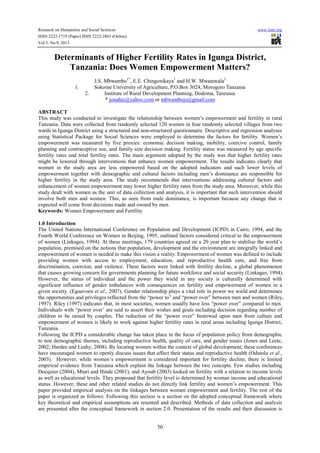
- 6. Research on Humanities and Social Sciences www.iiste.org ISSN 2222-1719 (Paper) ISSN 2222-2863 (Online) Vol.3, No.9, 2013 55 3.2.2 Age Specific Fertility Rates (ASFRs) An attempt was also made to determine age groups which contribute to higher fertility rates in the study area. Using ASFR, results in Table 5 shows that, no woman in the age group 15 – 19 years had given birth in the period preceded 12 months. Higher numbers were obtained at the age group of 25 – 29 years implying that most women are at the climax of their reproductive potential at this age group and that this group contributes much to the total fertility rate in the study area. Table 5: Age-specific fertility rates (ASFRs) in the study area Age group Number of women Number of births in 12 months preceding the survey Age specific fertility rates (ASFRs) 15-19 2 - - 20-24 9 2 222 25-29 20 7 333 30-34 25 7 280 35-39 30 6 200 40-44 22 1 181 45-49 12 1 83 Total 120 24 1299 It is important to note that results in Table 5 were compared to the national average and as Table 6 shows, the average ASFR in the study area is higher than the national average across all age categories. Table 6: Comparison of ASFRs and TFRs in the study area and Tanzania Age group Number of women No. of births in 12 months preceding survey ASFR for field survey ASFR for Tanzania (2002 Census) ASFR for Tanzania (2004-05 TDHS) 15-19 2 - - 113 132 20-24 9 2 222 290 274 25-29 20 7 333 287 254 30-34 25 7 280 248 218 35-39 30 6 200 185 156 40-44 22 1 181 96 79 45-49 12 1 83 34 18 Total 120 24 1299 1253 131 Source: URT (2005) and NBS (2005 This implies that in the study area women continue to reproduce highly even when they pass the second age group (age after teenage group). It implies also that women continue to reproduce at age above their reproductive period, that is, 49 years. While it is important to note from FGDs that cultural factors were key drivers to higher fertility rates in the study area, it was acknowledged from most respondents that sex preference, among others, may be the main driver for higher fertility as presented in the in the next section. 3.3 Overall sex preference of the respondents Results in Figure 3 shows that more than 60 percent of women prefer to give birth to boys than girls. This as noted from FGDs is culturally driven where the society considers boys to belong to the clan and that it is boys who may extend the clan along with their fathers. It is in this perspective that the recognition of a woman is held high by the number of boys she bears than girls.
- 7. Research on Humanities and Social Sciences www.iiste.org ISSN 2222-1719 (Paper) ISSN 2222-2863 (Online) Vol.3, No.9, 2013 56 Figure 1: Overall sex preference of respondents However, while this study describes the status of fertility in the study area and factors responsible for it, it was argued and assumed that such high levels of fertility might be lowered with increasing women empowerment. Thus, the next section deals with scores of women empowerment and the same will be used to determine the influence of empowerment on fertility in the study area. 3.4 Women’s Empowerment In addition to socioeconomic, demographic and socio-cultural factors, the study employed five proxy measures of empowerment adopted from Masons and Smith (2003) to measure the level of women’s empowerment in the study area. Proxy measures of women empowerment, as explained earlier were: household economic decision making, freedom of movement, mobility, and coercive control. Other proxies were related to knowledge on the use of contraceptives and decision on the maximum number of children to be born by a woman. 3.4.1 Household economic decision making Results in Table 7 show lower level of women decision or independence on economic matters at household level. Except for personal clothes, all economic decision are taken after consultation and seeking permission from the husband. Table 7: Level of household economic decision making Measures of household economic decision Response Frequency Percent Who decides for woman/wife to work outside the home Others decide 67 55.8 Wife decides 53 44.2 Who decides on purchases of household goods such as ox and plough Others decide 72 60.0 Wife decides 48 40.0 If woman/wife buys for herself clothes or shoes without consulting her husband or family member No or undecided 60 50.0 Makes consultation 60 50.0 If woman/wife buys a household bowl or plate without consulting her husband or family member No or undecided 54 45.0 Makes consultation 66 55.0 If woman/wife participates on type of crop and extent to cultivate No or undecided 62 51.7 Participates 58 48.3 If woman/wife lends knife, panga or bicycle without consulting husband No or undecided 63 52.5 Makes consultation 57 47.5 The findings imply that many women in rural areas are still decisive on minor economic issues and are still subjective to their husbands and other family members as it was observed in five Asian countries (India, Malaysia, Pakistan, Philippines, and Thailand) (Mason and Smith, 2003). - 10.00 20.00 30.00 40.00 50.00 60.00 70.00 Boys Girls Both Percent Sex preference
- 8. Research on Humanities and Social Sciences www.iiste.org ISSN 2222-1719 (Paper) ISSN 2222-2863 (Online) Vol.3, No.9, 2013 57 3.4.2 Freedom of movement (mobility) Mobility, as defined by this study, is the freedom of visiting local areas without seeking permission from their husbands or family relatives. Such areas include local markets in the village, local health centres, fields outside the village, community centres in the village, and homes of the relatives in the village. Results in Table 8 shows that except for movement to the village centre and fields outside the village, women in the study area have to seek permission from their husbands or relatives to move out of their homes as indicated in Table 8. This points to lower level of empowerment and continued domination of men and relatives over the movement of women in the study area. This corresponds with the results from FGDs where most groups indicated that it is culturally unacceptable that a woman may move here and there without the knowledge and permission from her husband. A woman whose movement is not known or predetermined is considered to be dominating her husband through witchcraft and might have uncalled agenda outside her marriage. Table 8: Level of freedom of movement (mobility) Measures of freedom of movement Response Frequency Per cent If woman ought to seek permission from husband or relative to go to local market in the village Yes 65 54.2 No 55 45.8 If woman ought to seek permission from husband or relative to go to local health centre Yes 78 65.0 No 42 35.0 If woman ought to seek permission from husband or relative to go to fields outside the village Yes 50 38.4 No 70 41.6 If woman ought to seek permission from husband or relative to go to community centre in the village Yes 54 45.0 No 66 55.0 If woman ought to seek permission from husband or relative to visit homes of the relatives in the village Yes 64 53.3 No 56 46.7 3.4.3 Interpersonal coercive control The ability of resisting coercive, torture, and intimidation from somebody as defined in this study is called interpersonal coercive control. The study sought to obtain information concerning women ability to resist coercion from their husbands by asking them two questions concerning their coercive control. Women were asked if they are afraid to differ with their husbands or if they had had been hit by their husbands. Results in Table 9 shows that about 73% were afraid to differ with their husbands and that about one third of all women had been hit by their husbands. This implies that although the percentages of women who had been hit by their husbands were lower than those who were not hit, the proportion of women who were afraid to differ with their husbands leads to a reality that women in the study area fearful of their husbands with strong implication to their levels of empowerment. Moreover, higher percentage of coercive control shows that the relationship between husband and wives is potentially abusive even when the percentage of battered women is relatively low (33.3%) Table 1: Level of interpersonal coercive control Measures of coercive control Response Frequency Per cent If woman is afraid to disagree with husband to avoid he (husband) may be angry Yes 87 72.5 No 33 27.5 If woman has ever been beaten or hit by husband in her marriage Yes 40 33.3 No 80 66.7 3.5 Determinants of fertility As explained earlier, the number of children born per woman (dependent variable) was modeled against independent variables indicated in Table 10. It is important to note that all proxy measures of women’s empowerment used in this study were used as part of the independent variables in order to verify whether or not, they have influence over the dependent variable. Other independent variables and their description are as presented in Table 10.
- 9. Research on Humanities and Social Sciences www.iiste.org ISSN 2222-1719 (Paper) ISSN 2222-2863 (Online) Vol.3, No.9, 2013 58 Table 10: Variable definitions Dependent variable Description Mean SD Dependent Variable Fertility Number of children born per woman 5.54 2.493 Independent variables Age Years since one was born 34.74 7.513 Age at first marriage Age (in years) when one first married 18.01 3.798 Age at first birth Age when one gave her first birth 18.88 2.643 Marital status State of been or not been married to 1.52 0.953 HH size Household currently residents 6.54 2.466 Occupation Legal activity for one to earns life 1.73 0.673 Income Women’s asset in index 2.68 0.673 Education Woman’s education level 1.99 0.835 HH economic decisions Level of HH economic decisions 2.80 1.607 Mobility Level of freedom of movement 2.43 1.850 Coercive control Level of coercive control 1.29 1.233 Contraceptive use Knowledge of FP and contraceptive use 3.02 1.372 Family size decisions Women’s level of family size decision 2.36 1.748 To test the relationship outlined earlier, a multiple regression model was estimated using beta weights and confidence intervals to determine their relative influence over the dependent variable. Table 11 illustrates the parameter estimate for independent variables on the dependent variable. Table 11: Multiple regression model Independent variables Coeff . SE Beta Sig. (Constant) 6.579 1.532 0.000 Age 0.896 0.095 0.535 0.000* Marital status 0.270 0.147 -0.103 0.069 Age at first marriage 0.487 0.241 -0.130 0.046* Age at first birth 0.695 0.280 -0.172 0.014* Household size 0.594 0.177 0.173 0.001* Education 0.873 0.260 -0.236 0.001* Main occupation -0.366 0.275 -0.099 0.186 Income (assets index) 0.031 0.153 0.010 0.842 HH economic decision -0.168 0.093 -0.108 0.073 Mobility 0.032 0.071 0.024 0.654 Coercive control -0.146 0.108 -0.072 0.178 FP and contraceptive use -0.068 0.100 -0.037 0.499 Family size decision -0.215 0.084 -0.151 0.012* * = Significant at (p < 0.05); F = 0.000; R2 = 0.755 Results from multiple regression in Table 11 shows a significant model at R2 = 0.755 and significant F value 0.0000 meaning that the model is significant and about 75% of independent variables explain the dependent variable (fertility). Of the variables used in the model, it is only age of the respondent, age at first marriage, age at first birth, education and household size were significant. Others, including proxy variables for women empowerment were not significant. Such findings points to the fact that demographic variables such as age at marriage and age at first child have strong influence on fertility. However, of the significant variables, the age of woman contribute more to the model (beta = 0.535). The other significant variables are, by weight of contribution, education (beta = 0.236), household size (beta = 0.173), age at first birth (beta = -0.172) and age at first marriage (beta = 0.130). 4.0 CONCLUSIONS AND RECOMMENDATIONS In this study an attempt was made to explain factors responsible for higher fertility in the study area. The main argument adopted by the study was that higher fertility rates might be lowered through interventions that enhance women empowerment. The results indicates clearly that women in the study area are less empowered based on the adopted indicators and such lower levels of empowerment together with demographic and cultural factors including men’s dominance are responsible for higher fertility in the study area.
- 10. Research on Humanities and Social Sciences www.iiste.org ISSN 2222-1719 (Paper) ISSN 2222-2863 (Online) Vol.3, No.9, 2013 59 The study proves that lower levels of women empowerment are responsible for high fertility. The study recommends that interventions addressing cultural factors and enhancement of women empowerment may lower higher fertility rates from the study area. Moreover, while this study dealt with women as the unit of data collection and analysis, it is important that such intervention should involve both men and women. This, as seen from male dominance, is important because any change that is expected will come from decisions made and owned by men. REFERENCES Ayoub, S. A. (2003). Effects of Women’s Schooling on Contraceptive use and Fertility in Tanzania. African Population Studies 19(2): 139 – 157. Batliwala, S. (1994). Meaning of Women Empowerment: New Concepts from Action. In: Population Policies Reconsidered: Health Empowerment and Rights. (Edited by Sen, G., Germain, A., and Chen, L.) Harvard University Press, Cambridge. pp. 127 - 138. Docquier, F. (2004). Income Distribution, Non-convexities and the Fertility-income Relationship. Economical Journal 71: 261 - 273. Eguavoen, A. N. T., Odiagbe, S. O., and Obetoh, G. I. (2007). Status of Women, Sex preference, Decision- making and Fertility control in Ekpoma Community of Nigeria. Journal of social sciences 15(1): 43 - 49. Gelles, R. J. and Levine, A. (1999). Sociology: An introduction. McGraw-Hill College, New Delhi. 710pp. Hardee, K. and Leahy, E. (2008). Population, Fertility and Family Planning in Pakistan: A Program in Stagnation. Research Commentary 3(3): 1 - 12. Jones, G. and Leete, R. (2002). Asia’s Family Planning Programmes as Low Fertility is Attained. Studies in Family Planning 33(1): 114 - 126. Likages (1994). Programme of action for United Nations International Conference on Population and Development. [www.iisd.ca/cairo/program/p0000.html] site visited on 27/7/2012. Mturi, A. J. and Hinde, A. (2001). Fertility Differentials in Tanzania. [http:// www.un.org/esa/population/publications/prospectsdecline/mturi.pdf] site visited on 11/8/2009. NBS (2005). Tanzania Demographic and Health Survey 2004-05. Calverton, Maryland, USA. 381pp. Odutolu, O., Adedimeji, A., Odutolu, O., Baruwa, O., and Olatidoye, F. (2003). Economic Empowerment and Reproductive Behaviour of Young Women in Osun, Nigeria. African Journal of reproductive health 7(3): 92 - 100. URT (2006). National Population Policy. Creative Eye Ltd, Dar es Salaam. 36pp. Biography Dr. Jonathan S. Mbwambo is currently working at the Ministry of Education and Vocational Training, United Republic of Tanzania as an Assistant Director responsible for higher education. Before joining the Ministry in July 2012, Dr. Mbwambo worked as a Director and a Senior Lecturer at the Development Studies Institute of Sokoine University of Agriculture in Tanzania. Dr. Mbwambo completed his PhD in 2007 and has published in both national and international journals.
- 11. This academic article was published by The International Institute for Science, Technology and Education (IISTE). The IISTE is a pioneer in the Open Access Publishing service based in the U.S. and Europe. The aim of the institute is Accelerating Global Knowledge Sharing. More information about the publisher can be found in the IISTE’s homepage: http://www.iiste.org CALL FOR PAPERS The IISTE is currently hosting more than 30 peer-reviewed academic journals and collaborating with academic institutions around the world. There’s no deadline for submission. Prospective authors of IISTE journals can find the submission instruction on the following page: http://www.iiste.org/Journals/ The IISTE editorial team promises to the review and publish all the qualified submissions in a fast manner. All the journals articles are available online to the readers all over the world without financial, legal, or technical barriers other than those inseparable from gaining access to the internet itself. Printed version of the journals is also available upon request of readers and authors. IISTE Knowledge Sharing Partners EBSCO, Index Copernicus, Ulrich's Periodicals Directory, JournalTOCS, PKP Open Archives Harvester, Bielefeld Academic Search Engine, Elektronische Zeitschriftenbibliothek EZB, Open J-Gate, OCLC WorldCat, Universe Digtial Library , NewJour, Google Scholar