SlideShare uma empresa Scribd logo
1 de 15
Baixar para ler offline
Journal of Economics and Sustainable Development                                              www.iiste.org
ISSN 2222-1700 (Paper) ISSN 2222-2855 (Online)
Vol.2, No.7, 2011


       Descriptive Analysis of Savings and Growth in Nigeria

                                              Economy
                                  Akinbobola Temidayo
           Department of Economics, Obafemi Awolowo University, Ile-Ife, Nigeria
                  Tel: +234-803-7172271. E-mail: tbobola@yahoo.co.uk


                                     Ibrahim Taiwo
           Department of Economics, Obafemi Awolowo University, Ile-Ife, Nigeria
                 Tel: +234-708-9214941. E-mail: itrbest2010@yahoo.com


Received: October 10, 2011
Accepted: October 29, 2011
Published: November 4, 2011

Abstract
This study aims at providing qualitative analysis of the relationship between domestic savings and
economic growth in Nigeria. This study employed annual secondary data obtained from World Data
Indicator (WDI), World Bank publication and Statistical Bulletin of the Central Bank of Nigeria for the
period of 1970 to 2006. Descriptive Statistics were used.
This study therefore concludes that the problem with Nigeria’s economy is not that of mobilizing domestic
savings but that of intermediation and thus recommends that government should adopt policy enhancing
intermediation between savings and investment in the economy by providing regulating and coordinating
role to ensure effective intermediation between savings and growth in the economy.


Key words: Domestic Savings, Economic Growth, Investment


1. Introduction

Savings which is defined as that part of income not immediately spent or consumed but reserved for future
consumption, investment or for unforeseen contingencies, is considered as an indispensable weapon for
economic growth and development. Its role is reflected in capital formation through increase capital stock
and the impact it makes on the capacity to generate more and higher income.

It is widely agreed on one side that countries that save more also tend to grow faster provided the financial
system is deep while on the other hand, some analysts fear that a rising savings rate could hamper
economic recovery if consumer expenditures form a large component of aggregate demand. Low savings
rate has been cited by some study as one of the most serious constraint to sustainable economic growth, one
of those studies is that of World Bank that concludes that on the average, third world countries with higher
growth rates incidentally are those with higher saving rates (World Bank 1989). United Nation also
maintained that increasing savings and ensuring that they are directed to productive investment are central
to accelerating economic growth (UN Department of Economics and Social Affairs 2005). This makes
savings as a macroeconomic variable to attain economic growth a subject of critical consideration.

46 | P a g e
www.iiste.org
Journal of Economics and Sustainable Development                                                 www.iiste.org
ISSN 2222-1700 (Paper) ISSN 2222-2855 (Online)
Vol.2, No.7, 2011


This study is devoted to examining the trend of domestic savings and economic growth in Nigeria
economy. The essence of analyzing the trend of savings and investment is to find out whether saving
promoting policies lead to more investment activities and consequently economic growth in Nigeria. In
other words, it enables us to examine the existence of savings – investment gap in the economy, and the
reaction of savings and investment to various policies in the country between 1970 and 2006.

According to Lewis (1954), ‘The central problem in the theory of economic development is to understand
the process by which a community which was previously saving and investing 4 or 5 percent of its national
income or less converts itself into an economy where voluntary savings increases to about 12 or 15 percent
of national income or more. The wholesome idea about development is rapid capital accumulation
(including knowledge and skills with capital)’, He explained further that, we cannot explain any industrial
revolution until we can explain why savings increase relative to national income. This necessitates
examining the interaction between domestic savings and economic growth of the country.

Moreover, the relationship between savings and investment can have significant implication on the state of
the economy. High savings and investment gap can have resultant effect on balance of payment
equilibrium. Although attracting foreign capital remain a necessity that cannot be avoided especially for a
developing economy like Nigeria. Long term and heavy dependence on foreign capital can have adverse
effect on economic stability. This will leave countries vulnerable to external shocks and in terms of Foreign
Direct Investment there may be a continual outflow of profits lasting much longer than outflow of debt
service payment on loan of equivalent amount in term of repatriation of profits. While a loan involves an
obligation for a definite number of years, FDI may be a long term commitment.

Though it is assumed that increases in the level of investment will bring about reduction in unemployment
rate as well as poverty and an increase in the provision of social and infrastructural facilities in the country,
but do we generate enough domestic private savings to boost investment need as well as developmental
need in Nigeria? However do we really need to save more in the economy? Ordinarily other external
sources are expected to fill the gap between investment and savings. This is a case when required
investment is greater than the actual savings. Contrary to this, in Nigeria’s situation except in 1986,
domestic savings has always been greater than investment in which case there is no gap to fill. Where now
does the problem lies? Is it savings, investment or the link? Apart from 1986 when gross domestic savings
(GDS) was very low, GDS as a percentage of gross domestic products (GDP) has always been higher than
gross capital formation (GCF), while the growth rate of the economy has been dismally low

However, investment outcome has not been encouraging in Nigeria which is a reflection of sub optimal
operating environment, resulting from inappropriate policy initiatives (Ebajemito et al 2004). It has been
the desire of successive government in Nigeria to increase its national output and the economic wellbeing
of the people through rapid industrialization. The efforts and policies embarked on seems to have been less
successful, Thus Nigeria (like any other developing economy) sees attracting foreign investment as
alternative to domestic source of financing. Attracting foreign investors is the primary target of most of the
states in the country to achieve growth as well as providing employment opportunities to the teeming
unemployed in the economy. This is a reflection of recent foreign tours to China and other developed
countries by the Governors of various states and bilateral agreements at the federal level. Nigeria’s
economy is now tending towards over reliance on foreign economy both in consumption and investment
pattern. Little or no effort is being made at mobilizing domestic savings for domestic investment. The fact
is that foreign investment is almost crowding out domestic investment.


47 | P a g e
www.iiste.org
Journal of Economics and Sustainable Development                                               www.iiste.org
ISSN 2222-1700 (Paper) ISSN 2222-2855 (Online)
Vol.2, No.7, 2011

Masson et al (1998) pointed out that capital accumulation, not technological progress, explains the growth
rates of the East Asian “tigers” along with Korea and Hong Kong. Some studies in Nigeria argue that there
is need to increase the tempo of investment that would lead to higher growth rate as is the case with Asian
tiger to register increased growth and development in Nigeria (Soludo 1998; Ebajemito et al. 2004; World
Bank 2007). Nigeria’s investment /GDP ratio which average 22.9 percent in 70’s, 16.5 percent in 80’s 19.8
percent in 90’s is averagely below the benchmark of international investment /GDP ratio of 20 percent that
is believed to propel an economy to the path of growth and development (Usman 2007), though 23 percent
on the average was attained in 2000-2005 but drastically reduced to 12.5 percent in 2006. For instance
investment /GDP has never gone below 20 percent in some Asian countries like China, Korea, Malaysia,
Singapore and Thailand with 30.5 percent 28.4 percent, 22.9 percent, 40.5 percent, and 25.8 percent
respectively in the 70’s, while in the 80’s it was 36.2 percent, 30.4 percent, 27.8 percent, 42.5 percent, and
29.5 percent respectively. 39.1 percent, 35.4 percent, 36.3 percent, 35.3 percent, and 36.3 percent
respectively in 90’s, while averagely it was 39.6 percent, 30 percent, 23.2 percent, 22.9 percent and 25.7
percent respectively for 2000-2005 (World Bank 2007). How do we reverse this ugly trend? This is
probably the reason why opting for foreign resources is prioritized by governments in Africa countries
especially Nigeria.

The expansionary measure introduced by Nigeria’s government in the early 70’s was aimed at increasing
the liquidity in the economy so as to aid the growth of the economy. It was aimed that this will increase the
disposable income of the people which is expected to be distributed over both savings and consumption.
This is consequently expected to raise the level of investments and thus increase the growth of the
economy.

In the same decade, indigenization policy was introduced, which aimed at domestic ownership of
production in the economy. The effectiveness of this measure is expected to be reflected in the rate of
savings, investment and economic growth of the country.

Apart from this introduction, this paper is divided into five sections. Section two discusses the trend of
economic growth; section two examines the trend of domestic savings. While section three examines the
trend of investment, section four analyzes the gap between savings and investment, and section five
highlights the findings.

2. The Trend of Economic Growth
The growth rate of domestic product in Nigeria reached its peak in 1970 with about 25% annual growth. In
the mid-1970s, income fluctuated with little overall trend, but then it plummeted in 1981 with the onset of
an acute economic crisis. Despite the discovery and exploration of crude oil in 70’s, it consistently fell
beyond zero percent in 1975 and 1978 with exception of 1974 when it was 11%. This continued to fall to
about -13% in 1981 which marked the beginning of economic crises as a result of fall in the price of crude
oil in the global market. Between 1981 and 1984, real output fell at an annual average rate of nearly 6
percent which incidentally increased to about 10% in 1985. The Structural Adjustment program adopted in
1986 brought about temporary relief, with real growth averaging over 8% per annum between 1988 and
1990. Despite the introduction of structural adjustment program in 1986 to resuscitate the economy as
recommended by the World Bank, the growth of GDP in the economy could not attain two digits
throughout the 80’s except in 1988. The 1990s, however, witnessed nearly complete stagnation, with
average income growing at a rate almost less than half a percentage point per annum. and throughout the
90’s, it has the highest of 8% in 1990 and since then fell to zero percent in 1994 and 1 % in 1999. It
increased to 5% in 2000 and 11% in 2003 and thus decreased through to 2006.


48 | P a g e
www.iiste.org
Journal of Economics and Sustainable Development                                              www.iiste.org
ISSN 2222-1700 (Paper) ISSN 2222-2855 (Online)
Vol.2, No.7, 2011

In order to fully explain the trend of economic growth between1970 and 2006 period, it was found
desirable to split the period into three sub-periods, with the line of demarcation given by the initiation of
major economic reforms under the aegis of the 1986 Structural Adjustment Program (SAP). We refer to
these periods as the pre-liberalization era (1970-1986) and the economic liberalization era (1987-1999) and
democratic or post liberalization era (2000-2006). The central objective of Nigeria’s Structural Adjustment
Program was to restructure and diversify the productive base of the economy in order to reduce dependence
on the oil sector and on imports. Originally planned to last for only two years (July 1986 to June 1988), the
SAP period was extended several times to allow for the phased introduction of the requisite policy reforms
and provide a period within which results could come to fruition. In policy analysis, therefore, the SAP
epoch is now generally taken to cover the period from 1987 to 1992. Unfortunately, the SAP did not deliver
all its protagonists promised
2.1        Pre Liberalization Era: 1970-1986

Oil already accounted for 57.5% of total exports in 1970, and by 1977, it accounted for 93.3% (Iyoha
1995). During the boom, balance of payments surpluses and buoyant government revenues led to a major
expansion in government expenditures, including capital expenditures.

Investment, and particularly public investment, rose very sharply during this period: in 1976, the aggregate
investment-income ratio was an impressive 31.5%, while aggregate domestic savings was around 26%. See
table 1 in appendix.

Over the full period of the oil boom, the excessive and highly inefficient public investment response is
consistent with successive governments having viewed the boom as effectively permanent. Bevan et al.
(1992) observed that it was not until after the fall of oil revenues in 1980/81 that the Nigerian government
recognized the transitory nature of the shock.

2.2      Liberalization Era: 1987-1999:

The SAP and post-SAP periods were marked by deregulation and economic liberalization. However, the
success of market liberalization was constrained throughout by haphazard implementation, frequent policy
reversals, weak institutions, and the regional redistribution syndrome. Thus, in spite of a determined effort
to deregulate and liberalize both the real and financial sectors of the economy, the average rate of economic
growth barely exceeded that of the pre-liberalization period.

The Structural Adjustment Programme introduced in 1986 constituted the institutional framework for the
design and application of trade and commercial policies for a substantial part of the 1987–1999 periods.

Towards the end of the 1980s, the continuation of economic distress led to the introduction of a new set of
reform-oriented measures, some of which were a direct reversal of measures introduced under the SAP.
These measures include prohibition of export of certain crops and their derivatives, reversal of 1988 tariff
reforms and adoption of fixed exchange rate in 1994.

Indeed, overall average economic growth differs only marginally between the pre liberalization and
liberalization era, this amount to 3.7% during the period of economic controls, and 3.6% during the
liberalization era, while the post liberalization has average of 6% economic growth (see table 2 and 3). The
inter-temporal pattern of growth differs markedly, with the first period characterized by a massive boom
and bust cycle and the second by protracted stagnation following an initial burst of growth.


49 | P a g e
www.iiste.org
Journal of Economics and Sustainable Development                                              www.iiste.org
ISSN 2222-1700 (Paper) ISSN 2222-2855 (Online)
Vol.2, No.7, 2011

2.3      Democratic or Post Liberalization Era: 2000-2006

For the first two years after the return to democratic rule in 1999, the Nigerian economy continued to report
poor overall economic performance. It was widely expected that with the dawn of democratic revival in
Nigeria, economic growth would resume and accelerate, leading to significant reduction in poverty.
Unfortunately, this did not immediately happen and economic growth continued to be lackluster and
unprepossessing. This necessitates the actualization of the U.N.’s Millennium Development Goals (MDGs).
Thus, starting from 2001, government started to introduce economic reforms. In 2003, the reform
programme was formalized and systematized and government began to implement a comprehensive reform
program known as the National Economic Empowerment and Development Strategy (NEEDS). The
comprehensive reform program was implemented in four main areas: Macroeconomic Reform; Structural
Reform; Governance and Institutional Reform; and Public Sector Reform. Under the Macroeconomic
Reform Program, government adopted prudent oil price-based fiscal rule; introduced Medium Term
Expenditure Framework (MTEF) and Medium Term Sector Strategies (MTSS); improved implementation
of monetary policy by Central Bank; undertook a bank consolidation exercise to strengthen financial sector;
adopted trade liberalization policies; and undertook the privatization of some government enterprises.
Under the Structural Reform Program, there has been a bank consolidation exercise to strengthen financial
sector; Trade liberalization reform; and privatization of some government enterprises. Under Institutional
and Governance Reforms, government introduced the Due Process mechanism in public procurement;
adopted the Extractive Industries Transparency Initiative (EITI) in Nigeria; and established the Economic
and Financial Crimes Commission (EFCC) and Independent Corrupt Practices Commission (ICPC) to
address corruption in public offices. Under the Public Sector Reforms, there has been a restructuring of
some government agencies and an increased focus on service delivery.

The improvement in macroeconomic policy making, guided by reforms of 2003 and good governance has
started to yield good dividends. Real GDP growth has improved, averaging 6.0 percent per annum since
2003 which is an improvement over 3 percent attained for the period of 2000 - 2003.

Overall, in contrast to the trend of growth of GDP, the percentage of GDP saved continued to increase from
12% in 1970 to 28% in 1974 and 31% in 1977 and 1980, while the growth of GDP fell from 25% in 1970
to 11% in 1974 while it was 6% and 4% in 1977 and 1980 respectively. The proportion of GDP saved
continued to fall from 31% in 1980 to 13% in 1985 and it increased to 29% in 1990 while the annual
growth rate continued to rise from -13% in 1981 to 10% 1985 and fell back to 8% in 1990. It continued to
fall to zero percent in 1994 and increased cyclically to 5% in 2000 while the percentage of GDP saved
decreased to 21% in 1994 but to later increase to 42% in 2000.

3. The Trend of Domestic Savings
The proportion of G D P committed to savings continued to rise from 12% in 1970 to 28% in 1974. It then
started to fluctuate until 1980. Hence the proportion started falling from about 31% in 1980 to about 12% in
1986, after which it started increasing continuously up to 29% in 1990. Thereafter it started falling
ridiculously to about 18% in 1995. Since then it has been fluctuating at increasing rate to about 42% in
2000 and 39% in 2005 and thereabout in 2006 (See table 4).

The relative increase in this proportion in the early 70’s up to 1980 can be attributed to the expansionary
policy of the government through increase in wages of the workers in the early 70’s. This effect lasted till
late 70’s specifically 1980 when Nigeria experienced another downturn in the economy. The reduction in
this proportion from 1980 to 1986 was as a result of economic crisis experienced then when the prices of
crude oil fell in the world market.

50 | P a g e
www.iiste.org
Journal of Economics and Sustainable Development                                              www.iiste.org
ISSN 2222-1700 (Paper) ISSN 2222-2855 (Online)
Vol.2, No.7, 2011


In 1986, Nigeria government took a bold step at combating the effect of this crisis by introducing Structural
Adjustment Program (SAP). Domestic savings reacted instantly to this policy and picked up from about
12% in 1986 to about 29% in 1990, 35% in 1996 and 42% in the year 2000.


 4. The Trend of Investment
The ratio of investment to G D P also seems to follow the same trend as domestic savings in the early 70’s.
The oil boom of the early 1970s had a pervasive effect on the growth and development of the economy. Oil
suddenly became the dominant sector of the economy, accounting for more than 90 per cent of exports, and
the main source of revenue. Between 1972 and 1974, federal revenue from oil increased fivefold,
contributing about 80 per cent of total revenue. Nigeria’s new wealth substantially affected the scope and
content of investment, production, and consumption patterns, the government’s approach to economic
management, and the policies and programs implemented. Federal expenditures doubled between 1973 and
1974, and between 1974 and 1975, much of the increased expenditure went into investment. It increased
from about 15% in 1970 to about 31% in 1976, which is the highest within the period under study.

Since 1976, apart from some years after the introduction of S A P in 1986, investment as a percentage of G
D P was dismally low on annual basis. It fell from about 31% in 1976 to about 9% in 1985. It has since
then increased cyclically to about 23% in 1991 and 1993 and to about 26% in 2002 but never up to pre
crisis level.

This proportion reacted positively to the expansionary measure of government in the early 70’s up to some
years before the 1981 economic crisis. The crisis forced the proportion of G D P committed to investment
to fall from about 23% in 1981 to about 9% in 1985.

It is worth noting that the indigenization policy introduced by the federal government in the late 70’s has a
negative effect on the proportion of Gross Domestic Product invested. This is manifested in the reduction
of the proportion from about 31% in 1976 to about 21% in 1980 and about 9% in 1985 (See table 5 in
appendix)

Considering the privatization and commercialization policy embarked upon by the government in the late
90’s, it seems not to have any significant effect on the proportion of G D P invested. Though, relatively
higher than before then, but not yet up to about 31% attained in 1976.


5. Savings – Investment Gap
Savings and investment ratio to GDP seem to move closely together and are relatively following the same
trend between 1970 and 1986, which thereafter followed diverse trend though they are both cyclical (see
table 6 and figure 3 in appendix). Starting point of such departure appears to coincide roughly with the
implementation of Structural Adjustment Program (S A P) and gets wider the following decades.

Actually the focus of this study is not to examine the rate of investment needed to spur economic growth
but the relevance of domestic source of financing the investment and its consequential effect on economic
growth. Table 6 reveals that out of 37 years under study, investment is higher than savings in just 14 years
and the difference in this year are so small relative to the remaining 23 years. This is more pronounced
between 1981 and 1983. It is clear from Fig 3 that the gap between investment and savings is so wide at
about 15% of GDP in 1990, about 21% in the year 1996, about 22% in the year 2000, and 17% in 2004 and

51 | P a g e
www.iiste.org
Journal of Economics and Sustainable Development                                               www.iiste.org
ISSN 2222-1700 (Paper) ISSN 2222-2855 (Online)
Vol.2, No.7, 2011

19% in 2005 compared with the highest of 6% ever recorded as the difference between saving and
investment in favour of investment within the period.

Averagely about 3.58% of gross domestic product saved between 1970 and 2006 were not invested if we
assume that the total investments were financed by domestic savings only. This figure corresponds with
about 15% of the total domestic savings in the economy within the period. Without any prejudice to all
other external source of finance, the domestic resources available for investment is greater than the level of
investment, the total amount of domestic savings in the economy, if properly channeled is sufficient to
finance the domestic investment.

To conclude this section, we shall examine the correlations between savings, investment and economic
growth in Nigeria. Table 7 revealed that savings and investment are positively correlated but this
correlation is very weak. Growth and investment are also weakly and negatively correlated. The correlation
between savings and economic growth is positive but very weak. These correlations imply that there is a
weak relationship between savings, investment and economic growth rate in the economy. This points to
the fact that investment is not responding to savings in Nigeria’s economy and also that investment in the
economy is not transforming into growth as proposed by economic theories. In this case, we can establish
that the problem with Nigeria’s economy is not that of mobilizing domestic savings but that of
intermediation.

The negative correlation between economic growth and investment is in support of empirical evidence by
(Guseh & Oritsejafor 2007) which shows that investment has negative impact on economic growth in
Nigeria, indicating that investment has not promoted economic growth.

6. Analysis
There are several important findings from the trend of savings and economic growth in Nigeria from 1970
to 2006.
i.       Economic crisis of 1981 affected both the proportion of GDP committed to savings and those
invested negatively
ii.     Prior to the introduction of Structural Adjustment Program (SAP) in 1986, both savings ratio and
investment ratio follow the same trend and thereafter followed diverse trend.
iii.    Structural Adjustment Program (SAP) of 1986 has significant effect on both the ratio of saving and
investment in Nigeria. This effect is more pronounced in savings than investment.
iv.      The saving-investment gap in the economy gets wider after the introduction of SAP in 1986 with
domestic savings far above the domestic investment.
v.        Contrary to the Asian tiger, domestic savings is relatively higher than domestic investment in
Nigerian economy. This implies that the problem is not the level of savings but the transmission of that
savings into investment.
vi.     Since we cannot establish strong link between domestic savings and investment, then savings in
Nigeria’s economy could not necessarily lead to growth. In which case, one can conclude that domestic
savings may not cause any growth in the economy in the short run.
vii.     We can establish hitherto that the consumption pattern is skewed in Nigeria, that is, as
consumption is an essential factor on the supply side of the economy, Nigerians consume more of luxury
and imported goods at the expense of domestic products.

7. Policy Implications and Conclusion


52 | P a g e
www.iiste.org
Journal of Economics and Sustainable Development                                           www.iiste.org
ISSN 2222-1700 (Paper) ISSN 2222-2855 (Online)
Vol.2, No.7, 2011

This study has established that the problem with Nigeria’s economy is not that of mobilizing domestic
savings but that of intermediation and for government to achieve rapid economic growth objective,
maximum efforts should be directed towards;
(a)      Saving–investment gap – Government should pay particular attention to the relationship between
domestic saving, and total investments in the economy. Ironically most of the resources in the economy are
exported out of the country which could be interpreted as forgone domestic investment opportunities. The
reversal of this trend would enhance the future growth potential of Nigeria economy, provided these
resources are channeled to investment.
(b)      To rectify saving-investment gap in the economy there is need to pay proper attention to both
capital and money market in the economy. Also, Government should also provide incentives for investment
by creating enabling environment through provision of infrastructural facilities and social amenities for
both existing firm and new ones.
(C)      Consumption behaviour – Government should adequately monitor consumption behaviour in the
economy by applying appropriate fiscal and monetary policy. Policy aimed at encouraging consumption of
locally produced goods and services will promote investment in the economy and will prevent capital flight
from the country.

In conclusion, government should adopt policy enhancing intermediation between savings and investment
in the economy. Such policies will stimulate domestic investment, consumption and savings simultaneously
which will eventually result to higher rate of economic growth. Policy enhancing savings without proper
channeling to investment conserves resources and reduces consumption as well as investment.


53 | P a g e
www.iiste.org
Journal of Economics and Sustainable Development                                          www.iiste.org
ISSN 2222-1700 (Paper) ISSN 2222-2855 (Online)
Vol.2, No.7, 2011

References
Bevan D.,Collier, P & Gunning J. W. (1992), “Nigeria: 1970-1990” International Centre for Economic
        Growth, U.S.A.
Ebajemito J O, Bamidele A Enedu C I & Abdulahi, A (2004) Financing Investment For Growth: The
Nigeria
         Experience.
Guseh J S & Oritsejafor E (2007), ‘Government size, Political Freedom and Economic Growth in Nigeria,
       1960-2000’, Third World Study.
Iyoha, M. A. (1995), “Economic liberalization and the external sector.” In Iwayemi, A. (Ed.),
       Macroeconomic Policy Issues in an Open Developing Economy. Ibadan: NCEMA.
Lewis W.A (1954). Economic Development with Unlimited Supplies of Labour. The Manchester School
         of Economics and Social Sciences, Pp 155.
Masanjala, W. H & Papageorgiou, C (2003) Africa Does Grow Differently Available at:
        www.arts.cornell.edu/econ/75devconf/papers/Papageorgiou.pdf
Masson, R Paul, Bayoumi, Tamim & Samiei, Hossein (1998). “International Evidence on the
        Determinants of Private Savings.” The World Bank Economic Review, 12, 483-501.
Soludo CC (1998) “Investment in Growth Process; “A Measure of the Economist’s Ignorance In Africa”,
         Nigeria Economic Society, Re – kindling Investment For Development in Nigeria- Lagos, Nigeria
        Economic Society (NES)
UKeje, E.U. (2004) “Critical issues in finance, investment and growth in Nigeria’ CBN publication Pp 69-
88
United Nations (2005), Mobilizing Domestic Resources for Development, Department Of Economics and
Social
         Affairs
UNCTAD (2007), Economic Development in Africa: Reclaiming Policy Space, Domestic Resource
Mobilization
UNECA (2001), “Saving-Investment balances and capital mobility”, Economic Survey of Europe, No.1,
Pp. 48-52,
Usman. S (2007), “Key Note Address on Investment Climate Program” At the Launching Of The Pilot
Investment
         Climate Program (I.C.P) for the Federal Government and Some Selected States at Congress
        Hall,Transcorp Hilton Hotel, Abuja.
World Bank (1989), Sub-Sahara Africa. From Crisis to Sustainable Growth. A Long Term Perspective.
        Washington D. C.


54 | P a g e
www.iiste.org
Journal of Economics and Sustainable Development                                                                   www.iiste.org
ISSN 2222-1700 (Paper) ISSN 2222-2855 (Online)
Vol.2, No.7, 2011


                                                               Gross domestic savings (% of GDP)--


                             45


                             40


                             35


                             30
  rate of domestic savings


                             25


                             20


                             15


                             10


                             5


                             0
                                  1970   1975          1980           1985               1990             1995   2000        2005
                                                                                 years

                                                                    Gross domestic savings (% of GDP)--


                                                Figure 1: Gross Domestic Savings (% of GDP)


                                                                  investment (% of GDP)--


                             35


                             30


                             25
       investment ratio


                             20


                             15


                             10


                              5


                              0
                                  1970   1975          1980           1985               1990             1995   2000        2005
                                                                                 years

                                                                  Gross capital formation (% of GDP)--


55 | P a g e
www.iiste.org
Journal of Economics and Sustainable Development                                                                                www.iiste.org
ISSN 2222-1700 (Paper) ISSN 2222-2855 (Online)
Vol.2, No.7, 2011

                                                 Figure 2: Gross Capital Formation (% of GDP)

                                                                    investment gap


                           45


                           40


                           35


                           30
  savings and investment


                           25


                           20


                           15


                           10


                           5


                           0
                                1970   1975     1980                1985                1990              1995                2000        2005
                                                                                years
                                              Gross capital formation (% of GDP)--      Gross domestic savings (% of GDP)--


                                                 Figure 3: Investment Gap


                                                 Table 1: Pre Liberalization Era

56 | P a g e
www.iiste.org
Journal of Economics and Sustainable Development                                    www.iiste.org
ISSN 2222-1700 (Paper) ISSN 2222-2855 (Online)
Vol.2, No.7, 2011

                                  GDP GROWTH ANNUAL                  GDS% OF
                    YEAR          %                                  GDP
                          1970                                 25              12
                          1971                                 14              16
                          1972                                  3              20
                          1973                                  5              23
                          1974                                 11              28
                          1975                                  -5             21
                          1976                                  9              26
                          1977                                  6              31
                          1978                                  -6             23
                          1979                                  7              28
                          1980                                  4              31
                          1981                                 -13             19
                          1982                                  0              14
                          1983                                  -5             11
                          1984                                  -5             11
                          1985                                 10              13
                          1986                                  3              12
                    AVERAGE                       3.705882353         19.94117647


                                 Table 2: Liberalization Era

                                  GDP GROWTH ANNUAL                  GDS% OF
                    YEAR          %                                  GDP
                          1987                                  -1             20
                          1988                                 10              19
                          1989                                  7              25
                          1990                                  8              29
                          1991                                  5              29
                          1992                                  3              24
                          1993                                  2              20
                          1994                                  0              21
                          1995                                  3              18
                          1996                                  4              35
                          1997                                  3              25
                          1998                                  2              20
                          1999                                  1              19
                    AVERAGE                       3.615384615         23.38461538


57 | P a g e
www.iiste.org
Journal of Economics and Sustainable Development                                       www.iiste.org
ISSN 2222-1700 (Paper) ISSN 2222-2855 (Online)
Vol.2, No.7, 2011

                                 Table 3: Post Liberalization Era

                                  GDP GROWTH ANNUAL                  GDS% OF
                    YEAR          %                                  GDP
                          2000                                  5                 42
                          2001                                  3                 35
                          2002                                  2                 26
                          2003                                  10                32
                          2004                                  11                40
                          2005                                  5                 39
                          2006                                  6                 34
                    AVERAGE                                 6   35.42857143
                                 Sources: Author’s Computations

                                         Table 4: Savings (% of GDP)
                                       GDP         GDS        GDS (%
                           Nigeria     (mill)      (mill)     of GDP)
                              1970       78,540      12,972          12

                              1975      102,971       34,226           21
                              1980      124,803       93,710           31
                              1985      106,964       33,724           13
                              1990      138,794       38,577           29

                              1995      156,909       47,257           18
                              2000      182,466        76636           42
                              2005      239,723        93492           39

                                 Sources: Author’s Computations

                                  Table 5: Investment (% of GDP)

                                  GDP             investment     investment(%
                      Nigeria     (mill)          (mill)         of GDP)
                          1970      78,540             17,463               15
                          1975     102,971             43,876               25
                          1980     124,803             47,313               21
                          1985     106,964             18,317                 9
                          1990     138,794             22,273               15
                          1995     156,909             45,405               16
                          2000     182,466             36,493               20
                          2005     239,723             47,945               21


                                 Sources: Author’s Computations


                                             TABLE 6


58 | P a g e
www.iiste.org
Journal of Economics and Sustainable Development                           www.iiste.org
ISSN 2222-1700 (Paper) ISSN 2222-2855 (Online)
Vol.2, No.7, 2011

                                SAVINGS-INVESTMENT GAP

                      Year   GDS % of GDP GCF %of GDP           GAPS
                      1970   12.01473         14.82118          -2.80645
                      1971   15.92613         18.72121          -2.79507
                      1972   20.25791         21.0853           -0.82739
                      1973   22.97822         22.41013          0.56809
                      1974   27.58111         16.97103          10.61008
                      1975   20.73793         25.23076          -4.49284
                      1976   25.76805         31.47452          -5.70647
                      1977   30.6759          28.32634          2.349562
                      1978   23.32205         27.53169          -4.20963
                      1979   27.8358          22.08194          5.753868
                      1980   31.43107         21.25204          10.17904
                      1981   19.22977         23.28053          -4.05076
                      1982   14.03518         20.00231          -5.96712
                      1983   10.82703         14.74293          -3.9159
                      1984   11.42403         9.526158          1.897874
                      1985   12.62746         8.968555          3.658905
                      1986   11.62848         15.03107          -3.40259
                      1987   19.9201          15.98108          3.939018
                      1988   19.10247         18.00706          1.095406
                      1989   25.26399         17.72562          7.53837
                      1990   29.35615         14.73471          14.62145
                      1991   29.30717         23.42616          5.881012
                      1992   23.54127         21.80342          1.737848
                      1993   20.20821         23.28695          -3.07874
                      1994   20.62868         19.63477          0.993919
                      1995   18.44204         16.33872          2.103313
                      1996   34.87439         14.17421          20.70018
                      1997   24.64646         17.44571          7.200752
                      1998   19.57021         24.11223          -4.54202
                      1999   19.14744         23.3824           -4.23496
                      2000   42.32974         20.26252          22.06722
                      2001   34.86691         24.09032          10.77658
                      2002   25.47087         26.22879          -0.75792
                      2003   32.08446         23.86222          8.22224
                      2004   39.54338         22.36304          17.18034
                      2005   38.7683          20.86071          17.90759
                      2006   33.5             12.5              21.00
                             855.3731         729.1783          126.1948
                               Sources: Author’s Computations


59 | P a g e
www.iiste.org
Journal of Economics and Sustainable Development                                  www.iiste.org
ISSN 2222-1700 (Paper) ISSN 2222-2855 (Online)
Vol.2, No.7, 2011

                      Table 7: Savings-Investment-GDP Growth Correlation

                                 GDP GROWTH         INVESTMENT             SAVINGS

GDP GROWTH                        1.0000

INVESTMENT                        -0.1559              1.0000

SAVINGS                           0.1477               0.3812                1.0000

Sources: Author’s Computations


60 | P a g e
www.iiste.org

Mais conteúdo relacionado

Mais procurados

11.0003www.iiste.org call for paper-45
11.0003www.iiste.org call for paper-4511.0003www.iiste.org call for paper-45
11.0003www.iiste.org call for paper-45Alexander Decker
 
Factors Affecting the Investment Climate and the Role of Investments in Econo...
Factors Affecting the Investment Climate and the Role of Investments in Econo...Factors Affecting the Investment Climate and the Role of Investments in Econo...
Factors Affecting the Investment Climate and the Role of Investments in Econo...ijtsrd
 
Tax Incentives and Foreign Direct Investment in Nigeria
Tax Incentives and Foreign Direct Investment in NigeriaTax Incentives and Foreign Direct Investment in Nigeria
Tax Incentives and Foreign Direct Investment in Nigeriaiosrjce
 
Getting Rntervention Rights Rodrik Korean Economic Development
Getting Rntervention Rights Rodrik Korean Economic DevelopmentGetting Rntervention Rights Rodrik Korean Economic Development
Getting Rntervention Rights Rodrik Korean Economic DevelopmentSievleang Ly
 
Fund Mobilization and Sustainable Economic Growth the Nigerian's Experience
Fund Mobilization and Sustainable Economic Growth the Nigerian's ExperienceFund Mobilization and Sustainable Economic Growth the Nigerian's Experience
Fund Mobilization and Sustainable Economic Growth the Nigerian's Experienceijtsrd
 
Senior Integration Paper (Thesis)
Senior Integration Paper (Thesis)Senior Integration Paper (Thesis)
Senior Integration Paper (Thesis)Simon Peter Ocailap
 
Challenges And Opportunities Of Globalisation
Challenges And Opportunities Of GlobalisationChallenges And Opportunities Of Globalisation
Challenges And Opportunities Of Globalisationloveleenchawla
 
Government Expenditure on Defence and Internal Security A Prerequisite for Ac...
Government Expenditure on Defence and Internal Security A Prerequisite for Ac...Government Expenditure on Defence and Internal Security A Prerequisite for Ac...
Government Expenditure on Defence and Internal Security A Prerequisite for Ac...ijtsrd
 
Capital Inflows and Economic Growth A Comperative Study
Capital Inflows and Economic Growth A Comperative StudyCapital Inflows and Economic Growth A Comperative Study
Capital Inflows and Economic Growth A Comperative Studyiosrjce
 
Business mentoring and domestic entrepreneurship in nigeria’s
Business mentoring and domestic entrepreneurship in nigeria’sBusiness mentoring and domestic entrepreneurship in nigeria’s
Business mentoring and domestic entrepreneurship in nigeria’sAlexander Decker
 
Effect of Monetary Policy on Economic Growth in Nigeria
Effect of Monetary Policy on Economic Growth in NigeriaEffect of Monetary Policy on Economic Growth in Nigeria
Effect of Monetary Policy on Economic Growth in Nigeriaijtsrd
 
External Financing and Economic Growth in Nigeria 1986 2017
External Financing and Economic Growth in Nigeria 1986 2017External Financing and Economic Growth in Nigeria 1986 2017
External Financing and Economic Growth in Nigeria 1986 2017ijtsrd
 
Foreign Direct Investment and Poverty Reduction in Nigeria
Foreign Direct Investment and Poverty Reduction in NigeriaForeign Direct Investment and Poverty Reduction in Nigeria
Foreign Direct Investment and Poverty Reduction in Nigeriainventionjournals
 
Pakistan economy and debts on pakistan
Pakistan economy and debts on pakistanPakistan economy and debts on pakistan
Pakistan economy and debts on pakistanshahidbangash258
 
To what extent foreign direct investment (fdi) affect in economic development...
To what extent foreign direct investment (fdi) affect in economic development...To what extent foreign direct investment (fdi) affect in economic development...
To what extent foreign direct investment (fdi) affect in economic development...Alexander Decker
 
The Impact of Investment on Nigeria Economy 1970 – 2012
The Impact of Investment on Nigeria Economy 1970 – 2012The Impact of Investment on Nigeria Economy 1970 – 2012
The Impact of Investment on Nigeria Economy 1970 – 2012iosrjce
 

Mais procurados (20)

11.0003www.iiste.org call for paper-45
11.0003www.iiste.org call for paper-4511.0003www.iiste.org call for paper-45
11.0003www.iiste.org call for paper-45
 
Factors Affecting the Investment Climate and the Role of Investments in Econo...
Factors Affecting the Investment Climate and the Role of Investments in Econo...Factors Affecting the Investment Climate and the Role of Investments in Econo...
Factors Affecting the Investment Climate and the Role of Investments in Econo...
 
Tax Incentives and Foreign Direct Investment in Nigeria
Tax Incentives and Foreign Direct Investment in NigeriaTax Incentives and Foreign Direct Investment in Nigeria
Tax Incentives and Foreign Direct Investment in Nigeria
 
Getting Rntervention Rights Rodrik Korean Economic Development
Getting Rntervention Rights Rodrik Korean Economic DevelopmentGetting Rntervention Rights Rodrik Korean Economic Development
Getting Rntervention Rights Rodrik Korean Economic Development
 
14 nuzhat
14 nuzhat14 nuzhat
14 nuzhat
 
3.31 45
3.31 453.31 45
3.31 45
 
Fund Mobilization and Sustainable Economic Growth the Nigerian's Experience
Fund Mobilization and Sustainable Economic Growth the Nigerian's ExperienceFund Mobilization and Sustainable Economic Growth the Nigerian's Experience
Fund Mobilization and Sustainable Economic Growth the Nigerian's Experience
 
Senior Integration Paper (Thesis)
Senior Integration Paper (Thesis)Senior Integration Paper (Thesis)
Senior Integration Paper (Thesis)
 
Challenges And Opportunities Of Globalisation
Challenges And Opportunities Of GlobalisationChallenges And Opportunities Of Globalisation
Challenges And Opportunities Of Globalisation
 
Government Expenditure on Defence and Internal Security A Prerequisite for Ac...
Government Expenditure on Defence and Internal Security A Prerequisite for Ac...Government Expenditure on Defence and Internal Security A Prerequisite for Ac...
Government Expenditure on Defence and Internal Security A Prerequisite for Ac...
 
Capital Inflows and Economic Growth A Comperative Study
Capital Inflows and Economic Growth A Comperative StudyCapital Inflows and Economic Growth A Comperative Study
Capital Inflows and Economic Growth A Comperative Study
 
Business mentoring and domestic entrepreneurship in nigeria’s
Business mentoring and domestic entrepreneurship in nigeria’sBusiness mentoring and domestic entrepreneurship in nigeria’s
Business mentoring and domestic entrepreneurship in nigeria’s
 
Effect of Monetary Policy on Economic Growth in Nigeria
Effect of Monetary Policy on Economic Growth in NigeriaEffect of Monetary Policy on Economic Growth in Nigeria
Effect of Monetary Policy on Economic Growth in Nigeria
 
External Financing and Economic Growth in Nigeria 1986 2017
External Financing and Economic Growth in Nigeria 1986 2017External Financing and Economic Growth in Nigeria 1986 2017
External Financing and Economic Growth in Nigeria 1986 2017
 
Foreign Direct Investment and Poverty Reduction in Nigeria
Foreign Direct Investment and Poverty Reduction in NigeriaForeign Direct Investment and Poverty Reduction in Nigeria
Foreign Direct Investment and Poverty Reduction in Nigeria
 
Pakistan economy and debts on pakistan
Pakistan economy and debts on pakistanPakistan economy and debts on pakistan
Pakistan economy and debts on pakistan
 
Indian slowdown
Indian slowdownIndian slowdown
Indian slowdown
 
April 2020
April 2020April 2020
April 2020
 
To what extent foreign direct investment (fdi) affect in economic development...
To what extent foreign direct investment (fdi) affect in economic development...To what extent foreign direct investment (fdi) affect in economic development...
To what extent foreign direct investment (fdi) affect in economic development...
 
The Impact of Investment on Nigeria Economy 1970 – 2012
The Impact of Investment on Nigeria Economy 1970 – 2012The Impact of Investment on Nigeria Economy 1970 – 2012
The Impact of Investment on Nigeria Economy 1970 – 2012
 

Destaque

Web2.0 Education Final
Web2.0 Education FinalWeb2.0 Education Final
Web2.0 Education FinalTodd McKee
 
20110413 founder institute
20110413 founder institute20110413 founder institute
20110413 founder instituteMeng Weng Wong
 
How to Create a Buzz About New Technologies
How to Create a Buzz About New TechnologiesHow to Create a Buzz About New Technologies
How to Create a Buzz About New TechnologiesFast Track Marketing
 
Abnormalities of hormones and inflammatory cytokines in women affected with p...
Abnormalities of hormones and inflammatory cytokines in women affected with p...Abnormalities of hormones and inflammatory cytokines in women affected with p...
Abnormalities of hormones and inflammatory cytokines in women affected with p...Alexander Decker
 

Destaque (6)

Web2.0 Education Final
Web2.0 Education FinalWeb2.0 Education Final
Web2.0 Education Final
 
20110413 founder institute
20110413 founder institute20110413 founder institute
20110413 founder institute
 
Lines
LinesLines
Lines
 
How to Create a Buzz About New Technologies
How to Create a Buzz About New TechnologiesHow to Create a Buzz About New Technologies
How to Create a Buzz About New Technologies
 
It helpdesk
It helpdeskIt helpdesk
It helpdesk
 
Abnormalities of hormones and inflammatory cytokines in women affected with p...
Abnormalities of hormones and inflammatory cytokines in women affected with p...Abnormalities of hormones and inflammatory cytokines in women affected with p...
Abnormalities of hormones and inflammatory cytokines in women affected with p...
 

Semelhante a 5.akinbobola temidayo 46-60

This is a lirature review sourced from Internet. It is not mine
This is a lirature review sourced from Internet. It is not mineThis is a lirature review sourced from Internet. It is not mine
This is a lirature review sourced from Internet. It is not minezerfudimd
 
The impact of foreign direct investment [fdi] on poverty reduction in nigeria
The impact of foreign direct investment [fdi] on poverty reduction in nigeriaThe impact of foreign direct investment [fdi] on poverty reduction in nigeria
The impact of foreign direct investment [fdi] on poverty reduction in nigeriaAlexander Decker
 
Assessment of saving culture among households in ethiopia
Assessment of saving culture among households in ethiopiaAssessment of saving culture among households in ethiopia
Assessment of saving culture among households in ethiopiaAlexander Decker
 
Analysis of foreign investment and identified macroeconomic measures in nigeria
Analysis of foreign investment and identified macroeconomic measures in nigeriaAnalysis of foreign investment and identified macroeconomic measures in nigeria
Analysis of foreign investment and identified macroeconomic measures in nigeriaAlexander Decker
 
Effect of FDI Inflows on Real Sector Economy of Nigeria
Effect of FDI Inflows on Real Sector Economy of NigeriaEffect of FDI Inflows on Real Sector Economy of Nigeria
Effect of FDI Inflows on Real Sector Economy of Nigeriaijtsrd
 
7.[68 76]investment, inflation and economic growth-empirical evidence from ni...
7.[68 76]investment, inflation and economic growth-empirical evidence from ni...7.[68 76]investment, inflation and economic growth-empirical evidence from ni...
7.[68 76]investment, inflation and economic growth-empirical evidence from ni...Alexander Decker
 
Effect of foreign direct investment and stock market development on economic ...
Effect of foreign direct investment and stock market development on economic ...Effect of foreign direct investment and stock market development on economic ...
Effect of foreign direct investment and stock market development on economic ...Alexander Decker
 
11.effect of foreign direct investment and stock market development on econom...
11.effect of foreign direct investment and stock market development on econom...11.effect of foreign direct investment and stock market development on econom...
11.effect of foreign direct investment and stock market development on econom...Alexander Decker
 
5.[34 42]effect of foreign direct investment and stock market development on ...
5.[34 42]effect of foreign direct investment and stock market development on ...5.[34 42]effect of foreign direct investment and stock market development on ...
5.[34 42]effect of foreign direct investment and stock market development on ...Alexander Decker
 
1.[1 9]external reserves management and economic development in nigeria (1980...
1.[1 9]external reserves management and economic development in nigeria (1980...1.[1 9]external reserves management and economic development in nigeria (1980...
1.[1 9]external reserves management and economic development in nigeria (1980...Alexander Decker
 
2.[10 18]influencing organisational behaviour through the application of lear...
2.[10 18]influencing organisational behaviour through the application of lear...2.[10 18]influencing organisational behaviour through the application of lear...
2.[10 18]influencing organisational behaviour through the application of lear...Alexander Decker
 
1.[1 9]external reserves management and economic development in nigeria (1980...
1.[1 9]external reserves management and economic development in nigeria (1980...1.[1 9]external reserves management and economic development in nigeria (1980...
1.[1 9]external reserves management and economic development in nigeria (1980...Alexander Decker
 
11.external reserves management and economic development in nigeria (1980www....
11.external reserves management and economic development in nigeria (1980www....11.external reserves management and economic development in nigeria (1980www....
11.external reserves management and economic development in nigeria (1980www....Alexander Decker
 
The Short-Run Impact of FDI on Nigerian Economy
The Short-Run Impact of FDI on Nigerian EconomyThe Short-Run Impact of FDI on Nigerian Economy
The Short-Run Impact of FDI on Nigerian Economypaperpublications3
 
Effectiveness of Aggregate Determinants of Deficit Financing on Capital Forma...
Effectiveness of Aggregate Determinants of Deficit Financing on Capital Forma...Effectiveness of Aggregate Determinants of Deficit Financing on Capital Forma...
Effectiveness of Aggregate Determinants of Deficit Financing on Capital Forma...YogeshIJTSRD
 
FINANCIAL DEEPENING AND FOREIGN DIRECT INVESTMENT IN NIGERIA
FINANCIAL DEEPENING AND FOREIGN DIRECT INVESTMENT IN NIGERIAFINANCIAL DEEPENING AND FOREIGN DIRECT INVESTMENT IN NIGERIA
FINANCIAL DEEPENING AND FOREIGN DIRECT INVESTMENT IN NIGERIAAJHSSR Journal
 
Relative Potency of Internal and External Sources of Financing Nigerian Econo...
Relative Potency of Internal and External Sources of Financing Nigerian Econo...Relative Potency of Internal and External Sources of Financing Nigerian Econo...
Relative Potency of Internal and External Sources of Financing Nigerian Econo...iosrjce
 

Semelhante a 5.akinbobola temidayo 46-60 (20)

This is a lirature review sourced from Internet. It is not mine
This is a lirature review sourced from Internet. It is not mineThis is a lirature review sourced from Internet. It is not mine
This is a lirature review sourced from Internet. It is not mine
 
Jesd 2
Jesd 2Jesd 2
Jesd 2
 
The impact of foreign direct investment [fdi] on poverty reduction in nigeria
The impact of foreign direct investment [fdi] on poverty reduction in nigeriaThe impact of foreign direct investment [fdi] on poverty reduction in nigeria
The impact of foreign direct investment [fdi] on poverty reduction in nigeria
 
Assessment of saving culture among households in ethiopia
Assessment of saving culture among households in ethiopiaAssessment of saving culture among households in ethiopia
Assessment of saving culture among households in ethiopia
 
Analysis of foreign investment and identified macroeconomic measures in nigeria
Analysis of foreign investment and identified macroeconomic measures in nigeriaAnalysis of foreign investment and identified macroeconomic measures in nigeria
Analysis of foreign investment and identified macroeconomic measures in nigeria
 
Effect of FDI Inflows on Real Sector Economy of Nigeria
Effect of FDI Inflows on Real Sector Economy of NigeriaEffect of FDI Inflows on Real Sector Economy of Nigeria
Effect of FDI Inflows on Real Sector Economy of Nigeria
 
7.[68 76]investment, inflation and economic growth-empirical evidence from ni...
7.[68 76]investment, inflation and economic growth-empirical evidence from ni...7.[68 76]investment, inflation and economic growth-empirical evidence from ni...
7.[68 76]investment, inflation and economic growth-empirical evidence from ni...
 
Effect of foreign direct investment and stock market development on economic ...
Effect of foreign direct investment and stock market development on economic ...Effect of foreign direct investment and stock market development on economic ...
Effect of foreign direct investment and stock market development on economic ...
 
11.effect of foreign direct investment and stock market development on econom...
11.effect of foreign direct investment and stock market development on econom...11.effect of foreign direct investment and stock market development on econom...
11.effect of foreign direct investment and stock market development on econom...
 
5.[34 42]effect of foreign direct investment and stock market development on ...
5.[34 42]effect of foreign direct investment and stock market development on ...5.[34 42]effect of foreign direct investment and stock market development on ...
5.[34 42]effect of foreign direct investment and stock market development on ...
 
11.effect of foreign direct investment and stock market development on econom...
11.effect of foreign direct investment and stock market development on econom...11.effect of foreign direct investment and stock market development on econom...
11.effect of foreign direct investment and stock market development on econom...
 
5.[34 42]effect of foreign direct investment and stock market development on ...
5.[34 42]effect of foreign direct investment and stock market development on ...5.[34 42]effect of foreign direct investment and stock market development on ...
5.[34 42]effect of foreign direct investment and stock market development on ...
 
1.[1 9]external reserves management and economic development in nigeria (1980...
1.[1 9]external reserves management and economic development in nigeria (1980...1.[1 9]external reserves management and economic development in nigeria (1980...
1.[1 9]external reserves management and economic development in nigeria (1980...
 
2.[10 18]influencing organisational behaviour through the application of lear...
2.[10 18]influencing organisational behaviour through the application of lear...2.[10 18]influencing organisational behaviour through the application of lear...
2.[10 18]influencing organisational behaviour through the application of lear...
 
1.[1 9]external reserves management and economic development in nigeria (1980...
1.[1 9]external reserves management and economic development in nigeria (1980...1.[1 9]external reserves management and economic development in nigeria (1980...
1.[1 9]external reserves management and economic development in nigeria (1980...
 
11.external reserves management and economic development in nigeria (1980www....
11.external reserves management and economic development in nigeria (1980www....11.external reserves management and economic development in nigeria (1980www....
11.external reserves management and economic development in nigeria (1980www....
 
The Short-Run Impact of FDI on Nigerian Economy
The Short-Run Impact of FDI on Nigerian EconomyThe Short-Run Impact of FDI on Nigerian Economy
The Short-Run Impact of FDI on Nigerian Economy
 
Effectiveness of Aggregate Determinants of Deficit Financing on Capital Forma...
Effectiveness of Aggregate Determinants of Deficit Financing on Capital Forma...Effectiveness of Aggregate Determinants of Deficit Financing on Capital Forma...
Effectiveness of Aggregate Determinants of Deficit Financing on Capital Forma...
 
FINANCIAL DEEPENING AND FOREIGN DIRECT INVESTMENT IN NIGERIA
FINANCIAL DEEPENING AND FOREIGN DIRECT INVESTMENT IN NIGERIAFINANCIAL DEEPENING AND FOREIGN DIRECT INVESTMENT IN NIGERIA
FINANCIAL DEEPENING AND FOREIGN DIRECT INVESTMENT IN NIGERIA
 
Relative Potency of Internal and External Sources of Financing Nigerian Econo...
Relative Potency of Internal and External Sources of Financing Nigerian Econo...Relative Potency of Internal and External Sources of Financing Nigerian Econo...
Relative Potency of Internal and External Sources of Financing Nigerian Econo...
 

Mais de Alexander Decker

A validation of the adverse childhood experiences scale in
A validation of the adverse childhood experiences scale inA validation of the adverse childhood experiences scale in
A validation of the adverse childhood experiences scale inAlexander Decker
 
A usability evaluation framework for b2 c e commerce websites
A usability evaluation framework for b2 c e commerce websitesA usability evaluation framework for b2 c e commerce websites
A usability evaluation framework for b2 c e commerce websitesAlexander Decker
 
A universal model for managing the marketing executives in nigerian banks
A universal model for managing the marketing executives in nigerian banksA universal model for managing the marketing executives in nigerian banks
A universal model for managing the marketing executives in nigerian banksAlexander Decker
 
A unique common fixed point theorems in generalized d
A unique common fixed point theorems in generalized dA unique common fixed point theorems in generalized d
A unique common fixed point theorems in generalized dAlexander Decker
 
A trends of salmonella and antibiotic resistance
A trends of salmonella and antibiotic resistanceA trends of salmonella and antibiotic resistance
A trends of salmonella and antibiotic resistanceAlexander Decker
 
A transformational generative approach towards understanding al-istifham
A transformational  generative approach towards understanding al-istifhamA transformational  generative approach towards understanding al-istifham
A transformational generative approach towards understanding al-istifhamAlexander Decker
 
A time series analysis of the determinants of savings in namibia
A time series analysis of the determinants of savings in namibiaA time series analysis of the determinants of savings in namibia
A time series analysis of the determinants of savings in namibiaAlexander Decker
 
A therapy for physical and mental fitness of school children
A therapy for physical and mental fitness of school childrenA therapy for physical and mental fitness of school children
A therapy for physical and mental fitness of school childrenAlexander Decker
 
A theory of efficiency for managing the marketing executives in nigerian banks
A theory of efficiency for managing the marketing executives in nigerian banksA theory of efficiency for managing the marketing executives in nigerian banks
A theory of efficiency for managing the marketing executives in nigerian banksAlexander Decker
 
A systematic evaluation of link budget for
A systematic evaluation of link budget forA systematic evaluation of link budget for
A systematic evaluation of link budget forAlexander Decker
 
A synthetic review of contraceptive supplies in punjab
A synthetic review of contraceptive supplies in punjabA synthetic review of contraceptive supplies in punjab
A synthetic review of contraceptive supplies in punjabAlexander Decker
 
A synthesis of taylor’s and fayol’s management approaches for managing market...
A synthesis of taylor’s and fayol’s management approaches for managing market...A synthesis of taylor’s and fayol’s management approaches for managing market...
A synthesis of taylor’s and fayol’s management approaches for managing market...Alexander Decker
 
A survey paper on sequence pattern mining with incremental
A survey paper on sequence pattern mining with incrementalA survey paper on sequence pattern mining with incremental
A survey paper on sequence pattern mining with incrementalAlexander Decker
 
A survey on live virtual machine migrations and its techniques
A survey on live virtual machine migrations and its techniquesA survey on live virtual machine migrations and its techniques
A survey on live virtual machine migrations and its techniquesAlexander Decker
 
A survey on data mining and analysis in hadoop and mongo db
A survey on data mining and analysis in hadoop and mongo dbA survey on data mining and analysis in hadoop and mongo db
A survey on data mining and analysis in hadoop and mongo dbAlexander Decker
 
A survey on challenges to the media cloud
A survey on challenges to the media cloudA survey on challenges to the media cloud
A survey on challenges to the media cloudAlexander Decker
 
A survey of provenance leveraged
A survey of provenance leveragedA survey of provenance leveraged
A survey of provenance leveragedAlexander Decker
 
A survey of private equity investments in kenya
A survey of private equity investments in kenyaA survey of private equity investments in kenya
A survey of private equity investments in kenyaAlexander Decker
 
A study to measures the financial health of
A study to measures the financial health ofA study to measures the financial health of
A study to measures the financial health ofAlexander Decker
 
A study to evaluate the attitude of faculty members of public universities of...
A study to evaluate the attitude of faculty members of public universities of...A study to evaluate the attitude of faculty members of public universities of...
A study to evaluate the attitude of faculty members of public universities of...Alexander Decker
 

Mais de Alexander Decker (20)

A validation of the adverse childhood experiences scale in
A validation of the adverse childhood experiences scale inA validation of the adverse childhood experiences scale in
A validation of the adverse childhood experiences scale in
 
A usability evaluation framework for b2 c e commerce websites
A usability evaluation framework for b2 c e commerce websitesA usability evaluation framework for b2 c e commerce websites
A usability evaluation framework for b2 c e commerce websites
 
A universal model for managing the marketing executives in nigerian banks
A universal model for managing the marketing executives in nigerian banksA universal model for managing the marketing executives in nigerian banks
A universal model for managing the marketing executives in nigerian banks
 
A unique common fixed point theorems in generalized d
A unique common fixed point theorems in generalized dA unique common fixed point theorems in generalized d
A unique common fixed point theorems in generalized d
 
A trends of salmonella and antibiotic resistance
A trends of salmonella and antibiotic resistanceA trends of salmonella and antibiotic resistance
A trends of salmonella and antibiotic resistance
 
A transformational generative approach towards understanding al-istifham
A transformational  generative approach towards understanding al-istifhamA transformational  generative approach towards understanding al-istifham
A transformational generative approach towards understanding al-istifham
 
A time series analysis of the determinants of savings in namibia
A time series analysis of the determinants of savings in namibiaA time series analysis of the determinants of savings in namibia
A time series analysis of the determinants of savings in namibia
 
A therapy for physical and mental fitness of school children
A therapy for physical and mental fitness of school childrenA therapy for physical and mental fitness of school children
A therapy for physical and mental fitness of school children
 
A theory of efficiency for managing the marketing executives in nigerian banks
A theory of efficiency for managing the marketing executives in nigerian banksA theory of efficiency for managing the marketing executives in nigerian banks
A theory of efficiency for managing the marketing executives in nigerian banks
 
A systematic evaluation of link budget for
A systematic evaluation of link budget forA systematic evaluation of link budget for
A systematic evaluation of link budget for
 
A synthetic review of contraceptive supplies in punjab
A synthetic review of contraceptive supplies in punjabA synthetic review of contraceptive supplies in punjab
A synthetic review of contraceptive supplies in punjab
 
A synthesis of taylor’s and fayol’s management approaches for managing market...
A synthesis of taylor’s and fayol’s management approaches for managing market...A synthesis of taylor’s and fayol’s management approaches for managing market...
A synthesis of taylor’s and fayol’s management approaches for managing market...
 
A survey paper on sequence pattern mining with incremental
A survey paper on sequence pattern mining with incrementalA survey paper on sequence pattern mining with incremental
A survey paper on sequence pattern mining with incremental
 
A survey on live virtual machine migrations and its techniques
A survey on live virtual machine migrations and its techniquesA survey on live virtual machine migrations and its techniques
A survey on live virtual machine migrations and its techniques
 
A survey on data mining and analysis in hadoop and mongo db
A survey on data mining and analysis in hadoop and mongo dbA survey on data mining and analysis in hadoop and mongo db
A survey on data mining and analysis in hadoop and mongo db
 
A survey on challenges to the media cloud
A survey on challenges to the media cloudA survey on challenges to the media cloud
A survey on challenges to the media cloud
 
A survey of provenance leveraged
A survey of provenance leveragedA survey of provenance leveraged
A survey of provenance leveraged
 
A survey of private equity investments in kenya
A survey of private equity investments in kenyaA survey of private equity investments in kenya
A survey of private equity investments in kenya
 
A study to measures the financial health of
A study to measures the financial health ofA study to measures the financial health of
A study to measures the financial health of
 
A study to evaluate the attitude of faculty members of public universities of...
A study to evaluate the attitude of faculty members of public universities of...A study to evaluate the attitude of faculty members of public universities of...
A study to evaluate the attitude of faculty members of public universities of...
 

Último

The AES Investment Code - the go-to counsel for the most well-informed, wise...
The AES Investment Code -  the go-to counsel for the most well-informed, wise...The AES Investment Code -  the go-to counsel for the most well-informed, wise...
The AES Investment Code - the go-to counsel for the most well-informed, wise...AES International
 
NO1 Certified Black Magic Removal in Uk kala jadu Specialist kala jadu for Lo...
NO1 Certified Black Magic Removal in Uk kala jadu Specialist kala jadu for Lo...NO1 Certified Black Magic Removal in Uk kala jadu Specialist kala jadu for Lo...
NO1 Certified Black Magic Removal in Uk kala jadu Specialist kala jadu for Lo...Amil baba
 
INTERNATIONAL TRADE INSTITUTIONS[6].pptx
INTERNATIONAL TRADE INSTITUTIONS[6].pptxINTERNATIONAL TRADE INSTITUTIONS[6].pptx
INTERNATIONAL TRADE INSTITUTIONS[6].pptxaymenkhalfallah23
 
Financial Preparation for Millennia.pptx
Financial Preparation for Millennia.pptxFinancial Preparation for Millennia.pptx
Financial Preparation for Millennia.pptxsimon978302
 
NO1 Certified Black Magic Specialist Expert In Bahawalpur, Sargodha, Sialkot,...
NO1 Certified Black Magic Specialist Expert In Bahawalpur, Sargodha, Sialkot,...NO1 Certified Black Magic Specialist Expert In Bahawalpur, Sargodha, Sialkot,...
NO1 Certified Black Magic Specialist Expert In Bahawalpur, Sargodha, Sialkot,...Amil baba
 
Role of Information and technology in banking and finance .pptx
Role of Information and technology in banking and finance .pptxRole of Information and technology in banking and finance .pptx
Role of Information and technology in banking and finance .pptxNarayaniTripathi2
 
Financial analysis on Risk and Return.ppt
Financial analysis on Risk and Return.pptFinancial analysis on Risk and Return.ppt
Financial analysis on Risk and Return.ppttadegebreyesus
 
2024-04-09 - Pension Playpen roundtable - slides.pptx
2024-04-09 - Pension Playpen roundtable - slides.pptx2024-04-09 - Pension Playpen roundtable - slides.pptx
2024-04-09 - Pension Playpen roundtable - slides.pptxHenry Tapper
 
『澳洲文凭』买科廷大学毕业证书成绩单办理澳洲Curtin文凭学位证书
『澳洲文凭』买科廷大学毕业证书成绩单办理澳洲Curtin文凭学位证书『澳洲文凭』买科廷大学毕业证书成绩单办理澳洲Curtin文凭学位证书
『澳洲文凭』买科廷大学毕业证书成绩单办理澳洲Curtin文凭学位证书rnrncn29
 
Uae-NO1 Pakistani Amil Baba Real Amil baba In Pakistan Najoomi Baba in Pakist...
Uae-NO1 Pakistani Amil Baba Real Amil baba In Pakistan Najoomi Baba in Pakist...Uae-NO1 Pakistani Amil Baba Real Amil baba In Pakistan Najoomi Baba in Pakist...
Uae-NO1 Pakistani Amil Baba Real Amil baba In Pakistan Najoomi Baba in Pakist...Amil baba
 
The Inspirational Story of Julio Herrera Velutini - Global Finance Leader
The Inspirational Story of Julio Herrera Velutini - Global Finance LeaderThe Inspirational Story of Julio Herrera Velutini - Global Finance Leader
The Inspirational Story of Julio Herrera Velutini - Global Finance LeaderArianna Varetto
 
Economic Risk Factor Update: April 2024 [SlideShare]
Economic Risk Factor Update: April 2024 [SlideShare]Economic Risk Factor Update: April 2024 [SlideShare]
Economic Risk Factor Update: April 2024 [SlideShare]Commonwealth
 
Gender and caste discrimination in india
Gender and caste discrimination in indiaGender and caste discrimination in india
Gender and caste discrimination in indiavandanasingh01072003
 
Uae-NO1 Black Magic Specialist In Lahore Black magic In Pakistan Kala Ilam Ex...
Uae-NO1 Black Magic Specialist In Lahore Black magic In Pakistan Kala Ilam Ex...Uae-NO1 Black Magic Specialist In Lahore Black magic In Pakistan Kala Ilam Ex...
Uae-NO1 Black Magic Specialist In Lahore Black magic In Pakistan Kala Ilam Ex...Amil baba
 
NO1 Certified kala jadu karne wale ka contact number kala jadu karne wale bab...
NO1 Certified kala jadu karne wale ka contact number kala jadu karne wale bab...NO1 Certified kala jadu karne wale ka contact number kala jadu karne wale bab...
NO1 Certified kala jadu karne wale ka contact number kala jadu karne wale bab...Amil baba
 
Amil Baba In Pakistan amil baba in Lahore amil baba in Islamabad amil baba in...
Amil Baba In Pakistan amil baba in Lahore amil baba in Islamabad amil baba in...Amil Baba In Pakistan amil baba in Lahore amil baba in Islamabad amil baba in...
Amil Baba In Pakistan amil baba in Lahore amil baba in Islamabad amil baba in...amilabibi1
 
Global Economic Outlook, 2024 - Scholaride Consulting
Global Economic Outlook, 2024 - Scholaride ConsultingGlobal Economic Outlook, 2024 - Scholaride Consulting
Global Economic Outlook, 2024 - Scholaride Consultingswastiknandyofficial
 
Guard Your Investments- Corporate Defaults Alarm.pdf
Guard Your Investments- Corporate Defaults Alarm.pdfGuard Your Investments- Corporate Defaults Alarm.pdf
Guard Your Investments- Corporate Defaults Alarm.pdfJasper Colin
 
2024 Q1 Crypto Industry Report | CoinGecko
2024 Q1 Crypto Industry Report | CoinGecko2024 Q1 Crypto Industry Report | CoinGecko
2024 Q1 Crypto Industry Report | CoinGeckoCoinGecko
 
PMFBY , Pradhan Mantri Fasal bima yojna
PMFBY , Pradhan Mantri  Fasal bima yojnaPMFBY , Pradhan Mantri  Fasal bima yojna
PMFBY , Pradhan Mantri Fasal bima yojnaDharmendra Kumar
 

Último (20)

The AES Investment Code - the go-to counsel for the most well-informed, wise...
The AES Investment Code -  the go-to counsel for the most well-informed, wise...The AES Investment Code -  the go-to counsel for the most well-informed, wise...
The AES Investment Code - the go-to counsel for the most well-informed, wise...
 
NO1 Certified Black Magic Removal in Uk kala jadu Specialist kala jadu for Lo...
NO1 Certified Black Magic Removal in Uk kala jadu Specialist kala jadu for Lo...NO1 Certified Black Magic Removal in Uk kala jadu Specialist kala jadu for Lo...
NO1 Certified Black Magic Removal in Uk kala jadu Specialist kala jadu for Lo...
 
INTERNATIONAL TRADE INSTITUTIONS[6].pptx
INTERNATIONAL TRADE INSTITUTIONS[6].pptxINTERNATIONAL TRADE INSTITUTIONS[6].pptx
INTERNATIONAL TRADE INSTITUTIONS[6].pptx
 
Financial Preparation for Millennia.pptx
Financial Preparation for Millennia.pptxFinancial Preparation for Millennia.pptx
Financial Preparation for Millennia.pptx
 
NO1 Certified Black Magic Specialist Expert In Bahawalpur, Sargodha, Sialkot,...
NO1 Certified Black Magic Specialist Expert In Bahawalpur, Sargodha, Sialkot,...NO1 Certified Black Magic Specialist Expert In Bahawalpur, Sargodha, Sialkot,...
NO1 Certified Black Magic Specialist Expert In Bahawalpur, Sargodha, Sialkot,...
 
Role of Information and technology in banking and finance .pptx
Role of Information and technology in banking and finance .pptxRole of Information and technology in banking and finance .pptx
Role of Information and technology in banking and finance .pptx
 
Financial analysis on Risk and Return.ppt
Financial analysis on Risk and Return.pptFinancial analysis on Risk and Return.ppt
Financial analysis on Risk and Return.ppt
 
2024-04-09 - Pension Playpen roundtable - slides.pptx
2024-04-09 - Pension Playpen roundtable - slides.pptx2024-04-09 - Pension Playpen roundtable - slides.pptx
2024-04-09 - Pension Playpen roundtable - slides.pptx
 
『澳洲文凭』买科廷大学毕业证书成绩单办理澳洲Curtin文凭学位证书
『澳洲文凭』买科廷大学毕业证书成绩单办理澳洲Curtin文凭学位证书『澳洲文凭』买科廷大学毕业证书成绩单办理澳洲Curtin文凭学位证书
『澳洲文凭』买科廷大学毕业证书成绩单办理澳洲Curtin文凭学位证书
 
Uae-NO1 Pakistani Amil Baba Real Amil baba In Pakistan Najoomi Baba in Pakist...
Uae-NO1 Pakistani Amil Baba Real Amil baba In Pakistan Najoomi Baba in Pakist...Uae-NO1 Pakistani Amil Baba Real Amil baba In Pakistan Najoomi Baba in Pakist...
Uae-NO1 Pakistani Amil Baba Real Amil baba In Pakistan Najoomi Baba in Pakist...
 
The Inspirational Story of Julio Herrera Velutini - Global Finance Leader
The Inspirational Story of Julio Herrera Velutini - Global Finance LeaderThe Inspirational Story of Julio Herrera Velutini - Global Finance Leader
The Inspirational Story of Julio Herrera Velutini - Global Finance Leader
 
Economic Risk Factor Update: April 2024 [SlideShare]
Economic Risk Factor Update: April 2024 [SlideShare]Economic Risk Factor Update: April 2024 [SlideShare]
Economic Risk Factor Update: April 2024 [SlideShare]
 
Gender and caste discrimination in india
Gender and caste discrimination in indiaGender and caste discrimination in india
Gender and caste discrimination in india
 
Uae-NO1 Black Magic Specialist In Lahore Black magic In Pakistan Kala Ilam Ex...
Uae-NO1 Black Magic Specialist In Lahore Black magic In Pakistan Kala Ilam Ex...Uae-NO1 Black Magic Specialist In Lahore Black magic In Pakistan Kala Ilam Ex...
Uae-NO1 Black Magic Specialist In Lahore Black magic In Pakistan Kala Ilam Ex...
 
NO1 Certified kala jadu karne wale ka contact number kala jadu karne wale bab...
NO1 Certified kala jadu karne wale ka contact number kala jadu karne wale bab...NO1 Certified kala jadu karne wale ka contact number kala jadu karne wale bab...
NO1 Certified kala jadu karne wale ka contact number kala jadu karne wale bab...
 
Amil Baba In Pakistan amil baba in Lahore amil baba in Islamabad amil baba in...
Amil Baba In Pakistan amil baba in Lahore amil baba in Islamabad amil baba in...Amil Baba In Pakistan amil baba in Lahore amil baba in Islamabad amil baba in...
Amil Baba In Pakistan amil baba in Lahore amil baba in Islamabad amil baba in...
 
Global Economic Outlook, 2024 - Scholaride Consulting
Global Economic Outlook, 2024 - Scholaride ConsultingGlobal Economic Outlook, 2024 - Scholaride Consulting
Global Economic Outlook, 2024 - Scholaride Consulting
 
Guard Your Investments- Corporate Defaults Alarm.pdf
Guard Your Investments- Corporate Defaults Alarm.pdfGuard Your Investments- Corporate Defaults Alarm.pdf
Guard Your Investments- Corporate Defaults Alarm.pdf
 
2024 Q1 Crypto Industry Report | CoinGecko
2024 Q1 Crypto Industry Report | CoinGecko2024 Q1 Crypto Industry Report | CoinGecko
2024 Q1 Crypto Industry Report | CoinGecko
 
PMFBY , Pradhan Mantri Fasal bima yojna
PMFBY , Pradhan Mantri  Fasal bima yojnaPMFBY , Pradhan Mantri  Fasal bima yojna
PMFBY , Pradhan Mantri Fasal bima yojna
 

5.akinbobola temidayo 46-60

  • 1. Journal of Economics and Sustainable Development www.iiste.org ISSN 2222-1700 (Paper) ISSN 2222-2855 (Online) Vol.2, No.7, 2011 Descriptive Analysis of Savings and Growth in Nigeria Economy Akinbobola Temidayo Department of Economics, Obafemi Awolowo University, Ile-Ife, Nigeria Tel: +234-803-7172271. E-mail: tbobola@yahoo.co.uk Ibrahim Taiwo Department of Economics, Obafemi Awolowo University, Ile-Ife, Nigeria Tel: +234-708-9214941. E-mail: itrbest2010@yahoo.com Received: October 10, 2011 Accepted: October 29, 2011 Published: November 4, 2011 Abstract This study aims at providing qualitative analysis of the relationship between domestic savings and economic growth in Nigeria. This study employed annual secondary data obtained from World Data Indicator (WDI), World Bank publication and Statistical Bulletin of the Central Bank of Nigeria for the period of 1970 to 2006. Descriptive Statistics were used. This study therefore concludes that the problem with Nigeria’s economy is not that of mobilizing domestic savings but that of intermediation and thus recommends that government should adopt policy enhancing intermediation between savings and investment in the economy by providing regulating and coordinating role to ensure effective intermediation between savings and growth in the economy. Key words: Domestic Savings, Economic Growth, Investment 1. Introduction Savings which is defined as that part of income not immediately spent or consumed but reserved for future consumption, investment or for unforeseen contingencies, is considered as an indispensable weapon for economic growth and development. Its role is reflected in capital formation through increase capital stock and the impact it makes on the capacity to generate more and higher income. It is widely agreed on one side that countries that save more also tend to grow faster provided the financial system is deep while on the other hand, some analysts fear that a rising savings rate could hamper economic recovery if consumer expenditures form a large component of aggregate demand. Low savings rate has been cited by some study as one of the most serious constraint to sustainable economic growth, one of those studies is that of World Bank that concludes that on the average, third world countries with higher growth rates incidentally are those with higher saving rates (World Bank 1989). United Nation also maintained that increasing savings and ensuring that they are directed to productive investment are central to accelerating economic growth (UN Department of Economics and Social Affairs 2005). This makes savings as a macroeconomic variable to attain economic growth a subject of critical consideration. 46 | P a g e www.iiste.org
  • 2. Journal of Economics and Sustainable Development www.iiste.org ISSN 2222-1700 (Paper) ISSN 2222-2855 (Online) Vol.2, No.7, 2011 This study is devoted to examining the trend of domestic savings and economic growth in Nigeria economy. The essence of analyzing the trend of savings and investment is to find out whether saving promoting policies lead to more investment activities and consequently economic growth in Nigeria. In other words, it enables us to examine the existence of savings – investment gap in the economy, and the reaction of savings and investment to various policies in the country between 1970 and 2006. According to Lewis (1954), ‘The central problem in the theory of economic development is to understand the process by which a community which was previously saving and investing 4 or 5 percent of its national income or less converts itself into an economy where voluntary savings increases to about 12 or 15 percent of national income or more. The wholesome idea about development is rapid capital accumulation (including knowledge and skills with capital)’, He explained further that, we cannot explain any industrial revolution until we can explain why savings increase relative to national income. This necessitates examining the interaction between domestic savings and economic growth of the country. Moreover, the relationship between savings and investment can have significant implication on the state of the economy. High savings and investment gap can have resultant effect on balance of payment equilibrium. Although attracting foreign capital remain a necessity that cannot be avoided especially for a developing economy like Nigeria. Long term and heavy dependence on foreign capital can have adverse effect on economic stability. This will leave countries vulnerable to external shocks and in terms of Foreign Direct Investment there may be a continual outflow of profits lasting much longer than outflow of debt service payment on loan of equivalent amount in term of repatriation of profits. While a loan involves an obligation for a definite number of years, FDI may be a long term commitment. Though it is assumed that increases in the level of investment will bring about reduction in unemployment rate as well as poverty and an increase in the provision of social and infrastructural facilities in the country, but do we generate enough domestic private savings to boost investment need as well as developmental need in Nigeria? However do we really need to save more in the economy? Ordinarily other external sources are expected to fill the gap between investment and savings. This is a case when required investment is greater than the actual savings. Contrary to this, in Nigeria’s situation except in 1986, domestic savings has always been greater than investment in which case there is no gap to fill. Where now does the problem lies? Is it savings, investment or the link? Apart from 1986 when gross domestic savings (GDS) was very low, GDS as a percentage of gross domestic products (GDP) has always been higher than gross capital formation (GCF), while the growth rate of the economy has been dismally low However, investment outcome has not been encouraging in Nigeria which is a reflection of sub optimal operating environment, resulting from inappropriate policy initiatives (Ebajemito et al 2004). It has been the desire of successive government in Nigeria to increase its national output and the economic wellbeing of the people through rapid industrialization. The efforts and policies embarked on seems to have been less successful, Thus Nigeria (like any other developing economy) sees attracting foreign investment as alternative to domestic source of financing. Attracting foreign investors is the primary target of most of the states in the country to achieve growth as well as providing employment opportunities to the teeming unemployed in the economy. This is a reflection of recent foreign tours to China and other developed countries by the Governors of various states and bilateral agreements at the federal level. Nigeria’s economy is now tending towards over reliance on foreign economy both in consumption and investment pattern. Little or no effort is being made at mobilizing domestic savings for domestic investment. The fact is that foreign investment is almost crowding out domestic investment. 47 | P a g e www.iiste.org
  • 3. Journal of Economics and Sustainable Development www.iiste.org ISSN 2222-1700 (Paper) ISSN 2222-2855 (Online) Vol.2, No.7, 2011 Masson et al (1998) pointed out that capital accumulation, not technological progress, explains the growth rates of the East Asian “tigers” along with Korea and Hong Kong. Some studies in Nigeria argue that there is need to increase the tempo of investment that would lead to higher growth rate as is the case with Asian tiger to register increased growth and development in Nigeria (Soludo 1998; Ebajemito et al. 2004; World Bank 2007). Nigeria’s investment /GDP ratio which average 22.9 percent in 70’s, 16.5 percent in 80’s 19.8 percent in 90’s is averagely below the benchmark of international investment /GDP ratio of 20 percent that is believed to propel an economy to the path of growth and development (Usman 2007), though 23 percent on the average was attained in 2000-2005 but drastically reduced to 12.5 percent in 2006. For instance investment /GDP has never gone below 20 percent in some Asian countries like China, Korea, Malaysia, Singapore and Thailand with 30.5 percent 28.4 percent, 22.9 percent, 40.5 percent, and 25.8 percent respectively in the 70’s, while in the 80’s it was 36.2 percent, 30.4 percent, 27.8 percent, 42.5 percent, and 29.5 percent respectively. 39.1 percent, 35.4 percent, 36.3 percent, 35.3 percent, and 36.3 percent respectively in 90’s, while averagely it was 39.6 percent, 30 percent, 23.2 percent, 22.9 percent and 25.7 percent respectively for 2000-2005 (World Bank 2007). How do we reverse this ugly trend? This is probably the reason why opting for foreign resources is prioritized by governments in Africa countries especially Nigeria. The expansionary measure introduced by Nigeria’s government in the early 70’s was aimed at increasing the liquidity in the economy so as to aid the growth of the economy. It was aimed that this will increase the disposable income of the people which is expected to be distributed over both savings and consumption. This is consequently expected to raise the level of investments and thus increase the growth of the economy. In the same decade, indigenization policy was introduced, which aimed at domestic ownership of production in the economy. The effectiveness of this measure is expected to be reflected in the rate of savings, investment and economic growth of the country. Apart from this introduction, this paper is divided into five sections. Section two discusses the trend of economic growth; section two examines the trend of domestic savings. While section three examines the trend of investment, section four analyzes the gap between savings and investment, and section five highlights the findings. 2. The Trend of Economic Growth The growth rate of domestic product in Nigeria reached its peak in 1970 with about 25% annual growth. In the mid-1970s, income fluctuated with little overall trend, but then it plummeted in 1981 with the onset of an acute economic crisis. Despite the discovery and exploration of crude oil in 70’s, it consistently fell beyond zero percent in 1975 and 1978 with exception of 1974 when it was 11%. This continued to fall to about -13% in 1981 which marked the beginning of economic crises as a result of fall in the price of crude oil in the global market. Between 1981 and 1984, real output fell at an annual average rate of nearly 6 percent which incidentally increased to about 10% in 1985. The Structural Adjustment program adopted in 1986 brought about temporary relief, with real growth averaging over 8% per annum between 1988 and 1990. Despite the introduction of structural adjustment program in 1986 to resuscitate the economy as recommended by the World Bank, the growth of GDP in the economy could not attain two digits throughout the 80’s except in 1988. The 1990s, however, witnessed nearly complete stagnation, with average income growing at a rate almost less than half a percentage point per annum. and throughout the 90’s, it has the highest of 8% in 1990 and since then fell to zero percent in 1994 and 1 % in 1999. It increased to 5% in 2000 and 11% in 2003 and thus decreased through to 2006. 48 | P a g e www.iiste.org
  • 4. Journal of Economics and Sustainable Development www.iiste.org ISSN 2222-1700 (Paper) ISSN 2222-2855 (Online) Vol.2, No.7, 2011 In order to fully explain the trend of economic growth between1970 and 2006 period, it was found desirable to split the period into three sub-periods, with the line of demarcation given by the initiation of major economic reforms under the aegis of the 1986 Structural Adjustment Program (SAP). We refer to these periods as the pre-liberalization era (1970-1986) and the economic liberalization era (1987-1999) and democratic or post liberalization era (2000-2006). The central objective of Nigeria’s Structural Adjustment Program was to restructure and diversify the productive base of the economy in order to reduce dependence on the oil sector and on imports. Originally planned to last for only two years (July 1986 to June 1988), the SAP period was extended several times to allow for the phased introduction of the requisite policy reforms and provide a period within which results could come to fruition. In policy analysis, therefore, the SAP epoch is now generally taken to cover the period from 1987 to 1992. Unfortunately, the SAP did not deliver all its protagonists promised 2.1 Pre Liberalization Era: 1970-1986 Oil already accounted for 57.5% of total exports in 1970, and by 1977, it accounted for 93.3% (Iyoha 1995). During the boom, balance of payments surpluses and buoyant government revenues led to a major expansion in government expenditures, including capital expenditures. Investment, and particularly public investment, rose very sharply during this period: in 1976, the aggregate investment-income ratio was an impressive 31.5%, while aggregate domestic savings was around 26%. See table 1 in appendix. Over the full period of the oil boom, the excessive and highly inefficient public investment response is consistent with successive governments having viewed the boom as effectively permanent. Bevan et al. (1992) observed that it was not until after the fall of oil revenues in 1980/81 that the Nigerian government recognized the transitory nature of the shock. 2.2 Liberalization Era: 1987-1999: The SAP and post-SAP periods were marked by deregulation and economic liberalization. However, the success of market liberalization was constrained throughout by haphazard implementation, frequent policy reversals, weak institutions, and the regional redistribution syndrome. Thus, in spite of a determined effort to deregulate and liberalize both the real and financial sectors of the economy, the average rate of economic growth barely exceeded that of the pre-liberalization period. The Structural Adjustment Programme introduced in 1986 constituted the institutional framework for the design and application of trade and commercial policies for a substantial part of the 1987–1999 periods. Towards the end of the 1980s, the continuation of economic distress led to the introduction of a new set of reform-oriented measures, some of which were a direct reversal of measures introduced under the SAP. These measures include prohibition of export of certain crops and their derivatives, reversal of 1988 tariff reforms and adoption of fixed exchange rate in 1994. Indeed, overall average economic growth differs only marginally between the pre liberalization and liberalization era, this amount to 3.7% during the period of economic controls, and 3.6% during the liberalization era, while the post liberalization has average of 6% economic growth (see table 2 and 3). The inter-temporal pattern of growth differs markedly, with the first period characterized by a massive boom and bust cycle and the second by protracted stagnation following an initial burst of growth. 49 | P a g e www.iiste.org
  • 5. Journal of Economics and Sustainable Development www.iiste.org ISSN 2222-1700 (Paper) ISSN 2222-2855 (Online) Vol.2, No.7, 2011 2.3 Democratic or Post Liberalization Era: 2000-2006 For the first two years after the return to democratic rule in 1999, the Nigerian economy continued to report poor overall economic performance. It was widely expected that with the dawn of democratic revival in Nigeria, economic growth would resume and accelerate, leading to significant reduction in poverty. Unfortunately, this did not immediately happen and economic growth continued to be lackluster and unprepossessing. This necessitates the actualization of the U.N.’s Millennium Development Goals (MDGs). Thus, starting from 2001, government started to introduce economic reforms. In 2003, the reform programme was formalized and systematized and government began to implement a comprehensive reform program known as the National Economic Empowerment and Development Strategy (NEEDS). The comprehensive reform program was implemented in four main areas: Macroeconomic Reform; Structural Reform; Governance and Institutional Reform; and Public Sector Reform. Under the Macroeconomic Reform Program, government adopted prudent oil price-based fiscal rule; introduced Medium Term Expenditure Framework (MTEF) and Medium Term Sector Strategies (MTSS); improved implementation of monetary policy by Central Bank; undertook a bank consolidation exercise to strengthen financial sector; adopted trade liberalization policies; and undertook the privatization of some government enterprises. Under the Structural Reform Program, there has been a bank consolidation exercise to strengthen financial sector; Trade liberalization reform; and privatization of some government enterprises. Under Institutional and Governance Reforms, government introduced the Due Process mechanism in public procurement; adopted the Extractive Industries Transparency Initiative (EITI) in Nigeria; and established the Economic and Financial Crimes Commission (EFCC) and Independent Corrupt Practices Commission (ICPC) to address corruption in public offices. Under the Public Sector Reforms, there has been a restructuring of some government agencies and an increased focus on service delivery. The improvement in macroeconomic policy making, guided by reforms of 2003 and good governance has started to yield good dividends. Real GDP growth has improved, averaging 6.0 percent per annum since 2003 which is an improvement over 3 percent attained for the period of 2000 - 2003. Overall, in contrast to the trend of growth of GDP, the percentage of GDP saved continued to increase from 12% in 1970 to 28% in 1974 and 31% in 1977 and 1980, while the growth of GDP fell from 25% in 1970 to 11% in 1974 while it was 6% and 4% in 1977 and 1980 respectively. The proportion of GDP saved continued to fall from 31% in 1980 to 13% in 1985 and it increased to 29% in 1990 while the annual growth rate continued to rise from -13% in 1981 to 10% 1985 and fell back to 8% in 1990. It continued to fall to zero percent in 1994 and increased cyclically to 5% in 2000 while the percentage of GDP saved decreased to 21% in 1994 but to later increase to 42% in 2000. 3. The Trend of Domestic Savings The proportion of G D P committed to savings continued to rise from 12% in 1970 to 28% in 1974. It then started to fluctuate until 1980. Hence the proportion started falling from about 31% in 1980 to about 12% in 1986, after which it started increasing continuously up to 29% in 1990. Thereafter it started falling ridiculously to about 18% in 1995. Since then it has been fluctuating at increasing rate to about 42% in 2000 and 39% in 2005 and thereabout in 2006 (See table 4). The relative increase in this proportion in the early 70’s up to 1980 can be attributed to the expansionary policy of the government through increase in wages of the workers in the early 70’s. This effect lasted till late 70’s specifically 1980 when Nigeria experienced another downturn in the economy. The reduction in this proportion from 1980 to 1986 was as a result of economic crisis experienced then when the prices of crude oil fell in the world market. 50 | P a g e www.iiste.org
  • 6. Journal of Economics and Sustainable Development www.iiste.org ISSN 2222-1700 (Paper) ISSN 2222-2855 (Online) Vol.2, No.7, 2011 In 1986, Nigeria government took a bold step at combating the effect of this crisis by introducing Structural Adjustment Program (SAP). Domestic savings reacted instantly to this policy and picked up from about 12% in 1986 to about 29% in 1990, 35% in 1996 and 42% in the year 2000. 4. The Trend of Investment The ratio of investment to G D P also seems to follow the same trend as domestic savings in the early 70’s. The oil boom of the early 1970s had a pervasive effect on the growth and development of the economy. Oil suddenly became the dominant sector of the economy, accounting for more than 90 per cent of exports, and the main source of revenue. Between 1972 and 1974, federal revenue from oil increased fivefold, contributing about 80 per cent of total revenue. Nigeria’s new wealth substantially affected the scope and content of investment, production, and consumption patterns, the government’s approach to economic management, and the policies and programs implemented. Federal expenditures doubled between 1973 and 1974, and between 1974 and 1975, much of the increased expenditure went into investment. It increased from about 15% in 1970 to about 31% in 1976, which is the highest within the period under study. Since 1976, apart from some years after the introduction of S A P in 1986, investment as a percentage of G D P was dismally low on annual basis. It fell from about 31% in 1976 to about 9% in 1985. It has since then increased cyclically to about 23% in 1991 and 1993 and to about 26% in 2002 but never up to pre crisis level. This proportion reacted positively to the expansionary measure of government in the early 70’s up to some years before the 1981 economic crisis. The crisis forced the proportion of G D P committed to investment to fall from about 23% in 1981 to about 9% in 1985. It is worth noting that the indigenization policy introduced by the federal government in the late 70’s has a negative effect on the proportion of Gross Domestic Product invested. This is manifested in the reduction of the proportion from about 31% in 1976 to about 21% in 1980 and about 9% in 1985 (See table 5 in appendix) Considering the privatization and commercialization policy embarked upon by the government in the late 90’s, it seems not to have any significant effect on the proportion of G D P invested. Though, relatively higher than before then, but not yet up to about 31% attained in 1976. 5. Savings – Investment Gap Savings and investment ratio to GDP seem to move closely together and are relatively following the same trend between 1970 and 1986, which thereafter followed diverse trend though they are both cyclical (see table 6 and figure 3 in appendix). Starting point of such departure appears to coincide roughly with the implementation of Structural Adjustment Program (S A P) and gets wider the following decades. Actually the focus of this study is not to examine the rate of investment needed to spur economic growth but the relevance of domestic source of financing the investment and its consequential effect on economic growth. Table 6 reveals that out of 37 years under study, investment is higher than savings in just 14 years and the difference in this year are so small relative to the remaining 23 years. This is more pronounced between 1981 and 1983. It is clear from Fig 3 that the gap between investment and savings is so wide at about 15% of GDP in 1990, about 21% in the year 1996, about 22% in the year 2000, and 17% in 2004 and 51 | P a g e www.iiste.org
  • 7. Journal of Economics and Sustainable Development www.iiste.org ISSN 2222-1700 (Paper) ISSN 2222-2855 (Online) Vol.2, No.7, 2011 19% in 2005 compared with the highest of 6% ever recorded as the difference between saving and investment in favour of investment within the period. Averagely about 3.58% of gross domestic product saved between 1970 and 2006 were not invested if we assume that the total investments were financed by domestic savings only. This figure corresponds with about 15% of the total domestic savings in the economy within the period. Without any prejudice to all other external source of finance, the domestic resources available for investment is greater than the level of investment, the total amount of domestic savings in the economy, if properly channeled is sufficient to finance the domestic investment. To conclude this section, we shall examine the correlations between savings, investment and economic growth in Nigeria. Table 7 revealed that savings and investment are positively correlated but this correlation is very weak. Growth and investment are also weakly and negatively correlated. The correlation between savings and economic growth is positive but very weak. These correlations imply that there is a weak relationship between savings, investment and economic growth rate in the economy. This points to the fact that investment is not responding to savings in Nigeria’s economy and also that investment in the economy is not transforming into growth as proposed by economic theories. In this case, we can establish that the problem with Nigeria’s economy is not that of mobilizing domestic savings but that of intermediation. The negative correlation between economic growth and investment is in support of empirical evidence by (Guseh & Oritsejafor 2007) which shows that investment has negative impact on economic growth in Nigeria, indicating that investment has not promoted economic growth. 6. Analysis There are several important findings from the trend of savings and economic growth in Nigeria from 1970 to 2006. i. Economic crisis of 1981 affected both the proportion of GDP committed to savings and those invested negatively ii. Prior to the introduction of Structural Adjustment Program (SAP) in 1986, both savings ratio and investment ratio follow the same trend and thereafter followed diverse trend. iii. Structural Adjustment Program (SAP) of 1986 has significant effect on both the ratio of saving and investment in Nigeria. This effect is more pronounced in savings than investment. iv. The saving-investment gap in the economy gets wider after the introduction of SAP in 1986 with domestic savings far above the domestic investment. v. Contrary to the Asian tiger, domestic savings is relatively higher than domestic investment in Nigerian economy. This implies that the problem is not the level of savings but the transmission of that savings into investment. vi. Since we cannot establish strong link between domestic savings and investment, then savings in Nigeria’s economy could not necessarily lead to growth. In which case, one can conclude that domestic savings may not cause any growth in the economy in the short run. vii. We can establish hitherto that the consumption pattern is skewed in Nigeria, that is, as consumption is an essential factor on the supply side of the economy, Nigerians consume more of luxury and imported goods at the expense of domestic products. 7. Policy Implications and Conclusion 52 | P a g e www.iiste.org
  • 8. Journal of Economics and Sustainable Development www.iiste.org ISSN 2222-1700 (Paper) ISSN 2222-2855 (Online) Vol.2, No.7, 2011 This study has established that the problem with Nigeria’s economy is not that of mobilizing domestic savings but that of intermediation and for government to achieve rapid economic growth objective, maximum efforts should be directed towards; (a) Saving–investment gap – Government should pay particular attention to the relationship between domestic saving, and total investments in the economy. Ironically most of the resources in the economy are exported out of the country which could be interpreted as forgone domestic investment opportunities. The reversal of this trend would enhance the future growth potential of Nigeria economy, provided these resources are channeled to investment. (b) To rectify saving-investment gap in the economy there is need to pay proper attention to both capital and money market in the economy. Also, Government should also provide incentives for investment by creating enabling environment through provision of infrastructural facilities and social amenities for both existing firm and new ones. (C) Consumption behaviour – Government should adequately monitor consumption behaviour in the economy by applying appropriate fiscal and monetary policy. Policy aimed at encouraging consumption of locally produced goods and services will promote investment in the economy and will prevent capital flight from the country. In conclusion, government should adopt policy enhancing intermediation between savings and investment in the economy. Such policies will stimulate domestic investment, consumption and savings simultaneously which will eventually result to higher rate of economic growth. Policy enhancing savings without proper channeling to investment conserves resources and reduces consumption as well as investment. 53 | P a g e www.iiste.org
  • 9. Journal of Economics and Sustainable Development www.iiste.org ISSN 2222-1700 (Paper) ISSN 2222-2855 (Online) Vol.2, No.7, 2011 References Bevan D.,Collier, P & Gunning J. W. (1992), “Nigeria: 1970-1990” International Centre for Economic Growth, U.S.A. Ebajemito J O, Bamidele A Enedu C I & Abdulahi, A (2004) Financing Investment For Growth: The Nigeria Experience. Guseh J S & Oritsejafor E (2007), ‘Government size, Political Freedom and Economic Growth in Nigeria, 1960-2000’, Third World Study. Iyoha, M. A. (1995), “Economic liberalization and the external sector.” In Iwayemi, A. (Ed.), Macroeconomic Policy Issues in an Open Developing Economy. Ibadan: NCEMA. Lewis W.A (1954). Economic Development with Unlimited Supplies of Labour. The Manchester School of Economics and Social Sciences, Pp 155. Masanjala, W. H & Papageorgiou, C (2003) Africa Does Grow Differently Available at: www.arts.cornell.edu/econ/75devconf/papers/Papageorgiou.pdf Masson, R Paul, Bayoumi, Tamim & Samiei, Hossein (1998). “International Evidence on the Determinants of Private Savings.” The World Bank Economic Review, 12, 483-501. Soludo CC (1998) “Investment in Growth Process; “A Measure of the Economist’s Ignorance In Africa”, Nigeria Economic Society, Re – kindling Investment For Development in Nigeria- Lagos, Nigeria Economic Society (NES) UKeje, E.U. (2004) “Critical issues in finance, investment and growth in Nigeria’ CBN publication Pp 69- 88 United Nations (2005), Mobilizing Domestic Resources for Development, Department Of Economics and Social Affairs UNCTAD (2007), Economic Development in Africa: Reclaiming Policy Space, Domestic Resource Mobilization UNECA (2001), “Saving-Investment balances and capital mobility”, Economic Survey of Europe, No.1, Pp. 48-52, Usman. S (2007), “Key Note Address on Investment Climate Program” At the Launching Of The Pilot Investment Climate Program (I.C.P) for the Federal Government and Some Selected States at Congress Hall,Transcorp Hilton Hotel, Abuja. World Bank (1989), Sub-Sahara Africa. From Crisis to Sustainable Growth. A Long Term Perspective. Washington D. C. 54 | P a g e www.iiste.org
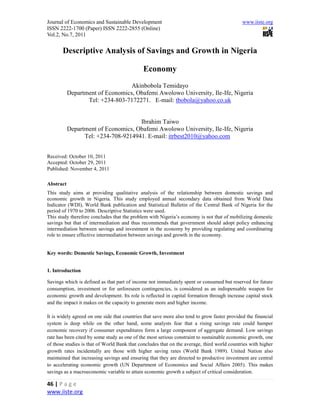
  • 10. Journal of Economics and Sustainable Development www.iiste.org ISSN 2222-1700 (Paper) ISSN 2222-2855 (Online) Vol.2, No.7, 2011 Gross domestic savings (% of GDP)-- 45 40 35 30 rate of domestic savings 25 20 15 10 5 0 1970 1975 1980 1985 1990 1995 2000 2005 years Gross domestic savings (% of GDP)-- Figure 1: Gross Domestic Savings (% of GDP) investment (% of GDP)-- 35 30 25 investment ratio 20 15 10 5 0 1970 1975 1980 1985 1990 1995 2000 2005 years Gross capital formation (% of GDP)-- 55 | P a g e www.iiste.org
  • 11. Journal of Economics and Sustainable Development www.iiste.org ISSN 2222-1700 (Paper) ISSN 2222-2855 (Online) Vol.2, No.7, 2011 Figure 2: Gross Capital Formation (% of GDP) investment gap 45 40 35 30 savings and investment 25 20 15 10 5 0 1970 1975 1980 1985 1990 1995 2000 2005 years Gross capital formation (% of GDP)-- Gross domestic savings (% of GDP)-- Figure 3: Investment Gap Table 1: Pre Liberalization Era 56 | P a g e www.iiste.org
  • 12. Journal of Economics and Sustainable Development www.iiste.org ISSN 2222-1700 (Paper) ISSN 2222-2855 (Online) Vol.2, No.7, 2011 GDP GROWTH ANNUAL GDS% OF YEAR % GDP 1970 25 12 1971 14 16 1972 3 20 1973 5 23 1974 11 28 1975 -5 21 1976 9 26 1977 6 31 1978 -6 23 1979 7 28 1980 4 31 1981 -13 19 1982 0 14 1983 -5 11 1984 -5 11 1985 10 13 1986 3 12 AVERAGE 3.705882353 19.94117647 Table 2: Liberalization Era GDP GROWTH ANNUAL GDS% OF YEAR % GDP 1987 -1 20 1988 10 19 1989 7 25 1990 8 29 1991 5 29 1992 3 24 1993 2 20 1994 0 21 1995 3 18 1996 4 35 1997 3 25 1998 2 20 1999 1 19 AVERAGE 3.615384615 23.38461538 57 | P a g e www.iiste.org
  • 13. Journal of Economics and Sustainable Development www.iiste.org ISSN 2222-1700 (Paper) ISSN 2222-2855 (Online) Vol.2, No.7, 2011 Table 3: Post Liberalization Era GDP GROWTH ANNUAL GDS% OF YEAR % GDP 2000 5 42 2001 3 35 2002 2 26 2003 10 32 2004 11 40 2005 5 39 2006 6 34 AVERAGE 6 35.42857143 Sources: Author’s Computations Table 4: Savings (% of GDP) GDP GDS GDS (% Nigeria (mill) (mill) of GDP) 1970 78,540 12,972 12 1975 102,971 34,226 21 1980 124,803 93,710 31 1985 106,964 33,724 13 1990 138,794 38,577 29 1995 156,909 47,257 18 2000 182,466 76636 42 2005 239,723 93492 39 Sources: Author’s Computations Table 5: Investment (% of GDP) GDP investment investment(% Nigeria (mill) (mill) of GDP) 1970 78,540 17,463 15 1975 102,971 43,876 25 1980 124,803 47,313 21 1985 106,964 18,317 9 1990 138,794 22,273 15 1995 156,909 45,405 16 2000 182,466 36,493 20 2005 239,723 47,945 21 Sources: Author’s Computations TABLE 6 58 | P a g e www.iiste.org
  • 14. Journal of Economics and Sustainable Development www.iiste.org ISSN 2222-1700 (Paper) ISSN 2222-2855 (Online) Vol.2, No.7, 2011 SAVINGS-INVESTMENT GAP Year GDS % of GDP GCF %of GDP GAPS 1970 12.01473 14.82118 -2.80645 1971 15.92613 18.72121 -2.79507 1972 20.25791 21.0853 -0.82739 1973 22.97822 22.41013 0.56809 1974 27.58111 16.97103 10.61008 1975 20.73793 25.23076 -4.49284 1976 25.76805 31.47452 -5.70647 1977 30.6759 28.32634 2.349562 1978 23.32205 27.53169 -4.20963 1979 27.8358 22.08194 5.753868 1980 31.43107 21.25204 10.17904 1981 19.22977 23.28053 -4.05076 1982 14.03518 20.00231 -5.96712 1983 10.82703 14.74293 -3.9159 1984 11.42403 9.526158 1.897874 1985 12.62746 8.968555 3.658905 1986 11.62848 15.03107 -3.40259 1987 19.9201 15.98108 3.939018 1988 19.10247 18.00706 1.095406 1989 25.26399 17.72562 7.53837 1990 29.35615 14.73471 14.62145 1991 29.30717 23.42616 5.881012 1992 23.54127 21.80342 1.737848 1993 20.20821 23.28695 -3.07874 1994 20.62868 19.63477 0.993919 1995 18.44204 16.33872 2.103313 1996 34.87439 14.17421 20.70018 1997 24.64646 17.44571 7.200752 1998 19.57021 24.11223 -4.54202 1999 19.14744 23.3824 -4.23496 2000 42.32974 20.26252 22.06722 2001 34.86691 24.09032 10.77658 2002 25.47087 26.22879 -0.75792 2003 32.08446 23.86222 8.22224 2004 39.54338 22.36304 17.18034 2005 38.7683 20.86071 17.90759 2006 33.5 12.5 21.00 855.3731 729.1783 126.1948 Sources: Author’s Computations 59 | P a g e www.iiste.org
  • 15. Journal of Economics and Sustainable Development www.iiste.org ISSN 2222-1700 (Paper) ISSN 2222-2855 (Online) Vol.2, No.7, 2011 Table 7: Savings-Investment-GDP Growth Correlation GDP GROWTH INVESTMENT SAVINGS GDP GROWTH 1.0000 INVESTMENT -0.1559 1.0000 SAVINGS 0.1477 0.3812 1.0000 Sources: Author’s Computations 60 | P a g e www.iiste.org