SlideShare a Scribd company logo
1 of 15
Download to read offline
Journal of Education and Practice                                                              www.iiste.org
ISSN 2222-1735 (Paper) ISSN 2222-288X (Online)
Vol 3, No 3, 2012


  The efficacy of homogeneous groups in enhancing individual
                           learning
                                             Yma Pinto*
         Department of Computer Science and Technology, Goa University, India - 403206
                          * E-mail of the corresponding author: yp@unigoa.ac.in;


Abstract
One possible enhancement to improving both the teaching and the learning process is an appropriate design
of a learning environment. Collaborative learning, if appropriately used, has been one such tool that has
been known to benefit learners. An issue that needs to be addressed, and one that can affect individual
learning is the nature of the group composition in a collaborative environment. This paper analyzes the
results of an experiment that was conducted on a module in a computer science degree course. The study
sought to find the relevance of group composition to the amount of individual student learning. The
underlying pedagogical approach for this activity is a collaborative learning experience through team work
using heterogeneous and homogeneous groups. The analysis reveals a significant improvement in
individual student performance in the year the groups were made homogenous.
Keywords: collaborative learning, improving classroom teaching, pedagogical issues, teaching/learning
strategies, computer science education.


1. Introduction
An important and pertinent fact that requires noting is that besides the basic concepts of a discipline,
effective learning methodologies characteristic to that discipline are relevant to knowledge delivery.
Schroth et al (1999) have done a comparison of various pedagogical approaches and their results show that
students experience more value, enjoyment and long-term influences of these activities as compared to
taking exams and writing papers, which were viewed as neither valuable nor enjoyable. Thus, computer
science education should also include within its curriculum design; processes, methods and models
(Hansen & Ratzer 2002). One such approach to effective and sustained learning through cross-fertilization
of ideas is the Collaborative Learning approach. This pedagogical technique helps refine multiple
intelligences of the learner like Linguistic, Intrapersonal and InterPersonal (Gardner 2004) and Visuo –
Auditory, while simultaneously exposing the learner to the higher skill levels in the Bloom’s Taxonomy
(Bloom et al 1971).
Theoretically, an important predictor of the value of a collaborative learning experience is the group’s
ability to understand, opine, share and construct new knowledge from the individual knowledge bases.
Team members evolve after evaluating, assimilating and synthesizing both complementary and
supplementary information and arriving at a common consensus. Rather than producing technology savvy
individuals who lack flexibility and versatility, collaborative learning results in acquisition of a broader
range of skills through interactivity with others, a pre-requisite for sustainable employability. It is a well
researched and a known fact that a group performance is better than that of an individual (Hill 1982;
Bradshaw & Stasson 1995; Richards 2009; Biggers et al 2009).
In a collaborative learner centric instructional delivery approach, groups of learners and their facilitator
work in a more complex environment in comparison to a lecture-based delivery. They take on roles,
contribute ideas, and critique each other’s work, and together solve aspects of larger problems. There is a
rich body of literature that points to benefits associated with this approach to learning (McWhaw et al 2003;
Mentz et al, 2008; Muehlenbrock 2006; Palincsar & Herrenkohl 1999; Waite et al 2004). Cooperation with
peers helps in deeper understanding and when necessary adapts the individuals’ concepts. From an intuitive


                                                     25
Journal of Education and Practice                                                              www.iiste.org
ISSN 2222-1735 (Paper) ISSN 2222-288X (Online)
Vol 3, No 3, 2012


standpoint, the knowledge that the group members bring to bear on the problem and how this knowledge is
shared, understood, and further developed (or not) ultimately shape both the process and the product of the
collaboration.
Barker et al (2002) forewarns that simply requiring students to work in groups does not necessarily lead to
improved learning outcomes. Sometimes, the environment within a typical computer science classroom
has been found to be defensive resulting in students who are reluctant to collaborate (Barker et al 2002).
Other reasons preventing a positive attitude to group work include fear of plagiarism, freeloading, ego,
effort, and communication overheads (Bell et al 2009; Bower & Richards 2006; Winn 2002). Further,
assessments of group performance may lead to anomalies in individual assessment. On the strength of the
above research, it is advisable that academicians use group work as a means of active learning rather than
for assessments.
There are several factors by which academics can choose groups (Cohen 1994; Hoffman 2002; Rutherford
2001). Shaw( 1976) predicts that “groups composed of members having diverse, relevant abilities perform
more effectively than groups composed of members having similar abilities”. Cragan et al (2009) state that
the rich and diverse back-grounds of members in a heterogonous group make them potentially more
capable of solving group problems compared to those in a homogeneous group. Relatively later
researchers also reveal that heterogeneous groups will tend to function better than homogeneous groups
(Barker 2005; Nicolay 2002). Other researchers (Braulche & Evans R 1998; Johnson D & Johnson R 2004)
are not in complete concurrence over this fact. They show that sometimes homogeneous groups (regarding
abilities, experiences and interests) tend to be better at achieving specific aims. An individuals’ motivation
to help group mates depends on their perception of whether their individual outcomes are linked to those of
their group mates. A study by Muehlenbrock (2006) also indicates that the combination of group formation
based on student profiles and user context information can improve grouping quality. Other researchers
(Braulche & Evans 1998; McConnell 2006; Nijstad & De Dreu 2002) favor instructor-chosen,
heterogeneous groups which are segregated on the basis of their GPA, abilities and personalities.
Some studies (Lejk 2008; Shaw 1976) indicate that mixed ability groupings relatively disadvantage more
capable students and tend to benefit below-average students. Later studies (Martin & Pardes 2004)
combine collaborative learning with learning styles in order to use them as a main feature to select students
in group formations. The parameter for homogeneity in this case is the learning styles itself, and activities
need to be tailored for these groups accordingly for better group performance. These are suitable for web
based courses that can be made self adaptable. The Australian Centre for the study of Higher Education
(ACHE), states “when effective group management processes are employed, clear guidelines developed
and communicated, and valid and fair grading processes employed, the likelihood of positive learning
outcomes and student satisfaction can be significantly increased. Alternatively, if students cannot see the
objective of group work, are unsure of what is expected of them, or believe the assessment methods are
invalid or simply unfair, the educational benefits are reduced and tensions can emerge. The 'best' selection
of group members, the 'optimal' roles and responsibilities that should be adopted and the 'ideal' conduct of
group meetings will all depend on the purpose and function of the group” (ACHE).
Collaboration also influences the interpersonal skills important to team building, a much required skill in
the modern workplace. A study by Webb et al (1998) indicates that high and low ability students had an
increased teacher/student relationship which increases verbal interaction, whereas medium ability level
students engaged in less interaction. Interactions of these students changed dynamically when placed in
heterogeneous groups. These results are also indicative of the fact that group composition can affect
individual collaboration and learning. Most of these studies indicate that groups composed of mixed
achievers increases the knowledge base, the analytical and evaluator levels brought to bear on the problem,
and consequently, the likelihood of a more optimal solution. This is notably true where the measurement is
the consolidated overall group achievement, but what must not be neglected is the need to measure the
improvement in learning, especially at the individual levels, which may not require the same group
dynamics.
The research question that this study aims at answering is “Is there a statistically significant difference in

                                                     26
Journal of Education and Practice                                                              www.iiste.org
ISSN 2222-1735 (Paper) ISSN 2222-288X (Online)
Vol 3, No 3, 2012


the individual amount of sustained learning among students if the group composition is made homogenous
rather than if the groups were heterogonous? “ Here homogeneity is primarily based on earlier individual
performance levels. The study also addresses intrinsic, though subjective, concerns raised earlier regarding
issues such as:
     • Did the group activity increase the level of enjoyment during the learning process?
     • Did the individual learn more by working in the group rather than if he/she worked on his own?
     • Did all team members contribute to the group work? What was the amount of individual
        contribution towards the group?
     • Did the interpersonal and intrapersonal interactions within the group improve cohesiveness?
Computer Science Education should not only focus on the basic concept of the discipline, but also the
processes and methods characteristic to that discipline (Zendler et al 2008; Hansen & Ratzer 2002). When a
curriculum is first developed, its designers must articulate intended learning outcomes that align with
competencies. Academic administrators must ensure that our academic programs deliver on the student
performance in the expressed competencies. Some researchers (Burrill 1976; Fretwell & Lewis 2001;
McDaniel 2005) make a mention that quality curriculum can only be created by linking curriculum design
and assessments to the needs of the workplace.
Not all educational interventions are amenable to rigorous quantitative experimental research. This paper
uses a mix of quantitative (relational research and a descriptive study) and qualitative research
methodologies to analyze the data (Consumer’s Guide to Education Research). Conclusions to the
questions enumerated above are drawn through an analysis of the feedback collected regarding the students’
attitudes and perceptions. The hypothesis stated above, is tested through a statistical analysis performed on
the data collected from the evaluation and assessments performed on the learners over a period of three
consecutive years by the same faculty. The results of this analysis could serve to inform and advise an
instructor in selecting an appropriate facilitation strategy.


2. Designing and Implementing the Activity
The purpose of the study was to explore the effect of homogenous groups in a collaborative learning
environment for a post graduate course. The study made use of individual scores obtained from pre and
post tests conducted on a specific module of the course. This component involves the analysis of business
requirements and the subsequent design of a solution (the design of the application for the business). This
activity is an ideal situation for collaboration and team work. The pre-test (consisting of sections
encompassing all levels of Blooms’ taxonomy) was possible as the students were from the third semester of
the course and had undergone an intermediate level course in an undergraduate degree program.
The faculty conducting this course has been facilitating a learner centric group activity for this competency
over the last few years. The curriculum design and conceptual requirements being followed was taken from
the framework (Pinto 2008). Teams are given the work of analyzing an application and presenting their
design to their peers. After the deliberations within the group, the learners had to make a presentation that
illustrated and explained the Entity Relationship Diagram which evolved from the given Case Study. The
activity was observed, and it was noted that these deliberations brought in diverse opinions and solutions to
aid in solving the problem. This helped the learners in improving their analytical skills and their skill to
critically interpret and evaluate the work of their peers. It also enhanced their ability to collaboratively
arrive at - and abide by - the groups’ consensus – an important requisite for a team to work harmoniously.
Group work being a very crucial and important activity involving multiple skill sets from many
contributors, these skill sets and ideas need to be harmoniously integrated before the entire team proceeds
to the next stage.
The peer teams would grade the designs based on pre-determined parameters given by the faculty. The
presentations are interspersed with questions, discussions and constructive criticism from the audience.
This proves to be a very useful activity as the learners are made to note the pros and cons of a design choice

                                                     27
Journal of Education and Practice                                                              www.iiste.org
ISSN 2222-1735 (Paper) ISSN 2222-288X (Online)
Vol 3, No 3, 2012


in different application scenarios. The learners also enhance their ability to synthesize and connect material
to their existing knowledge base. This process of integrating information gives them a much deeper
understanding of the subject. The faculty would then grade the reviews of the peer review teams to assess
the evaluation skills of the teams conducting the peer reviews.
In the years preceding this quasi-experiment, the groups that were formed were heterogeneous in nature
where the teams were composed of learners having different grade levels, but who were “friends”.
Although the groups had members with different academic achievement levels, being “friends” they spent
more time together as a “team”. The faculty observed that although the ‘team’ did well, the academically
lower achieving individuals in the team piggybacked on their team members and did not enhance their
learning substantially.
For this quasi- experiment, the pretest scores were used to form homogenous groups - students with
similar academic performance levels were made part of the same team. The aim of the formation of the
homogenous group was not to get the best output or design from all groups, but to get the maximum
participation and productivity from the individual members within a group. The results show that the
overall individual performance was better in this year as compared to when the groups were heterogeneous.
The measurements and assessment strategies were kept standard across the years.
After the completion of the activity, the learners were given a comprehensive feedback form that sought to
gain feedback on the clarity of the objectives and the effectiveness of the activity, the relevance of the case
and the amount of learning that took place (as an individual and as a member of a team). The answers were
sorted looking for common themes that arose from the subjective questions; percentages of students were
calculated for the categorical answers. A summary of the feedback is shown below:
    •    This activity proved to be a better learning method: 97%
    •    Were able to obtain a deeper understanding of the subject and the design issues and could thus
         evaluate their peers effectively: 90%;
    •    Groups were cohesive: 75%;
    •    Equal contribution to the Group: 71% (the remaining 29% mentioned that their contributions were
         at a high level);
    •    The case study was at an advanced level: 40%.
A Qualitative Analysis captured through comments/suggestions includes: “We learnt to be more creative
and reflect on our own work”; “We learnt to think logically”; “We learnt what went wrong with our
thinking”; “We could clear our confusions and doubts”; “Discussions help us to understand and analyze the
problem much better”; “Better subject understanding through a very interesting way of learning”; “We
grew from weak to effective”; “We learnt how to meet our deadlines without being stressed – it was fun”.
What clearly stood out was the fact that there was an active participation of every learner in the session and
the feedback revealed that each of the learners, even those who normally do not participate in the class, said
they had gained immensely from this stress-free interaction.
As mentioned earlier, the only difference in the activity in the year this quasi-experiment was conducted
was the homogeneity of the groups, which does not in any way bias the analysis of the collected data and
which has been presented in section 3. After the completion of the entire group activity and allowing some
time for assimilation, a post test (theory and skill evaluation) was conducted to find the amount of learning
that took place at the group and the individual level.


3. Data Analysis and Discussions
This section is structured by looking at the data analysis from two dimensions: Section 3.1 focuses on the
analysis of the quality of the formative assessment method itself and Section 3.2 is devoted to analyzing the
individual students’ performance at these assessments.


                                                      28
Journal of Education and Practice                                                                www.iiste.org
ISSN 2222-1735 (Paper) ISSN 2222-288X (Online)
Vol 3, No 3, 2012


3.1 The Summative Assessment Strategy
The instructional delivery, evaluation and assessment strategies that were followed conformed to Bloom's
taxonomy (Bloom et al 1956) and the Component Display Theory (Merrill 1994). Bloom’s taxonomy is a
classification system of educational objectives based on the level of student understanding necessary for
achievement or mastery of a subject. It contains six levels, with the principle that competence at a higher
level implies a reasonable degree of competence at the lower levels. Instructional designers can use
taxonomy concepts to guide the creation of the course content and the performance evaluation. The
Component Display Theory proposed by Merrill classifies learning along the dimensions of content and
performance. The theory specifies four primary presentation forms: rules, examples, recall and practice.
Secondary presentation forms include: prerequisites, objectives, helps, mnemonics, and feedback. The
theory specifies that instruction is more effective to the extent that it contains all necessary primary and
secondary forms. The theory suggests that for a given objective and a set of learners, there is a unique
combination of presentation forms that results in the most effective learning experience.
Section 3.1.1 deals with a discussion of the scoring rubric, followed by an analysis of the consolidated
performance levels for the pre-test and post-tests using these scales. Section 3.1.2 is devoted to analyzing
the quality of the assessment paper itself.


3.1.1: The Scoring Rubric and the Consolidated Pre and Post Performance.
Scoring rubrics are typically employed when a judgment of quality is required and may be used to evaluate
a broad range of subjects and activities (Moskal 2000). By developing a pre-defined scheme for the
evaluation process, the subjectivity involved in evaluating an assignment becomes more objective. The first
step in developing a scoring rubric is to clearly identify the qualities that need to be displayed in a student's
work to demonstrate proficient performance. The identified qualities will form the top level or levels of
scoring criteria for the scoring rubric. After defining the criteria for the top level of performance, the
evaluator's attention may be turned to defining the criteria for lowest level of performance. It is better to
have a few meaningful score categories then to have many score categories that are difficult or impossible
to distinguish (Brookhart 1999).
 The questions in the assessment tests, designed to assess the DataBase Design skill set, were evaluated on
a scale of 0 to 4 with the associated meaning as shown below. The following rubric was used as the
students could easily identify with the scales and which would subsequently help them in the peer reviews.
0 - Doesn’t know anything (most answers were guessed);
1 - Knows something but is very confused (cannot justify the answers properly);
2 - Knows something but some confusion still exists (answers may not be optimal, but can reason out the
answer);
3 - Sufficient amount of knowledge (clear understanding with minimal errors; can analyze and identify
optimal solutions)
4 – High Level of Knowledge and optimal solutions (can generate and evaluate multiple alternative and
correct solutions).
The Question Paper itself was organized as follows: Questions Q1, Q2, Q3 and Q4 were at the Level of
Knowledge and Comprehension; Question Q5 was an Application Level Question; Questions Q7 and Q9
were targeted at the Analysis and Application Levels; Questions Q6 had both an Analysis and Synthesis
orientation; Question Q8 was a question that involved the highest skill set on Evaluation. Each of the above
questions had subsections within them.
The result of the group activity conducted above was evaluated through Q7 and its impact can be seen from
the Bar Charts shown in Figure1 and Figure2. The Bar Chart in Figure1 displays the total number of
students who have scored various scale points at the different Question Levels at the Pre-Test; The bar

                                                       29
Journal of Education and Practice                                                                                                                                                  www.iiste.org
ISSN 2222-1735 (Paper) ISSN 2222-288X (Online)
Vol 3, No 3, 2012


chart of Figure2 displays the same parameters but at the Post-Test.


                                                    Consol_Pre_Test                                                                                  Consol_Post_Test
                             20                                                                                                20
                             18                                                                                                18
                             16                                                                                                16
                             14                                                                                                14
           No of students


                                                                                                           No of S tudents
                             12                                                                                                12
                             10                                                                                                10
                              8                                                                                                 8
                              6                                                                                                 6
                              4                                                                                                 4
                              2                                                                                                 2
                              0                                                                                                 0
                                           Q2(L1/L Q3(L1/L                                                                                     Q2(L1/ Q3(L1/
                                    Q1(L1)                 Q4(L2) Q5(L2)   Q7(L3) Q9(L4) Q6(L4)   Q8(L5)                              Q1(L1)                 Q4(L2) Q5(L2) Q7(L3) Q9(L4) Q6(L4) Q8(L5)
                                             2)      2)                                                                                         L2)    L2)
                            Pre 0     4      5       17     18      12       0      5      11       9                        Post 0     3        0      3      6      0      0      3      2      4
                            Pre 1     8      8       5       7      2        2      5      2       12                        Post 1     8        5      5      6      6      7      3      8      5
                            Pre 2    10      9       5       1      7       19      7      11       5                        Post 2     2        4      0      0      5      6      6      3      1
                            Pre 3     3      1       3      10      3        0      0      0        5                        Post 3     7       11      8      3      7      20     13     15     6
    Figure1: Bar 4 3 showing 0consolidation of 0PreTest Scores 0 Figure2: Bar 4chart showing consolidation2of PostTest Scores
              Pre chart 1          1     1          9     0                Post   5    12  10   2    11        8    4    7


An initial comparison of the graphs (Figure1 and Figure2) reveals the following points which are relevant
and important to this study:
(i)The amount of learning at the Comprehension level Questions Q2 and Q3 went up by a substantial
amount. This is an expected observation after a series of formal lecture sessions
(ii)Question 7, which was the question that evaluated the concepts after the group activity, had a maximum
amount of learning in all respects. The pre-test (Figure1) shows that 2 students had a scale of 1 and 19
students had a scale of 2 and no student had achieved the higher scales of 3 and 4; the rest not having
attempted the question. The Post-Test (Figure2) reveals that 7 students obtained a score of 1, 6 students
obtained a score of 2, 20 students achieved a score of 3, and 2 students achieved the highest score of 4.
What is also important to note is that a maximum number of students had the required jump in the
performance grade from 2 to 3 (from a “level of confusion” to a “level of sufficient amount of
knowledge”).

3.1.2: Analyzing the Question Paper:

To validate the quality of the assessment done, it is important to check the quality of the question paper
itself (Rudner & Schaffer). One of the useful indicators is the discrimination power (DP) of the tests’ items
(Matlock-Hetzel, 1997). Discrimination describes the ability to distinguish between more and less
knowledgeable students and contributes to the spread of scores of the examination. Easy questions are
usually poor discriminators while the questions that assess the higher order knowledge levels are better
discriminators.
The study revealed that the class conformed to the recommended pattern of learning and followed the
Gaussian distribution for their grades. This check was necessary as most of the underlying statistical
functions assume a normal distribution. The study, with a small sample size of 30, draws on the relational
research methodology by using various statistical functions to reach a specific conclusion thereby
establishing the empirical validity of the results. Statistical methods were chosen for the analysis of the data
as they are characterized by the ability to handle clean data sets which are small in size. Standard
deviation, being a mathematical formula measuring the average distance from the average, was chosen as
the measure for verifying the discriminating power of the questions. Question Q8, which tested the highest
level learning skill set, had the best discriminatory power. This was seen from the fact that the StdDev for
Q8 was the highest.
An important observation relevant to this study is the StdDev for Question 7 - which is the lowest. This also


                                                                                                  30
Journal of Education and Practice                                                               www.iiste.org
ISSN 2222-1735 (Paper) ISSN 2222-288X (Online)
Vol 3, No 3, 2012


substantiates the hypothesis that the kind of group activity performed helped to bring all learners to a
similar standard (which is a substantially high grade scale - scale level 3 - as seen from the bar chart in
Figure2).


3.2 Analyzing Student Performance
Since the data being analyzed covered a period of 3 years, a check was necessary to ensure the results of
the study were not affected by the variation in the quality of the teaching and the quality of the students
itself. The same faculty has been teaching the course for many years and the methods (instructional
delivery and activity) has been standardized for the past three years. Further, students are selected for
admission to the MCA degree program based on merit at a common nation wide entrance test that assesses
their general aptitude. This test evaluates the candidates’ logical, quantitative, qualitative and Visio-spatial
reasoning, high school mathematics, vocabulary, English comprehension and verbal ability.
To check that the quality of the students did not influence the study, an analysis of the internal consistency
of the general aptitude scores of the students at the entrance test to the program was performed. The
validity of the experiment can be verified by ensuring an acceptable standardization of the quality of the
students. The Cronbach’s test (Cronbach 1951; Bland & Altman 1997) was chosen over Kuder Richardson
(KR) Formula as the test scores were scalar data and not dichotomous in nature. This test is used to
measures the internal consistency or reliability in psychometric test scores for a sample of examinees. The
formula to compute the Cronbach’s alpha coefficient takes into account the number of components, the
average variance for the current sample of persons, and the average of all co variances between the
components across the samples. The higher the alpha value returned by the test, the more reliable is the
test. The general acceptable alpha value is above 0.7 (Nunnalli 1978; Gliem J. & Gleim R. 2003; Kromrey
et al 2008). After subjecting the entrance test scores to Cronbach’s test, an alpha value of 0.95 was
obtained, ensuring the internal consistency of the data and the validity of the entrance test.
The next step is to ensure that there was not much variation in the quality of the students across the three
years. To measure the diversity across the data samples, the standard quantitative statistical measures for
dispersion could not be used. What was needed was a test that measures qualitative variance that satisfies
the requirements of a categorical scale (Wilcox 1973; Kader & Perry 2007). The index of qualitative
variation (IQV) is a measure of variability with an index value that ranges from 0 to 1. When the cases in
the distribution are distributed evenly across the categories, there is a maximum diversity and IQV is 1.00
(Frankfort-Nachmias & Leon-Guerrero 2009). Gibbs & Poston’s (1975) formula for IQV was used to
measure the statistical dispersion in the samples. This formula takes into consideration the number of
categories and the proportion of observations that fall in a given category before applying a standardization
factor. The entrance test scores were categorized and the IQV for the 3 years was calculated and the values
are as shown in Table1. The data analysis reveals a high level of diversity of the data in each of the sample
      Year                   IQV          cases and a negligible amount of variation across the three years.
      Year1                  0.874        This indicates standardization in the quality of the students which
                                          would thus not bias the results of the experiment taking place over
      Year2                  0.856
                                          the three years.
      Year3                  0.867

Table 1: Index of Qualitative Variance for the three years


3.2.1 Comparing the Groups, Group Performances and Individual Learning Levels
The Correlation coefficient can be used as a measure of the strength and degree of the relationship between
two variables. Correlational evidence can tentatively inform evidence based practice when quasi -
experimental, relational research or descriptive studies are used (Thompson et al 2005; Centre for Public
Education (CPE)). Although Correlation cannot be used to infer a causal relationship between the variables,
it may be an indicator of a causal relationship (Somekh & Lewin 2005; Statsoft 2010). This statistical

                                                      31
Journal of Education and Practice                                                                  www.iiste.org
ISSN 2222-1735 (Paper) ISSN 2222-288X (Online)
Vol 3, No 3, 2012


measure will be used to answer the research question posed earlier.
To verify if a consistent and sustained amount of individual learning took place in the competency
involving the group activity (referred to as C1) was actually more in the year the groups were homogenous,
the students were once again evaluated at the traditional assessments conducted at an examination at the
end of the year. The performance scales at this evaluation range from a grade level of 4 (lowest) to 10
(highest). A score below a grade scale of 4 implies a “failure” in the course. The correlation between the
individual grades obtained at the end-semester examination that assessed this concept, and grades obtained
in an assessment that evaluated the group performance was found. The relevant statistical evidence is
shown in Table2.

           Year       G         N         G      G        G           I       I         I         CoRel
                    Type              Mode     AvDev     Var      Mode      AvDev     Var
           Year1    Hetero      30    8        1.348     2.815    7         1.210     2.177       0.267
           Year2    Hetero      30    7        1.115     1.970    7         1.308     2.650       0.234
           Year3    Homog       30    9        0.825     0.936    9         0.744     0.751       0.310

            Table 2: Statistics for Group and Individual Score Performances
(G and I in Table2 represent “Group” and “Individual”, respectively. N represents the number of
students)
Year1 and Year2, which had a heterogeneous group environment, shows a weak positive correlation
between the group grades and the individual grades; whereas the results for the Year3 which had groups
that was homogenous in nature, display a stronger – though moderate – correlation between the group
grades and the individual grades. Table2 also reveals the following pertinent findings for the Year3:
    •      The Average Deviation for the Homogeneous Groups and for the Individual Performances is the
           least.
    •      (ii)The Mode of the scores, both Group and Individual, is the highest for that year.
    •      (iii)The Variance in the scores is the least for the Individual scores when the learners formed a part
           of a Homogenous Group.
We need to further verify if the result achieved from the analysis of the data from the sample is a ‘real’
result or a result of ‘chance’. In order to determine the level of statistical significance, a function is needed
that represents the relationship between "magnitude" and "significance" of relations between the two
variables, depending on the sample size. In other words, that function would give the significance (p) level,
and would be informative of the probability of error involved in rejecting the idea that the relation in
question does not exist in the population (Statsoft 2010). Since educational research falls within the
discipline of the social sciences, an alpha level of 0.05 is an acceptable value (Fisher 1922; Stallings 1985),
although it still has a 5% probability of error. Specifically, since the significance depends mostly on the
                                               sample size, the larger the sample, the smaller the difference
       Year Group Type            p-values     needed to reach statistical significance (Somekh & Lewin
       Year1 Heterogeneous 0.08                2005). The significance test (p-values) returned for the above
       Year2 Heterogeneous 0.115               sample data is shown in Table3.
       Year3 Homogenous           0.05
        Table3: p-values for sample data

Rephrasing the research question stated at the onset of the study as:
  H0: There is no significant amount of individual learning in the case when the learning groups are
Homogenous in nature.


                                                       32
Journal of Education and Practice                                                                                                             www.iiste.org
ISSN 2222-1735 (Paper) ISSN 2222-288X (Online)
Vol 3, No 3, 2012


   H1: There is a significant amount of individual learning when the Homogenous learning groups are
formed.
H0 can be rejected as the statistical significance (p-value) of the result is <= 0.05 (the acceptable alpha) in
the Year3, when the group formations were homogenous. The study provides evidence to the fact that the
improvement in the individual learners’ performance did not occur by chance alone but was the result of the
instructional intervention. This conclusion will be reinforced by the descriptive study that follows in the
next section.

3.2.2: Analyzing the Retention Levels of the Individuals in the different Groups

Unlike the Post-test assessments which were conducted soon after the completion of the module, the
assessments done at the end-semester examination evaluates all the modules completed in the course. The
retention power of the individual can thus be observed for this activity based module vis-à-vis the other
modules. The following Table4 shows some interesting statistics of the performance levels of the individual
learner in all the modules conducted at the end semester examination vis-à-vis the competency module
comprising the group activity. The examination at the end of the semester is a traditional assessment
comprising questions from all the course modules and did not vary across the three years.
Year          Group Type       Average       Average           Mode         Mode                  AvgDev            AvgDev
                               Overall       C1                Overall      C1                    Overall           C1
                               Grade         Grade             Grade        Grade                 Grade             Grade
Year1         Hetero           6.517         6.034             7            7                     1.220             1.210
Year2         Hetero           6.069         7.310             8            7                     1.731             1.308
Year3         Homog            6.724         8.414             7            9                     1.339             0.744
Table 4: Interesting Statistics of Class Performance for the three Years (C1 represents the competency module)

When there is a relatively small sample size, analyzing the individual elements of the data itself may throw
a better light on the study. Table 4 together with Figures 3, 4 and 5 reveal some interesting statistics for the
homogenous group environment in the third year emphasizing the fact that the homogenous group is an
effective learning pedagogical strategy.

                        Year3_Homog_Group_Anal
                                                                                         Overall_Course_Perf                                 C1_Indiv


                                        10
    Grade point                          9
                                         8
                                         7
                                         6
                                         5
                                         4
                                         3
                                         2
                                         1
                                         0
                                              1   2    3   4   5   6   7    8   9   10   11 12    13    14 15   16 17   18   19 20   21 22   23   24   25   26 27   28 29

                                              6   9    6   7   7   9   8    5   6   6    9    5    4    4   5   7   8   5    5   9   7   8    7   7    8    6   7   10   5
                                              7   10   9   8   9   9   8    8   9   7    10   7    9
                                                                                                       Student
                                                                                                         8 7 8      8   8    8   9   7   9    9   8    9    9   9   9    9


                                       Figure 3: Graph of Individual (Overall Course and C1) Scores for Year3


The following analysis can be done for Year3:
       •   With the exception of a single individual, every learner had the C1 score grade higher than the

                                                                       33
Journal of Education and Practice                                                           www.iiste.org
ISSN 2222-1735 (Paper) ISSN 2222-288X (Online)
Vol 3, No 3, 2012


        overall course score.
    •   The Average Score for the C1 is significantly higher than the overall course average score.
    •   The Average Deviation for the C1 score is significantly lower than the average deviation for the
        overall course score.
    •   The Mode for the C1 score is two grade scales higher than the mode for overall course score
For the Year2, the graph in Figure 4 below, shows that 20% of the learners had obtained a C1 grade lower
than their overall course scores. Further, the Mode for the C1 score is a grade lower than the mode for
overall course score. Figure 5 shows that 48% of the learners had obtained a C1 score grade lower than
their overall course scores.


From the above data, it is clearly discernable that the mode and the average for the C1 grades at the end-
semester examination in the Year3 were significantly higher than the same for the previous years. Further,


                                                   34
Journal of Education and Practice                                                               www.iiste.org
ISSN 2222-1735 (Paper) ISSN 2222-288X (Online)
Vol 3, No 3, 2012


the Individual Average Deviation for the C1 is the least for that year. Another important observation is that
the individual C1 grades for a significantly large number of students in the earlier years (Year1 and 2) were
lower than their individual overall grade - indicating that many of the students piggybacked on the grades
of their team members when in heterogeneous groups; and their C1 concepts needed a comparable
improvement. This data analysis is in agreement with the hypothesis H1 formulated in this study.
5. Conclusion
The general perception has been that heterogeneous groups are necessary for effective Collaborative
Learning with the essence being the achievement of the group, and not necessarily the impact on individual
learning. The results of this study reveal that, when the focus is on individual learning, heterogeneity in
group formation is not a necessary condition. Although tentative, this study suggests that ‘homogeneity’ can
not only improve the individual’s learning ability, but also their levels of confidence. The lower achievers
tend to work harder to arrive at their peer standards and cannot “piggy-back” on the higher achievers. The
retention span also remains significantly longer for all learners in this learner centric activity.
Not only can group homogeneity/heterogeneity with respect to performance and academic intelligence be
considered during the formation of a group, but also individual learning styles/skills for a more productive
learning environment. The final aim would be to maximize the possibility of student success in an
enjoyable learning environment.


References
Barker, L.J., Garvin-Doxas, K. & Jackson, M.H.(2002), “Defensive climate in the computer science
                                 rd
classroom”, Proceedings of the 33 SIGSCE Technical Symposium on Computer Science Education 34(1), 43–47.
Doi 10.1145/563340.563354
Barker L.J.(2005), “When do group projects widen the student experience gap?”, Proceedings of the 10th
Annual SIGCSE Conference on Innovation and Technology in Computer Science Education (ITiCSE’05), 37(3), 276–
280. Doi 10.1145/1067445.1067521
Bell, T., Urhahne, D., Schanze, S. & Ploetzner, R.(2009), “Collaborative Inquiry Learning: models, tools
and challenges”, Research Report, International Journal of Science Education, 32(3), 349-377
Biggers, M., Tuba, Y. & Sweat, M.(2009), “Using Collaborative, Modified Peer Led Team Learning to
improve student success and retention in intro CS”, Proceedings of the 40th SIGSCE Technical Symposium on
Computer Science Education, 41(1),9-13 Doi 10.1145/1508865.1508872
Bland, J.M. & Altman D.G.(1997), “Statistics notes: Cronbach's alpha”, British Medical Journal, Feb 1997,
314:572
Bloom, B.S., Hastings, J.T. & Madaus, G.F.(1971), Taxonomy of Educational Objectives: The Classification of
Educational Goals, Handbook 1, Cognitive Domain. New York, McCay.
Bower, M. & Richards, D.(2006), “Collaborative learning: Some possibilities and limitations for students
and teachers”, Proceedings of the Conference for the Australasian Society for Computers in Learning in Tertiary
Education (ASCILITE’06), ACM Transactions on Computing Education ,9(1), 79-89.
Bradshaw, S.D. & Stasson M.F.(1995), “Explanations of individual-group performance differences: What
sort of “bonus” can be gained through group interaction?”, Small Group Research, 26(2), 296–308.
Brookhart, S. M.(1999), The Art and Science of Classroom Assessment: The Missing Part of Pedagogy. ASHE-
ERIC Higher Education Report, 27(1). Washington, DC: The George Washington University, Graduate School
of Education and Human Development
Burrill, G. C. (1976), “Competency based curriculum design: An experimental model for social service
workers”, Innovative Higher Education, 1(2), 132-138, Doi. 10.1007/BF01079492
                                                                                           nd
Cohen, E.G. (1994), Designing Groupwork Strategeies for the Heterogeneous Classroom, (2 Ed.), New York:
Teachers College Press.

                                                     35
Journal of Education and Practice                                                              www.iiste.org
ISSN 2222-1735 (Paper) ISSN 2222-288X (Online)
Vol 3, No 3, 2012


                                                                                                                th
Cragan, J. F., Kasch, C. R. & Wright, D.W.(2009), Communication in small groups: Theory, process, skills (7
Ed.). Lyn Uhl, Wadsworth Cengage Learning.
Cronbach, L. J.(1951), “Coefficient alpha and the internal structure of tests”, Psychometrika, 16(3), 297-334
Fisher, R.A.(1921), “On the “probable error” of a coefficient of correlation deduced from a small sample”,
Metron, 1 3-32. http://hdl.handle.net/2440/15169
Frankfort-Nachmias, C. & Leon-Guerrero A.(2009), Social Statistics for a Diverse Society, Sage publications,
Chapter 5.
Fretwell, D. H., Lewis, M.V. & Deij A. A.(2001),World Bank, “A Framework for defining and assessing
occupational and training standards in developing countries”.
Gardner, H.(2004), Changing Minds: The art and science of changing our own and other people's minds. Boston:
Harvard Business School Press.
Gibbs, J.P. & Poston, D.L. Jr.(1975), “The Division of Labor: Conceptualization and Related Measures”,
Social Forces 53 (3): 468–476, Doi 10.2307/2576589
Gliem, J.A. & Gliem, R.R.(2003), “Calculating, Interpreting and Reporting Cronbach’s Alpha Reliability
Coefficient for Likert-type Scales”, Proceedings of The Midwest Research to Practice Conference in Adult,
Continuing, and Community Education, Ohio
Hansen, K.M. & Ratzer, A.V.(2002), “Tool support for collaborative teaching and learning of object-
oriented Modeling”, ACM SIGCSE Bulletin, 34(3), 146–150.
Hill, G.W.(1982), “Group versus individual performance: Are N = 1 heads better than one?” Psychological
Bulletin, 91(3), 517–539.
Hoffman, J.(2002),”Flexible Grouping Strategies in the Multiage Classroom”, Theory into Practice,41(1),
Promoting Thinking through Peer Learning (Winter 2002),47-52.
Johnson, D.W. & Johnson, R.T.(2004), Assessing students in groups: promoting group responsibility and
individual accountability, Thousand Oaks, Ca: Corwin Press.
Kader, G.D. & Perry, M.(2007), “Variability for Categorical Variables”, Journal of Statistics Education, 15(2)
www.amstat.org/publications/jse/v15n2/kader.html
Kromrey, J.D., Romano, J. & Hibbard, S.(2008), “Alpha_CI: A SAS@ macro for Computing Confidence
Intervals for Coefficient alpha”, SAS Global Forum, Paper 230-2008.
Lejk, E.(2008), Management of cultural diversity in group assessment for learning, Centre for Excellence in
Teaching & Learning Assessment for Learning, CETL AfL, Univ of Northumbria.,
northumbria.ac.uk/static/5007/cetlpdf/emmaleyk. (Nov 24,2008)
Martin, E. & Paredes, P. (2004), “Using learning styles for dynamic group formation in adaptive
collaborative hypermedia systems”, Proceedings of the First International Workshop on Adaptive Hypermedia
and Collaborative Web-based Systems, AHCW, 188-198 www.ii.uam.es/~rcarro/AHCW04/MartinParedes.pdf.
Matlock-Hetzel, S.(1997), “Basic Concepts in item and test analysis”, Annual Meeting of the SouthWest
Educational Research Association, Austin, 1997, San Antonio. ED406441, www.eric.ed.gov, (Aug 2005).
McConnell, J. J.(2006), “Active and cooperative learning: further tips and tricks (part 3)”, SIGCSE Bulletin
38(2), 24–28.
McDaniel, E., Roth, B. & Miller M.(2005), National Defense University, Washington, DC, USA, “Concept
Mapping as a Tool for Curriculum Design”, Issues in Informing Science and Information Technology, 2, 505-512.
http://www.informingscience.org/proceedings/InSITE2005/I42f49McDa.pdf
McWhaw, K., Schnackerberg, H., Sclater, J. & Abrami, P.C.(2003), “From Cooperation to Collaboration:
Helping students become collaborative learners”, R.M. Gilles(Ed), Co-operative Learning: The Social and
intellectual outcomes of learning in groups. London: Routledge Falmer.
Mentz, E.,Van Der Walt, J.L. & Goosen L.(2008), “The effect of incorporating cooperative learning

                                                       36
Journal of Education and Practice                                                            www.iiste.org
ISSN 2222-1735 (Paper) ISSN 2222-288X (Online)
Vol 3, No 3, 2012


principles in pair programming for student teachers”, Computer Science Education,18(4), 247-260.
Moskal, B. M.(2000),”Scoring rubrics: what, when and how?”, Practical Assessment, Research & Evaluation,
7(3). http://PAREonline.net/
Muehlenbrock, M.(2006), “Learning group formation based on learner profile and context”,. International.
Journal on e-learning IJEL 5(1), 19–26.
Nicolay, J. A.(2002), “Group assessment in the online learning environment”, New Directives in Teaching
and Learning , 91(Fall), 43–53. Doi 10.1002/tl.65
Nijstad, B.A. &, De Dreu C.(2002), “Creativity and Group innovation”, Applied Psychology 51(3) , 400-406.
Nunnalli, J. C.(1978), Psychometric theory (2nd ed.). New York: McGraw-Hill
Palincsar, A.S & Herrenkohl, L.R.(1999), “Designing Collaborative Contexts: Lessons from three research
programs”, In A.M. O’donnell & A.King (Eds), Cognitive Perspectives on Peer Learning, 151-178.
Mahwah,NJ:Erlbaum.
Pinto, Y.(2008), “A Framework for Competency Based Curriculum Design for IT Courses”, Proceedings of
the International Conference on Education, Research and Innovation, IATED, Nov 2008, Spain, ISBN: 978-84-612-
5091-2, 107-124
Richards, D.(2009),”Designing project-based courses with a focus on group formation and Assessment”,
ACM Transactions on Computer Education, 9(1), Article 2. Doi 10.1145/1513593.1513595.
Rudner, L.M. & Schafer, W.D., What Teachers Need to Know about Assessment, Published by the National
Education Association
Rutherford, R.H.(2001), “Using personality inventories to help form teams for software engineering class
                               th
projects”, Proceedings of the 6 Annual Conference on Innovation and Technology in Computer Science Education,
SIGCSE Bulletin 33(3).73-77
Schroth, G., Pankake, A. & Gates, G.(1999), “A Comparison of Pedagogical Approaches to Teaching
Graduate Students in Educational Administration”, Journal of Instructional Psychology, Dec 1999.
Shaw, M.E(1976), Group dynamics: The psychology of small group behavior (3rd Ed.). New York: McGraw-Hill.
Somekh, B. & Lewin, C (2005). Research Methods in Social Sciences, Sage Publications.
Stallings, W.M.(1985), “Mind Your p’s and Alphas”, Educational Researcher, 14(9)            19-20, American
Educational Research association, http://www.jstor.org/stable/1174554
Thompson, B., Diamond, K.E., McWilliam, R., Snyder, P. & Snyder, S. (2005), “Evaluating the Quality of
Evidence from Correlational Research for Evidence-based practice”, Exceptional Children, 71(2) (Winter
issue), Ms #076-70-r.
Waite, W.M., Jackson, M.H., Diwan, A. & Leonardi, P.M.(2004), “Student culture versus group work in
                                        th
Computer Science”, Proceedings of the 35 SIGCSE Technical Symposium on Computer Science Education, ACM
SIGSCE Bulletin 36(1), 12-16
Webb, N.M., Nemer, K.M., Chizhik, A.W. & Sugrue, B. (1998), “Equity issues in collaborative group
assessment: Group composition and performance”, American Educational Research Journal, 35(4), 607–665.
Wilcox, A.R.(1973), “Indices of Qualitative variation and Political Measurement”, The Western Political
Quarterly, 26(2), 325-34.
Winn, W.(2002), “Current Trends in Educational Technology Research: The Study of Learning
Environments”, Educational Psychology Review, 14(3), 331-35
Zendler, A., Spannagel, C. & Klaudt, D.(2008), “Process as content in computer science education:
empirical determination of central processes”, Computer Science Education, 18(4), 231-245.
StatSoft,    Inc.       (2010).    Electronic   Statistics   Textbook.   Tulsa,   OK:     StatSoft.   WEB:
http://www.statsoft.com/textbook


                                                        37
Journal of Education and Practice                                                                  www.iiste.org
ISSN 2222-1735 (Paper) ISSN 2222-288X (Online)
Vol 3, No 3, 2012


Consumer’s        guide      to      Education      Research,        Center     for       Public      Education,
http://www.centerforpubliceducation.org.
Centre for the study of higher education, Assessing Learning in Australian Universities, Ideas, strategies and
resources      for       quality      in       student        assessment,     Assessing       group        work,
http://www.cshe.unimelb.edu.au/assessinglearning


                                                         38
International Journals Call for Paper
The IISTE, a U.S. publisher, is currently hosting the academic journals listed below. The peer review process of the following journals
usually takes LESS THAN 14 business days and IISTE usually publishes a qualified article within 30 days. Authors should
send their full paper to the following email address. More information can be found in the IISTE website : www.iiste.org

Business, Economics, Finance and Management               PAPER SUBMISSION EMAIL
European Journal of Business and Management               EJBM@iiste.org
Research Journal of Finance and Accounting                RJFA@iiste.org
Journal of Economics and Sustainable Development          JESD@iiste.org
Information and Knowledge Management                      IKM@iiste.org
Developing Country Studies                                DCS@iiste.org
Industrial Engineering Letters                            IEL@iiste.org


Physical Sciences, Mathematics and Chemistry              PAPER SUBMISSION EMAIL
Journal of Natural Sciences Research                      JNSR@iiste.org
Chemistry and Materials Research                          CMR@iiste.org
Mathematical Theory and Modeling                          MTM@iiste.org
Advances in Physics Theories and Applications             APTA@iiste.org
Chemical and Process Engineering Research                 CPER@iiste.org


Engineering, Technology and Systems                       PAPER SUBMISSION EMAIL
Computer Engineering and Intelligent Systems              CEIS@iiste.org
Innovative Systems Design and Engineering                 ISDE@iiste.org
Journal of Energy Technologies and Policy                 JETP@iiste.org
Information and Knowledge Management                      IKM@iiste.org
Control Theory and Informatics                            CTI@iiste.org
Journal of Information Engineering and Applications       JIEA@iiste.org
Industrial Engineering Letters                            IEL@iiste.org
Network and Complex Systems                               NCS@iiste.org


Environment, Civil, Materials Sciences                    PAPER SUBMISSION EMAIL
Journal of Environment and Earth Science                  JEES@iiste.org
Civil and Environmental Research                          CER@iiste.org
Journal of Natural Sciences Research                      JNSR@iiste.org
Civil and Environmental Research                          CER@iiste.org


Life Science, Food and Medical Sciences                   PAPER SUBMISSION EMAIL
Journal of Natural Sciences Research                      JNSR@iiste.org
Journal of Biology, Agriculture and Healthcare            JBAH@iiste.org
Food Science and Quality Management                       FSQM@iiste.org
Chemistry and Materials Research                          CMR@iiste.org


Education, and other Social Sciences                      PAPER SUBMISSION EMAIL
Journal of Education and Practice                         JEP@iiste.org
Journal of Law, Policy and Globalization                  JLPG@iiste.org                       Global knowledge sharing:
New Media and Mass Communication                          NMMC@iiste.org                       EBSCO, Index Copernicus, Ulrich's
Journal of Energy Technologies and Policy                 JETP@iiste.org                       Periodicals Directory, JournalTOCS, PKP
Historical Research Letter                                HRL@iiste.org                        Open Archives Harvester, Bielefeld
                                                                                               Academic Search Engine, Elektronische
Public Policy and Administration Research                 PPAR@iiste.org                       Zeitschriftenbibliothek EZB, Open J-Gate,
International Affairs and Global Strategy                 IAGS@iiste.org                       OCLC WorldCat, Universe Digtial Library ,
Research on Humanities and Social Sciences                RHSS@iiste.org                       NewJour, Google Scholar.

Developing Country Studies                                DCS@iiste.org                        IISTE is member of CrossRef. All journals
Arts and Design Studies                                   ADS@iiste.org                        have high IC Impact Factor Values (ICV).

More Related Content

What's hot

Course Evaluation Poster
Course Evaluation PosterCourse Evaluation Poster
Course Evaluation PosterBridget Hanley
 
Collaborative Learning for Educational Achievement
Collaborative Learning for Educational AchievementCollaborative Learning for Educational Achievement
Collaborative Learning for Educational Achievementiosrjce
 
Tecnología como soporte del aprendizaje colaborativo
Tecnología como soporte del aprendizaje colaborativoTecnología como soporte del aprendizaje colaborativo
Tecnología como soporte del aprendizaje colaborativoBenjamín González
 
Delialioglu and yildirim 2007
Delialioglu and yildirim 2007Delialioglu and yildirim 2007
Delialioglu and yildirim 2007Adam Simpson
 
A cognitive support system for pbl
A cognitive support system for pblA cognitive support system for pbl
A cognitive support system for pblarinazakiyya
 
Using e instruction’s® cps™ to support effective instruction
Using e instruction’s® cps™ to support effective instructionUsing e instruction’s® cps™ to support effective instruction
Using e instruction’s® cps™ to support effective instructionCCS Presentation Systems Inc.
 
PhD proposal presentation
PhD proposal presentationPhD proposal presentation
PhD proposal presentationMichael Rowe
 
Blended learning in clinical education
Blended learning in clinical educationBlended learning in clinical education
Blended learning in clinical educationMichael Rowe
 
Teacher+qualities+and+collaboration
Teacher+qualities+and+collaborationTeacher+qualities+and+collaboration
Teacher+qualities+and+collaborationJoanpan
 
NTLT 2012 - Good work in group work
NTLT 2012 - Good work in group workNTLT 2012 - Good work in group work
NTLT 2012 - Good work in group workNTLT Conference
 
Enhancing Learning In Psychology Online Course Management System: Tool for En...
Enhancing Learning In Psychology Online Course Management System: Tool for En...Enhancing Learning In Psychology Online Course Management System: Tool for En...
Enhancing Learning In Psychology Online Course Management System: Tool for En...paperpublications3
 
Dr. John Hamilton, Texas A&M University at Texarkana
Dr. John Hamilton, Texas A&M University at TexarkanaDr. John Hamilton, Texas A&M University at Texarkana
Dr. John Hamilton, Texas A&M University at TexarkanaWilliam Kritsonis
 
Impact of Academic and Social Factors on Education Performance of Students
Impact of Academic and Social Factors on Education Performance of StudentsImpact of Academic and Social Factors on Education Performance of Students
Impact of Academic and Social Factors on Education Performance of StudentsSubmissionResearchpa
 

What's hot (15)

Course Evaluation Poster
Course Evaluation PosterCourse Evaluation Poster
Course Evaluation Poster
 
Collaborative Learning for Educational Achievement
Collaborative Learning for Educational AchievementCollaborative Learning for Educational Achievement
Collaborative Learning for Educational Achievement
 
Shaiza
ShaizaShaiza
Shaiza
 
Tecnología como soporte del aprendizaje colaborativo
Tecnología como soporte del aprendizaje colaborativoTecnología como soporte del aprendizaje colaborativo
Tecnología como soporte del aprendizaje colaborativo
 
Delialioglu and yildirim 2007
Delialioglu and yildirim 2007Delialioglu and yildirim 2007
Delialioglu and yildirim 2007
 
A cognitive support system for pbl
A cognitive support system for pblA cognitive support system for pbl
A cognitive support system for pbl
 
Using e instruction’s® cps™ to support effective instruction
Using e instruction’s® cps™ to support effective instructionUsing e instruction’s® cps™ to support effective instruction
Using e instruction’s® cps™ to support effective instruction
 
OER as a Model for Enhanced Teaching and Learning
OER as a Model for Enhanced Teaching and LearningOER as a Model for Enhanced Teaching and Learning
OER as a Model for Enhanced Teaching and Learning
 
PhD proposal presentation
PhD proposal presentationPhD proposal presentation
PhD proposal presentation
 
Blended learning in clinical education
Blended learning in clinical educationBlended learning in clinical education
Blended learning in clinical education
 
Teacher+qualities+and+collaboration
Teacher+qualities+and+collaborationTeacher+qualities+and+collaboration
Teacher+qualities+and+collaboration
 
NTLT 2012 - Good work in group work
NTLT 2012 - Good work in group workNTLT 2012 - Good work in group work
NTLT 2012 - Good work in group work
 
Enhancing Learning In Psychology Online Course Management System: Tool for En...
Enhancing Learning In Psychology Online Course Management System: Tool for En...Enhancing Learning In Psychology Online Course Management System: Tool for En...
Enhancing Learning In Psychology Online Course Management System: Tool for En...
 
Dr. John Hamilton, Texas A&M University at Texarkana
Dr. John Hamilton, Texas A&M University at TexarkanaDr. John Hamilton, Texas A&M University at Texarkana
Dr. John Hamilton, Texas A&M University at Texarkana
 
Impact of Academic and Social Factors on Education Performance of Students
Impact of Academic and Social Factors on Education Performance of StudentsImpact of Academic and Social Factors on Education Performance of Students
Impact of Academic and Social Factors on Education Performance of Students
 

Viewers also liked

Research methodologies
Research methodologiesResearch methodologies
Research methodologieswtidwell
 
A time series analysis of the determinants of savings in namibia
A time series analysis of the determinants of savings in namibiaA time series analysis of the determinants of savings in namibia
A time series analysis of the determinants of savings in namibiaAlexander Decker
 
A transformational generative approach towards understanding al-istifham
A transformational  generative approach towards understanding al-istifhamA transformational  generative approach towards understanding al-istifham
A transformational generative approach towards understanding al-istifhamAlexander Decker
 
A trends of salmonella and antibiotic resistance
A trends of salmonella and antibiotic resistanceA trends of salmonella and antibiotic resistance
A trends of salmonella and antibiotic resistanceAlexander Decker
 
A unique common fixed point theorems in generalized d
A unique common fixed point theorems in generalized dA unique common fixed point theorems in generalized d
A unique common fixed point theorems in generalized dAlexander Decker
 
A universal model for managing the marketing executives in nigerian banks
A universal model for managing the marketing executives in nigerian banksA universal model for managing the marketing executives in nigerian banks
A universal model for managing the marketing executives in nigerian banksAlexander Decker
 
A usability evaluation framework for b2 c e commerce websites
A usability evaluation framework for b2 c e commerce websitesA usability evaluation framework for b2 c e commerce websites
A usability evaluation framework for b2 c e commerce websitesAlexander Decker
 
A validation of the adverse childhood experiences scale in
A validation of the adverse childhood experiences scale inA validation of the adverse childhood experiences scale in
A validation of the adverse childhood experiences scale inAlexander Decker
 
Abnormalities of hormones and inflammatory cytokines in women affected with p...
Abnormalities of hormones and inflammatory cytokines in women affected with p...Abnormalities of hormones and inflammatory cytokines in women affected with p...
Abnormalities of hormones and inflammatory cytokines in women affected with p...Alexander Decker
 

Viewers also liked (9)

Research methodologies
Research methodologiesResearch methodologies
Research methodologies
 
A time series analysis of the determinants of savings in namibia
A time series analysis of the determinants of savings in namibiaA time series analysis of the determinants of savings in namibia
A time series analysis of the determinants of savings in namibia
 
A transformational generative approach towards understanding al-istifham
A transformational  generative approach towards understanding al-istifhamA transformational  generative approach towards understanding al-istifham
A transformational generative approach towards understanding al-istifham
 
A trends of salmonella and antibiotic resistance
A trends of salmonella and antibiotic resistanceA trends of salmonella and antibiotic resistance
A trends of salmonella and antibiotic resistance
 
A unique common fixed point theorems in generalized d
A unique common fixed point theorems in generalized dA unique common fixed point theorems in generalized d
A unique common fixed point theorems in generalized d
 
A universal model for managing the marketing executives in nigerian banks
A universal model for managing the marketing executives in nigerian banksA universal model for managing the marketing executives in nigerian banks
A universal model for managing the marketing executives in nigerian banks
 
A usability evaluation framework for b2 c e commerce websites
A usability evaluation framework for b2 c e commerce websitesA usability evaluation framework for b2 c e commerce websites
A usability evaluation framework for b2 c e commerce websites
 
A validation of the adverse childhood experiences scale in
A validation of the adverse childhood experiences scale inA validation of the adverse childhood experiences scale in
A validation of the adverse childhood experiences scale in
 
Abnormalities of hormones and inflammatory cytokines in women affected with p...
Abnormalities of hormones and inflammatory cytokines in women affected with p...Abnormalities of hormones and inflammatory cytokines in women affected with p...
Abnormalities of hormones and inflammatory cytokines in women affected with p...
 

Similar to 11.the efficacy of homogeneous groups in enhancing individual learning

IMPACT_OF_COOPERATIVE_LEARNING_ON_GRADE.docx
IMPACT_OF_COOPERATIVE_LEARNING_ON_GRADE.docxIMPACT_OF_COOPERATIVE_LEARNING_ON_GRADE.docx
IMPACT_OF_COOPERATIVE_LEARNING_ON_GRADE.docxROLLYBALO1
 
Are Groups Working In The Information Technology Class
Are Groups Working In The Information Technology ClassAre Groups Working In The Information Technology Class
Are Groups Working In The Information Technology ClassAmy Cernava
 
An Investigation Into Students Perceptions Of Group Assignments
An Investigation Into Students  Perceptions Of Group AssignmentsAn Investigation Into Students  Perceptions Of Group Assignments
An Investigation Into Students Perceptions Of Group AssignmentsJennifer Daniel
 
Statistics On Cooperative Learning
Statistics On Cooperative LearningStatistics On Cooperative Learning
Statistics On Cooperative LearningJulie Brown
 
Benefits of Cooperative Learning in the Classroom
Benefits of Cooperative Learning in the ClassroomBenefits of Cooperative Learning in the Classroom
Benefits of Cooperative Learning in the ClassroomDr. Aries Cobb
 
14Critical Reading and Researching Main Ideas.docx
14Critical Reading and Researching Main Ideas.docx14Critical Reading and Researching Main Ideas.docx
14Critical Reading and Researching Main Ideas.docxmoggdede
 
Online assignment
Online assignmentOnline assignment
Online assignmentantonyge68
 
A Study Of Group Dynamics In Educational Leadership Cohort And Non-Cohort Groups
A Study Of Group Dynamics In Educational Leadership Cohort And Non-Cohort GroupsA Study Of Group Dynamics In Educational Leadership Cohort And Non-Cohort Groups
A Study Of Group Dynamics In Educational Leadership Cohort And Non-Cohort GroupsSean Flores
 
Adult Learning Theories ChartPart 1 Theories o.docx
Adult Learning Theories ChartPart 1  Theories o.docxAdult Learning Theories ChartPart 1  Theories o.docx
Adult Learning Theories ChartPart 1 Theories o.docxdaniahendric
 
Building the culture of cooperation among uae university female students
Building the culture of cooperation among uae university female studentsBuilding the culture of cooperation among uae university female students
Building the culture of cooperation among uae university female studentsAlexander Decker
 
7.effectiveteachingmethodsforlargerclasses
7.effectiveteachingmethodsforlargerclasses7.effectiveteachingmethodsforlargerclasses
7.effectiveteachingmethodsforlargerclassesrealhope
 
726 final product showcase
726 final product showcase726 final product showcase
726 final product showcaseemtinanalqurashi
 
SALT 2009 - Faculty Success
SALT 2009 - Faculty SuccessSALT 2009 - Faculty Success
SALT 2009 - Faculty SuccessPhil Ice
 
Collaborative Learning, Gender Groupings and Mathematics Performance
Collaborative Learning, Gender Groupings and Mathematics PerformanceCollaborative Learning, Gender Groupings and Mathematics Performance
Collaborative Learning, Gender Groupings and Mathematics PerformanceQUESTJOURNAL
 
Research ppnt
Research ppntResearch ppnt
Research ppnthdc002
 
Perceptions of Jawzjan University Engineering Undergraduates about the Collab...
Perceptions of Jawzjan University Engineering Undergraduates about the Collab...Perceptions of Jawzjan University Engineering Undergraduates about the Collab...
Perceptions of Jawzjan University Engineering Undergraduates about the Collab...ahmad shah qasemi
 
The effect of project based learning model with kwl worksheet on student crea...
The effect of project based learning model with kwl worksheet on student crea...The effect of project based learning model with kwl worksheet on student crea...
The effect of project based learning model with kwl worksheet on student crea...Alexander Decker
 

Similar to 11.the efficacy of homogeneous groups in enhancing individual learning (20)

IMPACT_OF_COOPERATIVE_LEARNING_ON_GRADE.docx
IMPACT_OF_COOPERATIVE_LEARNING_ON_GRADE.docxIMPACT_OF_COOPERATIVE_LEARNING_ON_GRADE.docx
IMPACT_OF_COOPERATIVE_LEARNING_ON_GRADE.docx
 
Are Groups Working In The Information Technology Class
Are Groups Working In The Information Technology ClassAre Groups Working In The Information Technology Class
Are Groups Working In The Information Technology Class
 
An Investigation Into Students Perceptions Of Group Assignments
An Investigation Into Students  Perceptions Of Group AssignmentsAn Investigation Into Students  Perceptions Of Group Assignments
An Investigation Into Students Perceptions Of Group Assignments
 
CapstoneFinal
CapstoneFinalCapstoneFinal
CapstoneFinal
 
Statistics On Cooperative Learning
Statistics On Cooperative LearningStatistics On Cooperative Learning
Statistics On Cooperative Learning
 
Benefits of Cooperative Learning in the Classroom
Benefits of Cooperative Learning in the ClassroomBenefits of Cooperative Learning in the Classroom
Benefits of Cooperative Learning in the Classroom
 
14Critical Reading and Researching Main Ideas.docx
14Critical Reading and Researching Main Ideas.docx14Critical Reading and Researching Main Ideas.docx
14Critical Reading and Researching Main Ideas.docx
 
Online assignment
Online assignmentOnline assignment
Online assignment
 
IRTpdpaper
IRTpdpaperIRTpdpaper
IRTpdpaper
 
A Study Of Group Dynamics In Educational Leadership Cohort And Non-Cohort Groups
A Study Of Group Dynamics In Educational Leadership Cohort And Non-Cohort GroupsA Study Of Group Dynamics In Educational Leadership Cohort And Non-Cohort Groups
A Study Of Group Dynamics In Educational Leadership Cohort And Non-Cohort Groups
 
Adult Learning Theories ChartPart 1 Theories o.docx
Adult Learning Theories ChartPart 1  Theories o.docxAdult Learning Theories ChartPart 1  Theories o.docx
Adult Learning Theories ChartPart 1 Theories o.docx
 
Building the culture of cooperation among uae university female students
Building the culture of cooperation among uae university female studentsBuilding the culture of cooperation among uae university female students
Building the culture of cooperation among uae university female students
 
7.effectiveteachingmethodsforlargerclasses
7.effectiveteachingmethodsforlargerclasses7.effectiveteachingmethodsforlargerclasses
7.effectiveteachingmethodsforlargerclasses
 
726 final product showcase
726 final product showcase726 final product showcase
726 final product showcase
 
SALT 2009 - Faculty Success
SALT 2009 - Faculty SuccessSALT 2009 - Faculty Success
SALT 2009 - Faculty Success
 
Collaborative Learning, Gender Groupings and Mathematics Performance
Collaborative Learning, Gender Groupings and Mathematics PerformanceCollaborative Learning, Gender Groupings and Mathematics Performance
Collaborative Learning, Gender Groupings and Mathematics Performance
 
Research ppnt
Research ppntResearch ppnt
Research ppnt
 
Perceptions of Jawzjan University Engineering Undergraduates about the Collab...
Perceptions of Jawzjan University Engineering Undergraduates about the Collab...Perceptions of Jawzjan University Engineering Undergraduates about the Collab...
Perceptions of Jawzjan University Engineering Undergraduates about the Collab...
 
Hamman stevens1
Hamman stevens1Hamman stevens1
Hamman stevens1
 
The effect of project based learning model with kwl worksheet on student crea...
The effect of project based learning model with kwl worksheet on student crea...The effect of project based learning model with kwl worksheet on student crea...
The effect of project based learning model with kwl worksheet on student crea...
 

More from Alexander Decker

A therapy for physical and mental fitness of school children
A therapy for physical and mental fitness of school childrenA therapy for physical and mental fitness of school children
A therapy for physical and mental fitness of school childrenAlexander Decker
 
A theory of efficiency for managing the marketing executives in nigerian banks
A theory of efficiency for managing the marketing executives in nigerian banksA theory of efficiency for managing the marketing executives in nigerian banks
A theory of efficiency for managing the marketing executives in nigerian banksAlexander Decker
 
A systematic evaluation of link budget for
A systematic evaluation of link budget forA systematic evaluation of link budget for
A systematic evaluation of link budget forAlexander Decker
 
A synthetic review of contraceptive supplies in punjab
A synthetic review of contraceptive supplies in punjabA synthetic review of contraceptive supplies in punjab
A synthetic review of contraceptive supplies in punjabAlexander Decker
 
A synthesis of taylor’s and fayol’s management approaches for managing market...
A synthesis of taylor’s and fayol’s management approaches for managing market...A synthesis of taylor’s and fayol’s management approaches for managing market...
A synthesis of taylor’s and fayol’s management approaches for managing market...Alexander Decker
 
A survey paper on sequence pattern mining with incremental
A survey paper on sequence pattern mining with incrementalA survey paper on sequence pattern mining with incremental
A survey paper on sequence pattern mining with incrementalAlexander Decker
 
A survey on live virtual machine migrations and its techniques
A survey on live virtual machine migrations and its techniquesA survey on live virtual machine migrations and its techniques
A survey on live virtual machine migrations and its techniquesAlexander Decker
 
A survey on data mining and analysis in hadoop and mongo db
A survey on data mining and analysis in hadoop and mongo dbA survey on data mining and analysis in hadoop and mongo db
A survey on data mining and analysis in hadoop and mongo dbAlexander Decker
 
A survey on challenges to the media cloud
A survey on challenges to the media cloudA survey on challenges to the media cloud
A survey on challenges to the media cloudAlexander Decker
 
A survey of provenance leveraged
A survey of provenance leveragedA survey of provenance leveraged
A survey of provenance leveragedAlexander Decker
 
A survey of private equity investments in kenya
A survey of private equity investments in kenyaA survey of private equity investments in kenya
A survey of private equity investments in kenyaAlexander Decker
 
A study to measures the financial health of
A study to measures the financial health ofA study to measures the financial health of
A study to measures the financial health ofAlexander Decker
 
A study to evaluate the attitude of faculty members of public universities of...
A study to evaluate the attitude of faculty members of public universities of...A study to evaluate the attitude of faculty members of public universities of...
A study to evaluate the attitude of faculty members of public universities of...Alexander Decker
 
A study to assess the knowledge regarding prevention of pneumonia among middl...
A study to assess the knowledge regarding prevention of pneumonia among middl...A study to assess the knowledge regarding prevention of pneumonia among middl...
A study to assess the knowledge regarding prevention of pneumonia among middl...Alexander Decker
 
A study regarding analyzing recessionary impact on fundamental determinants o...
A study regarding analyzing recessionary impact on fundamental determinants o...A study regarding analyzing recessionary impact on fundamental determinants o...
A study regarding analyzing recessionary impact on fundamental determinants o...Alexander Decker
 
A study on would be urban-migrants’ needs and necessities in rural bangladesh...
A study on would be urban-migrants’ needs and necessities in rural bangladesh...A study on would be urban-migrants’ needs and necessities in rural bangladesh...
A study on would be urban-migrants’ needs and necessities in rural bangladesh...Alexander Decker
 
A study on the evaluation of scientific creativity among science
A study on the evaluation of scientific creativity among scienceA study on the evaluation of scientific creativity among science
A study on the evaluation of scientific creativity among scienceAlexander Decker
 
A study on the antioxidant defense system in breast cancer patients.
A study on the antioxidant defense system in breast cancer patients.A study on the antioxidant defense system in breast cancer patients.
A study on the antioxidant defense system in breast cancer patients.Alexander Decker
 
A study on the dimensions of
A study on the dimensions ofA study on the dimensions of
A study on the dimensions ofAlexander Decker
 
A study on knowledge and practice of post menopausal women
A study on knowledge and practice of post menopausal womenA study on knowledge and practice of post menopausal women
A study on knowledge and practice of post menopausal womenAlexander Decker
 

More from Alexander Decker (20)

A therapy for physical and mental fitness of school children
A therapy for physical and mental fitness of school childrenA therapy for physical and mental fitness of school children
A therapy for physical and mental fitness of school children
 
A theory of efficiency for managing the marketing executives in nigerian banks
A theory of efficiency for managing the marketing executives in nigerian banksA theory of efficiency for managing the marketing executives in nigerian banks
A theory of efficiency for managing the marketing executives in nigerian banks
 
A systematic evaluation of link budget for
A systematic evaluation of link budget forA systematic evaluation of link budget for
A systematic evaluation of link budget for
 
A synthetic review of contraceptive supplies in punjab
A synthetic review of contraceptive supplies in punjabA synthetic review of contraceptive supplies in punjab
A synthetic review of contraceptive supplies in punjab
 
A synthesis of taylor’s and fayol’s management approaches for managing market...
A synthesis of taylor’s and fayol’s management approaches for managing market...A synthesis of taylor’s and fayol’s management approaches for managing market...
A synthesis of taylor’s and fayol’s management approaches for managing market...
 
A survey paper on sequence pattern mining with incremental
A survey paper on sequence pattern mining with incrementalA survey paper on sequence pattern mining with incremental
A survey paper on sequence pattern mining with incremental
 
A survey on live virtual machine migrations and its techniques
A survey on live virtual machine migrations and its techniquesA survey on live virtual machine migrations and its techniques
A survey on live virtual machine migrations and its techniques
 
A survey on data mining and analysis in hadoop and mongo db
A survey on data mining and analysis in hadoop and mongo dbA survey on data mining and analysis in hadoop and mongo db
A survey on data mining and analysis in hadoop and mongo db
 
A survey on challenges to the media cloud
A survey on challenges to the media cloudA survey on challenges to the media cloud
A survey on challenges to the media cloud
 
A survey of provenance leveraged
A survey of provenance leveragedA survey of provenance leveraged
A survey of provenance leveraged
 
A survey of private equity investments in kenya
A survey of private equity investments in kenyaA survey of private equity investments in kenya
A survey of private equity investments in kenya
 
A study to measures the financial health of
A study to measures the financial health ofA study to measures the financial health of
A study to measures the financial health of
 
A study to evaluate the attitude of faculty members of public universities of...
A study to evaluate the attitude of faculty members of public universities of...A study to evaluate the attitude of faculty members of public universities of...
A study to evaluate the attitude of faculty members of public universities of...
 
A study to assess the knowledge regarding prevention of pneumonia among middl...
A study to assess the knowledge regarding prevention of pneumonia among middl...A study to assess the knowledge regarding prevention of pneumonia among middl...
A study to assess the knowledge regarding prevention of pneumonia among middl...
 
A study regarding analyzing recessionary impact on fundamental determinants o...
A study regarding analyzing recessionary impact on fundamental determinants o...A study regarding analyzing recessionary impact on fundamental determinants o...
A study regarding analyzing recessionary impact on fundamental determinants o...
 
A study on would be urban-migrants’ needs and necessities in rural bangladesh...
A study on would be urban-migrants’ needs and necessities in rural bangladesh...A study on would be urban-migrants’ needs and necessities in rural bangladesh...
A study on would be urban-migrants’ needs and necessities in rural bangladesh...
 
A study on the evaluation of scientific creativity among science
A study on the evaluation of scientific creativity among scienceA study on the evaluation of scientific creativity among science
A study on the evaluation of scientific creativity among science
 
A study on the antioxidant defense system in breast cancer patients.
A study on the antioxidant defense system in breast cancer patients.A study on the antioxidant defense system in breast cancer patients.
A study on the antioxidant defense system in breast cancer patients.
 
A study on the dimensions of
A study on the dimensions ofA study on the dimensions of
A study on the dimensions of
 
A study on knowledge and practice of post menopausal women
A study on knowledge and practice of post menopausal womenA study on knowledge and practice of post menopausal women
A study on knowledge and practice of post menopausal women
 

Recently uploaded

GRADE 4 - SUMMATIVE TEST QUARTER 4 ALL SUBJECTS
GRADE 4 - SUMMATIVE TEST QUARTER 4 ALL SUBJECTSGRADE 4 - SUMMATIVE TEST QUARTER 4 ALL SUBJECTS
GRADE 4 - SUMMATIVE TEST QUARTER 4 ALL SUBJECTSJoshuaGantuangco2
 
Q4-PPT-Music9_Lesson-1-Romantic-Opera.pptx
Q4-PPT-Music9_Lesson-1-Romantic-Opera.pptxQ4-PPT-Music9_Lesson-1-Romantic-Opera.pptx
Q4-PPT-Music9_Lesson-1-Romantic-Opera.pptxlancelewisportillo
 
Grade 9 Quarter 4 Dll Grade 9 Quarter 4 DLL.pdf
Grade 9 Quarter 4 Dll Grade 9 Quarter 4 DLL.pdfGrade 9 Quarter 4 Dll Grade 9 Quarter 4 DLL.pdf
Grade 9 Quarter 4 Dll Grade 9 Quarter 4 DLL.pdfJemuel Francisco
 
THEORIES OF ORGANIZATION-PUBLIC ADMINISTRATION
THEORIES OF ORGANIZATION-PUBLIC ADMINISTRATIONTHEORIES OF ORGANIZATION-PUBLIC ADMINISTRATION
THEORIES OF ORGANIZATION-PUBLIC ADMINISTRATIONHumphrey A Beña
 
Choosing the Right CBSE School A Comprehensive Guide for Parents
Choosing the Right CBSE School A Comprehensive Guide for ParentsChoosing the Right CBSE School A Comprehensive Guide for Parents
Choosing the Right CBSE School A Comprehensive Guide for Parentsnavabharathschool99
 
Visit to a blind student's school🧑‍🦯🧑‍🦯(community medicine)
Visit to a blind student's school🧑‍🦯🧑‍🦯(community medicine)Visit to a blind student's school🧑‍🦯🧑‍🦯(community medicine)
Visit to a blind student's school🧑‍🦯🧑‍🦯(community medicine)lakshayb543
 
Integumentary System SMP B. Pharm Sem I.ppt
Integumentary System SMP B. Pharm Sem I.pptIntegumentary System SMP B. Pharm Sem I.ppt
Integumentary System SMP B. Pharm Sem I.pptshraddhaparab530
 
ClimART Action | eTwinning Project
ClimART Action    |    eTwinning ProjectClimART Action    |    eTwinning Project
ClimART Action | eTwinning Projectjordimapav
 
How to Add Barcode on PDF Report in Odoo 17
How to Add Barcode on PDF Report in Odoo 17How to Add Barcode on PDF Report in Odoo 17
How to Add Barcode on PDF Report in Odoo 17Celine George
 
Concurrency Control in Database Management system
Concurrency Control in Database Management systemConcurrency Control in Database Management system
Concurrency Control in Database Management systemChristalin Nelson
 
Millenials and Fillennials (Ethical Challenge and Responses).pptx
Millenials and Fillennials (Ethical Challenge and Responses).pptxMillenials and Fillennials (Ethical Challenge and Responses).pptx
Millenials and Fillennials (Ethical Challenge and Responses).pptxJanEmmanBrigoli
 
Transaction Management in Database Management System
Transaction Management in Database Management SystemTransaction Management in Database Management System
Transaction Management in Database Management SystemChristalin Nelson
 
TEACHER REFLECTION FORM (NEW SET........).docx
TEACHER REFLECTION FORM (NEW SET........).docxTEACHER REFLECTION FORM (NEW SET........).docx
TEACHER REFLECTION FORM (NEW SET........).docxruthvilladarez
 
Influencing policy (training slides from Fast Track Impact)
Influencing policy (training slides from Fast Track Impact)Influencing policy (training slides from Fast Track Impact)
Influencing policy (training slides from Fast Track Impact)Mark Reed
 
Keynote by Prof. Wurzer at Nordex about IP-design
Keynote by Prof. Wurzer at Nordex about IP-designKeynote by Prof. Wurzer at Nordex about IP-design
Keynote by Prof. Wurzer at Nordex about IP-designMIPLM
 
ICS2208 Lecture6 Notes for SL spaces.pdf
ICS2208 Lecture6 Notes for SL spaces.pdfICS2208 Lecture6 Notes for SL spaces.pdf
ICS2208 Lecture6 Notes for SL spaces.pdfVanessa Camilleri
 
Presentation Activity 2. Unit 3 transv.pptx
Presentation Activity 2. Unit 3 transv.pptxPresentation Activity 2. Unit 3 transv.pptx
Presentation Activity 2. Unit 3 transv.pptxRosabel UA
 

Recently uploaded (20)

Paradigm shift in nursing research by RS MEHTA
Paradigm shift in nursing research by RS MEHTAParadigm shift in nursing research by RS MEHTA
Paradigm shift in nursing research by RS MEHTA
 
GRADE 4 - SUMMATIVE TEST QUARTER 4 ALL SUBJECTS
GRADE 4 - SUMMATIVE TEST QUARTER 4 ALL SUBJECTSGRADE 4 - SUMMATIVE TEST QUARTER 4 ALL SUBJECTS
GRADE 4 - SUMMATIVE TEST QUARTER 4 ALL SUBJECTS
 
Q4-PPT-Music9_Lesson-1-Romantic-Opera.pptx
Q4-PPT-Music9_Lesson-1-Romantic-Opera.pptxQ4-PPT-Music9_Lesson-1-Romantic-Opera.pptx
Q4-PPT-Music9_Lesson-1-Romantic-Opera.pptx
 
INCLUSIVE EDUCATION PRACTICES FOR TEACHERS AND TRAINERS.pptx
INCLUSIVE EDUCATION PRACTICES FOR TEACHERS AND TRAINERS.pptxINCLUSIVE EDUCATION PRACTICES FOR TEACHERS AND TRAINERS.pptx
INCLUSIVE EDUCATION PRACTICES FOR TEACHERS AND TRAINERS.pptx
 
YOUVE_GOT_EMAIL_PRELIMS_EL_DORADO_2024.pptx
YOUVE_GOT_EMAIL_PRELIMS_EL_DORADO_2024.pptxYOUVE_GOT_EMAIL_PRELIMS_EL_DORADO_2024.pptx
YOUVE_GOT_EMAIL_PRELIMS_EL_DORADO_2024.pptx
 
Grade 9 Quarter 4 Dll Grade 9 Quarter 4 DLL.pdf
Grade 9 Quarter 4 Dll Grade 9 Quarter 4 DLL.pdfGrade 9 Quarter 4 Dll Grade 9 Quarter 4 DLL.pdf
Grade 9 Quarter 4 Dll Grade 9 Quarter 4 DLL.pdf
 
THEORIES OF ORGANIZATION-PUBLIC ADMINISTRATION
THEORIES OF ORGANIZATION-PUBLIC ADMINISTRATIONTHEORIES OF ORGANIZATION-PUBLIC ADMINISTRATION
THEORIES OF ORGANIZATION-PUBLIC ADMINISTRATION
 
Choosing the Right CBSE School A Comprehensive Guide for Parents
Choosing the Right CBSE School A Comprehensive Guide for ParentsChoosing the Right CBSE School A Comprehensive Guide for Parents
Choosing the Right CBSE School A Comprehensive Guide for Parents
 
Visit to a blind student's school🧑‍🦯🧑‍🦯(community medicine)
Visit to a blind student's school🧑‍🦯🧑‍🦯(community medicine)Visit to a blind student's school🧑‍🦯🧑‍🦯(community medicine)
Visit to a blind student's school🧑‍🦯🧑‍🦯(community medicine)
 
Integumentary System SMP B. Pharm Sem I.ppt
Integumentary System SMP B. Pharm Sem I.pptIntegumentary System SMP B. Pharm Sem I.ppt
Integumentary System SMP B. Pharm Sem I.ppt
 
ClimART Action | eTwinning Project
ClimART Action    |    eTwinning ProjectClimART Action    |    eTwinning Project
ClimART Action | eTwinning Project
 
How to Add Barcode on PDF Report in Odoo 17
How to Add Barcode on PDF Report in Odoo 17How to Add Barcode on PDF Report in Odoo 17
How to Add Barcode on PDF Report in Odoo 17
 
Concurrency Control in Database Management system
Concurrency Control in Database Management systemConcurrency Control in Database Management system
Concurrency Control in Database Management system
 
Millenials and Fillennials (Ethical Challenge and Responses).pptx
Millenials and Fillennials (Ethical Challenge and Responses).pptxMillenials and Fillennials (Ethical Challenge and Responses).pptx
Millenials and Fillennials (Ethical Challenge and Responses).pptx
 
Transaction Management in Database Management System
Transaction Management in Database Management SystemTransaction Management in Database Management System
Transaction Management in Database Management System
 
TEACHER REFLECTION FORM (NEW SET........).docx
TEACHER REFLECTION FORM (NEW SET........).docxTEACHER REFLECTION FORM (NEW SET........).docx
TEACHER REFLECTION FORM (NEW SET........).docx
 
Influencing policy (training slides from Fast Track Impact)
Influencing policy (training slides from Fast Track Impact)Influencing policy (training slides from Fast Track Impact)
Influencing policy (training slides from Fast Track Impact)
 
Keynote by Prof. Wurzer at Nordex about IP-design
Keynote by Prof. Wurzer at Nordex about IP-designKeynote by Prof. Wurzer at Nordex about IP-design
Keynote by Prof. Wurzer at Nordex about IP-design
 
ICS2208 Lecture6 Notes for SL spaces.pdf
ICS2208 Lecture6 Notes for SL spaces.pdfICS2208 Lecture6 Notes for SL spaces.pdf
ICS2208 Lecture6 Notes for SL spaces.pdf
 
Presentation Activity 2. Unit 3 transv.pptx
Presentation Activity 2. Unit 3 transv.pptxPresentation Activity 2. Unit 3 transv.pptx
Presentation Activity 2. Unit 3 transv.pptx
 

11.the efficacy of homogeneous groups in enhancing individual learning

  • 1. Journal of Education and Practice www.iiste.org ISSN 2222-1735 (Paper) ISSN 2222-288X (Online) Vol 3, No 3, 2012 The efficacy of homogeneous groups in enhancing individual learning Yma Pinto* Department of Computer Science and Technology, Goa University, India - 403206 * E-mail of the corresponding author: yp@unigoa.ac.in; Abstract One possible enhancement to improving both the teaching and the learning process is an appropriate design of a learning environment. Collaborative learning, if appropriately used, has been one such tool that has been known to benefit learners. An issue that needs to be addressed, and one that can affect individual learning is the nature of the group composition in a collaborative environment. This paper analyzes the results of an experiment that was conducted on a module in a computer science degree course. The study sought to find the relevance of group composition to the amount of individual student learning. The underlying pedagogical approach for this activity is a collaborative learning experience through team work using heterogeneous and homogeneous groups. The analysis reveals a significant improvement in individual student performance in the year the groups were made homogenous. Keywords: collaborative learning, improving classroom teaching, pedagogical issues, teaching/learning strategies, computer science education. 1. Introduction An important and pertinent fact that requires noting is that besides the basic concepts of a discipline, effective learning methodologies characteristic to that discipline are relevant to knowledge delivery. Schroth et al (1999) have done a comparison of various pedagogical approaches and their results show that students experience more value, enjoyment and long-term influences of these activities as compared to taking exams and writing papers, which were viewed as neither valuable nor enjoyable. Thus, computer science education should also include within its curriculum design; processes, methods and models (Hansen & Ratzer 2002). One such approach to effective and sustained learning through cross-fertilization of ideas is the Collaborative Learning approach. This pedagogical technique helps refine multiple intelligences of the learner like Linguistic, Intrapersonal and InterPersonal (Gardner 2004) and Visuo – Auditory, while simultaneously exposing the learner to the higher skill levels in the Bloom’s Taxonomy (Bloom et al 1971). Theoretically, an important predictor of the value of a collaborative learning experience is the group’s ability to understand, opine, share and construct new knowledge from the individual knowledge bases. Team members evolve after evaluating, assimilating and synthesizing both complementary and supplementary information and arriving at a common consensus. Rather than producing technology savvy individuals who lack flexibility and versatility, collaborative learning results in acquisition of a broader range of skills through interactivity with others, a pre-requisite for sustainable employability. It is a well researched and a known fact that a group performance is better than that of an individual (Hill 1982; Bradshaw & Stasson 1995; Richards 2009; Biggers et al 2009). In a collaborative learner centric instructional delivery approach, groups of learners and their facilitator work in a more complex environment in comparison to a lecture-based delivery. They take on roles, contribute ideas, and critique each other’s work, and together solve aspects of larger problems. There is a rich body of literature that points to benefits associated with this approach to learning (McWhaw et al 2003; Mentz et al, 2008; Muehlenbrock 2006; Palincsar & Herrenkohl 1999; Waite et al 2004). Cooperation with peers helps in deeper understanding and when necessary adapts the individuals’ concepts. From an intuitive 25
  • 2. Journal of Education and Practice www.iiste.org ISSN 2222-1735 (Paper) ISSN 2222-288X (Online) Vol 3, No 3, 2012 standpoint, the knowledge that the group members bring to bear on the problem and how this knowledge is shared, understood, and further developed (or not) ultimately shape both the process and the product of the collaboration. Barker et al (2002) forewarns that simply requiring students to work in groups does not necessarily lead to improved learning outcomes. Sometimes, the environment within a typical computer science classroom has been found to be defensive resulting in students who are reluctant to collaborate (Barker et al 2002). Other reasons preventing a positive attitude to group work include fear of plagiarism, freeloading, ego, effort, and communication overheads (Bell et al 2009; Bower & Richards 2006; Winn 2002). Further, assessments of group performance may lead to anomalies in individual assessment. On the strength of the above research, it is advisable that academicians use group work as a means of active learning rather than for assessments. There are several factors by which academics can choose groups (Cohen 1994; Hoffman 2002; Rutherford 2001). Shaw( 1976) predicts that “groups composed of members having diverse, relevant abilities perform more effectively than groups composed of members having similar abilities”. Cragan et al (2009) state that the rich and diverse back-grounds of members in a heterogonous group make them potentially more capable of solving group problems compared to those in a homogeneous group. Relatively later researchers also reveal that heterogeneous groups will tend to function better than homogeneous groups (Barker 2005; Nicolay 2002). Other researchers (Braulche & Evans R 1998; Johnson D & Johnson R 2004) are not in complete concurrence over this fact. They show that sometimes homogeneous groups (regarding abilities, experiences and interests) tend to be better at achieving specific aims. An individuals’ motivation to help group mates depends on their perception of whether their individual outcomes are linked to those of their group mates. A study by Muehlenbrock (2006) also indicates that the combination of group formation based on student profiles and user context information can improve grouping quality. Other researchers (Braulche & Evans 1998; McConnell 2006; Nijstad & De Dreu 2002) favor instructor-chosen, heterogeneous groups which are segregated on the basis of their GPA, abilities and personalities. Some studies (Lejk 2008; Shaw 1976) indicate that mixed ability groupings relatively disadvantage more capable students and tend to benefit below-average students. Later studies (Martin & Pardes 2004) combine collaborative learning with learning styles in order to use them as a main feature to select students in group formations. The parameter for homogeneity in this case is the learning styles itself, and activities need to be tailored for these groups accordingly for better group performance. These are suitable for web based courses that can be made self adaptable. The Australian Centre for the study of Higher Education (ACHE), states “when effective group management processes are employed, clear guidelines developed and communicated, and valid and fair grading processes employed, the likelihood of positive learning outcomes and student satisfaction can be significantly increased. Alternatively, if students cannot see the objective of group work, are unsure of what is expected of them, or believe the assessment methods are invalid or simply unfair, the educational benefits are reduced and tensions can emerge. The 'best' selection of group members, the 'optimal' roles and responsibilities that should be adopted and the 'ideal' conduct of group meetings will all depend on the purpose and function of the group” (ACHE). Collaboration also influences the interpersonal skills important to team building, a much required skill in the modern workplace. A study by Webb et al (1998) indicates that high and low ability students had an increased teacher/student relationship which increases verbal interaction, whereas medium ability level students engaged in less interaction. Interactions of these students changed dynamically when placed in heterogeneous groups. These results are also indicative of the fact that group composition can affect individual collaboration and learning. Most of these studies indicate that groups composed of mixed achievers increases the knowledge base, the analytical and evaluator levels brought to bear on the problem, and consequently, the likelihood of a more optimal solution. This is notably true where the measurement is the consolidated overall group achievement, but what must not be neglected is the need to measure the improvement in learning, especially at the individual levels, which may not require the same group dynamics. The research question that this study aims at answering is “Is there a statistically significant difference in 26
  • 3. Journal of Education and Practice www.iiste.org ISSN 2222-1735 (Paper) ISSN 2222-288X (Online) Vol 3, No 3, 2012 the individual amount of sustained learning among students if the group composition is made homogenous rather than if the groups were heterogonous? “ Here homogeneity is primarily based on earlier individual performance levels. The study also addresses intrinsic, though subjective, concerns raised earlier regarding issues such as: • Did the group activity increase the level of enjoyment during the learning process? • Did the individual learn more by working in the group rather than if he/she worked on his own? • Did all team members contribute to the group work? What was the amount of individual contribution towards the group? • Did the interpersonal and intrapersonal interactions within the group improve cohesiveness? Computer Science Education should not only focus on the basic concept of the discipline, but also the processes and methods characteristic to that discipline (Zendler et al 2008; Hansen & Ratzer 2002). When a curriculum is first developed, its designers must articulate intended learning outcomes that align with competencies. Academic administrators must ensure that our academic programs deliver on the student performance in the expressed competencies. Some researchers (Burrill 1976; Fretwell & Lewis 2001; McDaniel 2005) make a mention that quality curriculum can only be created by linking curriculum design and assessments to the needs of the workplace. Not all educational interventions are amenable to rigorous quantitative experimental research. This paper uses a mix of quantitative (relational research and a descriptive study) and qualitative research methodologies to analyze the data (Consumer’s Guide to Education Research). Conclusions to the questions enumerated above are drawn through an analysis of the feedback collected regarding the students’ attitudes and perceptions. The hypothesis stated above, is tested through a statistical analysis performed on the data collected from the evaluation and assessments performed on the learners over a period of three consecutive years by the same faculty. The results of this analysis could serve to inform and advise an instructor in selecting an appropriate facilitation strategy. 2. Designing and Implementing the Activity The purpose of the study was to explore the effect of homogenous groups in a collaborative learning environment for a post graduate course. The study made use of individual scores obtained from pre and post tests conducted on a specific module of the course. This component involves the analysis of business requirements and the subsequent design of a solution (the design of the application for the business). This activity is an ideal situation for collaboration and team work. The pre-test (consisting of sections encompassing all levels of Blooms’ taxonomy) was possible as the students were from the third semester of the course and had undergone an intermediate level course in an undergraduate degree program. The faculty conducting this course has been facilitating a learner centric group activity for this competency over the last few years. The curriculum design and conceptual requirements being followed was taken from the framework (Pinto 2008). Teams are given the work of analyzing an application and presenting their design to their peers. After the deliberations within the group, the learners had to make a presentation that illustrated and explained the Entity Relationship Diagram which evolved from the given Case Study. The activity was observed, and it was noted that these deliberations brought in diverse opinions and solutions to aid in solving the problem. This helped the learners in improving their analytical skills and their skill to critically interpret and evaluate the work of their peers. It also enhanced their ability to collaboratively arrive at - and abide by - the groups’ consensus – an important requisite for a team to work harmoniously. Group work being a very crucial and important activity involving multiple skill sets from many contributors, these skill sets and ideas need to be harmoniously integrated before the entire team proceeds to the next stage. The peer teams would grade the designs based on pre-determined parameters given by the faculty. The presentations are interspersed with questions, discussions and constructive criticism from the audience. This proves to be a very useful activity as the learners are made to note the pros and cons of a design choice 27
  • 4. Journal of Education and Practice www.iiste.org ISSN 2222-1735 (Paper) ISSN 2222-288X (Online) Vol 3, No 3, 2012 in different application scenarios. The learners also enhance their ability to synthesize and connect material to their existing knowledge base. This process of integrating information gives them a much deeper understanding of the subject. The faculty would then grade the reviews of the peer review teams to assess the evaluation skills of the teams conducting the peer reviews. In the years preceding this quasi-experiment, the groups that were formed were heterogeneous in nature where the teams were composed of learners having different grade levels, but who were “friends”. Although the groups had members with different academic achievement levels, being “friends” they spent more time together as a “team”. The faculty observed that although the ‘team’ did well, the academically lower achieving individuals in the team piggybacked on their team members and did not enhance their learning substantially. For this quasi- experiment, the pretest scores were used to form homogenous groups - students with similar academic performance levels were made part of the same team. The aim of the formation of the homogenous group was not to get the best output or design from all groups, but to get the maximum participation and productivity from the individual members within a group. The results show that the overall individual performance was better in this year as compared to when the groups were heterogeneous. The measurements and assessment strategies were kept standard across the years. After the completion of the activity, the learners were given a comprehensive feedback form that sought to gain feedback on the clarity of the objectives and the effectiveness of the activity, the relevance of the case and the amount of learning that took place (as an individual and as a member of a team). The answers were sorted looking for common themes that arose from the subjective questions; percentages of students were calculated for the categorical answers. A summary of the feedback is shown below: • This activity proved to be a better learning method: 97% • Were able to obtain a deeper understanding of the subject and the design issues and could thus evaluate their peers effectively: 90%; • Groups were cohesive: 75%; • Equal contribution to the Group: 71% (the remaining 29% mentioned that their contributions were at a high level); • The case study was at an advanced level: 40%. A Qualitative Analysis captured through comments/suggestions includes: “We learnt to be more creative and reflect on our own work”; “We learnt to think logically”; “We learnt what went wrong with our thinking”; “We could clear our confusions and doubts”; “Discussions help us to understand and analyze the problem much better”; “Better subject understanding through a very interesting way of learning”; “We grew from weak to effective”; “We learnt how to meet our deadlines without being stressed – it was fun”. What clearly stood out was the fact that there was an active participation of every learner in the session and the feedback revealed that each of the learners, even those who normally do not participate in the class, said they had gained immensely from this stress-free interaction. As mentioned earlier, the only difference in the activity in the year this quasi-experiment was conducted was the homogeneity of the groups, which does not in any way bias the analysis of the collected data and which has been presented in section 3. After the completion of the entire group activity and allowing some time for assimilation, a post test (theory and skill evaluation) was conducted to find the amount of learning that took place at the group and the individual level. 3. Data Analysis and Discussions This section is structured by looking at the data analysis from two dimensions: Section 3.1 focuses on the analysis of the quality of the formative assessment method itself and Section 3.2 is devoted to analyzing the individual students’ performance at these assessments. 28
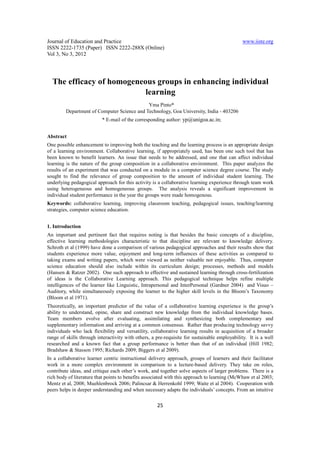
  • 5. Journal of Education and Practice www.iiste.org ISSN 2222-1735 (Paper) ISSN 2222-288X (Online) Vol 3, No 3, 2012 3.1 The Summative Assessment Strategy The instructional delivery, evaluation and assessment strategies that were followed conformed to Bloom's taxonomy (Bloom et al 1956) and the Component Display Theory (Merrill 1994). Bloom’s taxonomy is a classification system of educational objectives based on the level of student understanding necessary for achievement or mastery of a subject. It contains six levels, with the principle that competence at a higher level implies a reasonable degree of competence at the lower levels. Instructional designers can use taxonomy concepts to guide the creation of the course content and the performance evaluation. The Component Display Theory proposed by Merrill classifies learning along the dimensions of content and performance. The theory specifies four primary presentation forms: rules, examples, recall and practice. Secondary presentation forms include: prerequisites, objectives, helps, mnemonics, and feedback. The theory specifies that instruction is more effective to the extent that it contains all necessary primary and secondary forms. The theory suggests that for a given objective and a set of learners, there is a unique combination of presentation forms that results in the most effective learning experience. Section 3.1.1 deals with a discussion of the scoring rubric, followed by an analysis of the consolidated performance levels for the pre-test and post-tests using these scales. Section 3.1.2 is devoted to analyzing the quality of the assessment paper itself. 3.1.1: The Scoring Rubric and the Consolidated Pre and Post Performance. Scoring rubrics are typically employed when a judgment of quality is required and may be used to evaluate a broad range of subjects and activities (Moskal 2000). By developing a pre-defined scheme for the evaluation process, the subjectivity involved in evaluating an assignment becomes more objective. The first step in developing a scoring rubric is to clearly identify the qualities that need to be displayed in a student's work to demonstrate proficient performance. The identified qualities will form the top level or levels of scoring criteria for the scoring rubric. After defining the criteria for the top level of performance, the evaluator's attention may be turned to defining the criteria for lowest level of performance. It is better to have a few meaningful score categories then to have many score categories that are difficult or impossible to distinguish (Brookhart 1999). The questions in the assessment tests, designed to assess the DataBase Design skill set, were evaluated on a scale of 0 to 4 with the associated meaning as shown below. The following rubric was used as the students could easily identify with the scales and which would subsequently help them in the peer reviews. 0 - Doesn’t know anything (most answers were guessed); 1 - Knows something but is very confused (cannot justify the answers properly); 2 - Knows something but some confusion still exists (answers may not be optimal, but can reason out the answer); 3 - Sufficient amount of knowledge (clear understanding with minimal errors; can analyze and identify optimal solutions) 4 – High Level of Knowledge and optimal solutions (can generate and evaluate multiple alternative and correct solutions). The Question Paper itself was organized as follows: Questions Q1, Q2, Q3 and Q4 were at the Level of Knowledge and Comprehension; Question Q5 was an Application Level Question; Questions Q7 and Q9 were targeted at the Analysis and Application Levels; Questions Q6 had both an Analysis and Synthesis orientation; Question Q8 was a question that involved the highest skill set on Evaluation. Each of the above questions had subsections within them. The result of the group activity conducted above was evaluated through Q7 and its impact can be seen from the Bar Charts shown in Figure1 and Figure2. The Bar Chart in Figure1 displays the total number of students who have scored various scale points at the different Question Levels at the Pre-Test; The bar 29
  • 6. Journal of Education and Practice www.iiste.org ISSN 2222-1735 (Paper) ISSN 2222-288X (Online) Vol 3, No 3, 2012 chart of Figure2 displays the same parameters but at the Post-Test. Consol_Pre_Test Consol_Post_Test 20 20 18 18 16 16 14 14 No of students No of S tudents 12 12 10 10 8 8 6 6 4 4 2 2 0 0 Q2(L1/L Q3(L1/L Q2(L1/ Q3(L1/ Q1(L1) Q4(L2) Q5(L2) Q7(L3) Q9(L4) Q6(L4) Q8(L5) Q1(L1) Q4(L2) Q5(L2) Q7(L3) Q9(L4) Q6(L4) Q8(L5) 2) 2) L2) L2) Pre 0 4 5 17 18 12 0 5 11 9 Post 0 3 0 3 6 0 0 3 2 4 Pre 1 8 8 5 7 2 2 5 2 12 Post 1 8 5 5 6 6 7 3 8 5 Pre 2 10 9 5 1 7 19 7 11 5 Post 2 2 4 0 0 5 6 6 3 1 Pre 3 3 1 3 10 3 0 0 0 5 Post 3 7 11 8 3 7 20 13 15 6 Figure1: Bar 4 3 showing 0consolidation of 0PreTest Scores 0 Figure2: Bar 4chart showing consolidation2of PostTest Scores Pre chart 1 1 1 9 0 Post 5 12 10 2 11 8 4 7 An initial comparison of the graphs (Figure1 and Figure2) reveals the following points which are relevant and important to this study: (i)The amount of learning at the Comprehension level Questions Q2 and Q3 went up by a substantial amount. This is an expected observation after a series of formal lecture sessions (ii)Question 7, which was the question that evaluated the concepts after the group activity, had a maximum amount of learning in all respects. The pre-test (Figure1) shows that 2 students had a scale of 1 and 19 students had a scale of 2 and no student had achieved the higher scales of 3 and 4; the rest not having attempted the question. The Post-Test (Figure2) reveals that 7 students obtained a score of 1, 6 students obtained a score of 2, 20 students achieved a score of 3, and 2 students achieved the highest score of 4. What is also important to note is that a maximum number of students had the required jump in the performance grade from 2 to 3 (from a “level of confusion” to a “level of sufficient amount of knowledge”). 3.1.2: Analyzing the Question Paper: To validate the quality of the assessment done, it is important to check the quality of the question paper itself (Rudner & Schaffer). One of the useful indicators is the discrimination power (DP) of the tests’ items (Matlock-Hetzel, 1997). Discrimination describes the ability to distinguish between more and less knowledgeable students and contributes to the spread of scores of the examination. Easy questions are usually poor discriminators while the questions that assess the higher order knowledge levels are better discriminators. The study revealed that the class conformed to the recommended pattern of learning and followed the Gaussian distribution for their grades. This check was necessary as most of the underlying statistical functions assume a normal distribution. The study, with a small sample size of 30, draws on the relational research methodology by using various statistical functions to reach a specific conclusion thereby establishing the empirical validity of the results. Statistical methods were chosen for the analysis of the data as they are characterized by the ability to handle clean data sets which are small in size. Standard deviation, being a mathematical formula measuring the average distance from the average, was chosen as the measure for verifying the discriminating power of the questions. Question Q8, which tested the highest level learning skill set, had the best discriminatory power. This was seen from the fact that the StdDev for Q8 was the highest. An important observation relevant to this study is the StdDev for Question 7 - which is the lowest. This also 30
  • 7. Journal of Education and Practice www.iiste.org ISSN 2222-1735 (Paper) ISSN 2222-288X (Online) Vol 3, No 3, 2012 substantiates the hypothesis that the kind of group activity performed helped to bring all learners to a similar standard (which is a substantially high grade scale - scale level 3 - as seen from the bar chart in Figure2). 3.2 Analyzing Student Performance Since the data being analyzed covered a period of 3 years, a check was necessary to ensure the results of the study were not affected by the variation in the quality of the teaching and the quality of the students itself. The same faculty has been teaching the course for many years and the methods (instructional delivery and activity) has been standardized for the past three years. Further, students are selected for admission to the MCA degree program based on merit at a common nation wide entrance test that assesses their general aptitude. This test evaluates the candidates’ logical, quantitative, qualitative and Visio-spatial reasoning, high school mathematics, vocabulary, English comprehension and verbal ability. To check that the quality of the students did not influence the study, an analysis of the internal consistency of the general aptitude scores of the students at the entrance test to the program was performed. The validity of the experiment can be verified by ensuring an acceptable standardization of the quality of the students. The Cronbach’s test (Cronbach 1951; Bland & Altman 1997) was chosen over Kuder Richardson (KR) Formula as the test scores were scalar data and not dichotomous in nature. This test is used to measures the internal consistency or reliability in psychometric test scores for a sample of examinees. The formula to compute the Cronbach’s alpha coefficient takes into account the number of components, the average variance for the current sample of persons, and the average of all co variances between the components across the samples. The higher the alpha value returned by the test, the more reliable is the test. The general acceptable alpha value is above 0.7 (Nunnalli 1978; Gliem J. & Gleim R. 2003; Kromrey et al 2008). After subjecting the entrance test scores to Cronbach’s test, an alpha value of 0.95 was obtained, ensuring the internal consistency of the data and the validity of the entrance test. The next step is to ensure that there was not much variation in the quality of the students across the three years. To measure the diversity across the data samples, the standard quantitative statistical measures for dispersion could not be used. What was needed was a test that measures qualitative variance that satisfies the requirements of a categorical scale (Wilcox 1973; Kader & Perry 2007). The index of qualitative variation (IQV) is a measure of variability with an index value that ranges from 0 to 1. When the cases in the distribution are distributed evenly across the categories, there is a maximum diversity and IQV is 1.00 (Frankfort-Nachmias & Leon-Guerrero 2009). Gibbs & Poston’s (1975) formula for IQV was used to measure the statistical dispersion in the samples. This formula takes into consideration the number of categories and the proportion of observations that fall in a given category before applying a standardization factor. The entrance test scores were categorized and the IQV for the 3 years was calculated and the values are as shown in Table1. The data analysis reveals a high level of diversity of the data in each of the sample Year IQV cases and a negligible amount of variation across the three years. Year1 0.874 This indicates standardization in the quality of the students which would thus not bias the results of the experiment taking place over Year2 0.856 the three years. Year3 0.867 Table 1: Index of Qualitative Variance for the three years 3.2.1 Comparing the Groups, Group Performances and Individual Learning Levels The Correlation coefficient can be used as a measure of the strength and degree of the relationship between two variables. Correlational evidence can tentatively inform evidence based practice when quasi - experimental, relational research or descriptive studies are used (Thompson et al 2005; Centre for Public Education (CPE)). Although Correlation cannot be used to infer a causal relationship between the variables, it may be an indicator of a causal relationship (Somekh & Lewin 2005; Statsoft 2010). This statistical 31
  • 8. Journal of Education and Practice www.iiste.org ISSN 2222-1735 (Paper) ISSN 2222-288X (Online) Vol 3, No 3, 2012 measure will be used to answer the research question posed earlier. To verify if a consistent and sustained amount of individual learning took place in the competency involving the group activity (referred to as C1) was actually more in the year the groups were homogenous, the students were once again evaluated at the traditional assessments conducted at an examination at the end of the year. The performance scales at this evaluation range from a grade level of 4 (lowest) to 10 (highest). A score below a grade scale of 4 implies a “failure” in the course. The correlation between the individual grades obtained at the end-semester examination that assessed this concept, and grades obtained in an assessment that evaluated the group performance was found. The relevant statistical evidence is shown in Table2. Year G N G G G I I I CoRel Type Mode AvDev Var Mode AvDev Var Year1 Hetero 30 8 1.348 2.815 7 1.210 2.177 0.267 Year2 Hetero 30 7 1.115 1.970 7 1.308 2.650 0.234 Year3 Homog 30 9 0.825 0.936 9 0.744 0.751 0.310 Table 2: Statistics for Group and Individual Score Performances (G and I in Table2 represent “Group” and “Individual”, respectively. N represents the number of students) Year1 and Year2, which had a heterogeneous group environment, shows a weak positive correlation between the group grades and the individual grades; whereas the results for the Year3 which had groups that was homogenous in nature, display a stronger – though moderate – correlation between the group grades and the individual grades. Table2 also reveals the following pertinent findings for the Year3: • The Average Deviation for the Homogeneous Groups and for the Individual Performances is the least. • (ii)The Mode of the scores, both Group and Individual, is the highest for that year. • (iii)The Variance in the scores is the least for the Individual scores when the learners formed a part of a Homogenous Group. We need to further verify if the result achieved from the analysis of the data from the sample is a ‘real’ result or a result of ‘chance’. In order to determine the level of statistical significance, a function is needed that represents the relationship between "magnitude" and "significance" of relations between the two variables, depending on the sample size. In other words, that function would give the significance (p) level, and would be informative of the probability of error involved in rejecting the idea that the relation in question does not exist in the population (Statsoft 2010). Since educational research falls within the discipline of the social sciences, an alpha level of 0.05 is an acceptable value (Fisher 1922; Stallings 1985), although it still has a 5% probability of error. Specifically, since the significance depends mostly on the sample size, the larger the sample, the smaller the difference Year Group Type p-values needed to reach statistical significance (Somekh & Lewin Year1 Heterogeneous 0.08 2005). The significance test (p-values) returned for the above Year2 Heterogeneous 0.115 sample data is shown in Table3. Year3 Homogenous 0.05 Table3: p-values for sample data Rephrasing the research question stated at the onset of the study as: H0: There is no significant amount of individual learning in the case when the learning groups are Homogenous in nature. 32
  • 9. Journal of Education and Practice www.iiste.org ISSN 2222-1735 (Paper) ISSN 2222-288X (Online) Vol 3, No 3, 2012 H1: There is a significant amount of individual learning when the Homogenous learning groups are formed. H0 can be rejected as the statistical significance (p-value) of the result is <= 0.05 (the acceptable alpha) in the Year3, when the group formations were homogenous. The study provides evidence to the fact that the improvement in the individual learners’ performance did not occur by chance alone but was the result of the instructional intervention. This conclusion will be reinforced by the descriptive study that follows in the next section. 3.2.2: Analyzing the Retention Levels of the Individuals in the different Groups Unlike the Post-test assessments which were conducted soon after the completion of the module, the assessments done at the end-semester examination evaluates all the modules completed in the course. The retention power of the individual can thus be observed for this activity based module vis-à-vis the other modules. The following Table4 shows some interesting statistics of the performance levels of the individual learner in all the modules conducted at the end semester examination vis-à-vis the competency module comprising the group activity. The examination at the end of the semester is a traditional assessment comprising questions from all the course modules and did not vary across the three years. Year Group Type Average Average Mode Mode AvgDev AvgDev Overall C1 Overall C1 Overall C1 Grade Grade Grade Grade Grade Grade Year1 Hetero 6.517 6.034 7 7 1.220 1.210 Year2 Hetero 6.069 7.310 8 7 1.731 1.308 Year3 Homog 6.724 8.414 7 9 1.339 0.744 Table 4: Interesting Statistics of Class Performance for the three Years (C1 represents the competency module) When there is a relatively small sample size, analyzing the individual elements of the data itself may throw a better light on the study. Table 4 together with Figures 3, 4 and 5 reveal some interesting statistics for the homogenous group environment in the third year emphasizing the fact that the homogenous group is an effective learning pedagogical strategy. Year3_Homog_Group_Anal Overall_Course_Perf C1_Indiv 10 Grade point 9 8 7 6 5 4 3 2 1 0 1 2 3 4 5 6 7 8 9 10 11 12 13 14 15 16 17 18 19 20 21 22 23 24 25 26 27 28 29 6 9 6 7 7 9 8 5 6 6 9 5 4 4 5 7 8 5 5 9 7 8 7 7 8 6 7 10 5 7 10 9 8 9 9 8 8 9 7 10 7 9 Student 8 7 8 8 8 8 9 7 9 9 8 9 9 9 9 9 Figure 3: Graph of Individual (Overall Course and C1) Scores for Year3 The following analysis can be done for Year3: • With the exception of a single individual, every learner had the C1 score grade higher than the 33
  • 10. Journal of Education and Practice www.iiste.org ISSN 2222-1735 (Paper) ISSN 2222-288X (Online) Vol 3, No 3, 2012 overall course score. • The Average Score for the C1 is significantly higher than the overall course average score. • The Average Deviation for the C1 score is significantly lower than the average deviation for the overall course score. • The Mode for the C1 score is two grade scales higher than the mode for overall course score For the Year2, the graph in Figure 4 below, shows that 20% of the learners had obtained a C1 grade lower than their overall course scores. Further, the Mode for the C1 score is a grade lower than the mode for overall course score. Figure 5 shows that 48% of the learners had obtained a C1 score grade lower than their overall course scores. From the above data, it is clearly discernable that the mode and the average for the C1 grades at the end- semester examination in the Year3 were significantly higher than the same for the previous years. Further, 34
  • 11. Journal of Education and Practice www.iiste.org ISSN 2222-1735 (Paper) ISSN 2222-288X (Online) Vol 3, No 3, 2012 the Individual Average Deviation for the C1 is the least for that year. Another important observation is that the individual C1 grades for a significantly large number of students in the earlier years (Year1 and 2) were lower than their individual overall grade - indicating that many of the students piggybacked on the grades of their team members when in heterogeneous groups; and their C1 concepts needed a comparable improvement. This data analysis is in agreement with the hypothesis H1 formulated in this study. 5. Conclusion The general perception has been that heterogeneous groups are necessary for effective Collaborative Learning with the essence being the achievement of the group, and not necessarily the impact on individual learning. The results of this study reveal that, when the focus is on individual learning, heterogeneity in group formation is not a necessary condition. Although tentative, this study suggests that ‘homogeneity’ can not only improve the individual’s learning ability, but also their levels of confidence. The lower achievers tend to work harder to arrive at their peer standards and cannot “piggy-back” on the higher achievers. The retention span also remains significantly longer for all learners in this learner centric activity. Not only can group homogeneity/heterogeneity with respect to performance and academic intelligence be considered during the formation of a group, but also individual learning styles/skills for a more productive learning environment. The final aim would be to maximize the possibility of student success in an enjoyable learning environment. References Barker, L.J., Garvin-Doxas, K. & Jackson, M.H.(2002), “Defensive climate in the computer science rd classroom”, Proceedings of the 33 SIGSCE Technical Symposium on Computer Science Education 34(1), 43–47. Doi 10.1145/563340.563354 Barker L.J.(2005), “When do group projects widen the student experience gap?”, Proceedings of the 10th Annual SIGCSE Conference on Innovation and Technology in Computer Science Education (ITiCSE’05), 37(3), 276– 280. Doi 10.1145/1067445.1067521 Bell, T., Urhahne, D., Schanze, S. & Ploetzner, R.(2009), “Collaborative Inquiry Learning: models, tools and challenges”, Research Report, International Journal of Science Education, 32(3), 349-377 Biggers, M., Tuba, Y. & Sweat, M.(2009), “Using Collaborative, Modified Peer Led Team Learning to improve student success and retention in intro CS”, Proceedings of the 40th SIGSCE Technical Symposium on Computer Science Education, 41(1),9-13 Doi 10.1145/1508865.1508872 Bland, J.M. & Altman D.G.(1997), “Statistics notes: Cronbach's alpha”, British Medical Journal, Feb 1997, 314:572 Bloom, B.S., Hastings, J.T. & Madaus, G.F.(1971), Taxonomy of Educational Objectives: The Classification of Educational Goals, Handbook 1, Cognitive Domain. New York, McCay. Bower, M. & Richards, D.(2006), “Collaborative learning: Some possibilities and limitations for students and teachers”, Proceedings of the Conference for the Australasian Society for Computers in Learning in Tertiary Education (ASCILITE’06), ACM Transactions on Computing Education ,9(1), 79-89. Bradshaw, S.D. & Stasson M.F.(1995), “Explanations of individual-group performance differences: What sort of “bonus” can be gained through group interaction?”, Small Group Research, 26(2), 296–308. Brookhart, S. M.(1999), The Art and Science of Classroom Assessment: The Missing Part of Pedagogy. ASHE- ERIC Higher Education Report, 27(1). Washington, DC: The George Washington University, Graduate School of Education and Human Development Burrill, G. C. (1976), “Competency based curriculum design: An experimental model for social service workers”, Innovative Higher Education, 1(2), 132-138, Doi. 10.1007/BF01079492 nd Cohen, E.G. (1994), Designing Groupwork Strategeies for the Heterogeneous Classroom, (2 Ed.), New York: Teachers College Press. 35
  • 12. Journal of Education and Practice www.iiste.org ISSN 2222-1735 (Paper) ISSN 2222-288X (Online) Vol 3, No 3, 2012 th Cragan, J. F., Kasch, C. R. & Wright, D.W.(2009), Communication in small groups: Theory, process, skills (7 Ed.). Lyn Uhl, Wadsworth Cengage Learning. Cronbach, L. J.(1951), “Coefficient alpha and the internal structure of tests”, Psychometrika, 16(3), 297-334 Fisher, R.A.(1921), “On the “probable error” of a coefficient of correlation deduced from a small sample”, Metron, 1 3-32. http://hdl.handle.net/2440/15169 Frankfort-Nachmias, C. & Leon-Guerrero A.(2009), Social Statistics for a Diverse Society, Sage publications, Chapter 5. Fretwell, D. H., Lewis, M.V. & Deij A. A.(2001),World Bank, “A Framework for defining and assessing occupational and training standards in developing countries”. Gardner, H.(2004), Changing Minds: The art and science of changing our own and other people's minds. Boston: Harvard Business School Press. Gibbs, J.P. & Poston, D.L. Jr.(1975), “The Division of Labor: Conceptualization and Related Measures”, Social Forces 53 (3): 468–476, Doi 10.2307/2576589 Gliem, J.A. & Gliem, R.R.(2003), “Calculating, Interpreting and Reporting Cronbach’s Alpha Reliability Coefficient for Likert-type Scales”, Proceedings of The Midwest Research to Practice Conference in Adult, Continuing, and Community Education, Ohio Hansen, K.M. & Ratzer, A.V.(2002), “Tool support for collaborative teaching and learning of object- oriented Modeling”, ACM SIGCSE Bulletin, 34(3), 146–150. Hill, G.W.(1982), “Group versus individual performance: Are N = 1 heads better than one?” Psychological Bulletin, 91(3), 517–539. Hoffman, J.(2002),”Flexible Grouping Strategies in the Multiage Classroom”, Theory into Practice,41(1), Promoting Thinking through Peer Learning (Winter 2002),47-52. Johnson, D.W. & Johnson, R.T.(2004), Assessing students in groups: promoting group responsibility and individual accountability, Thousand Oaks, Ca: Corwin Press. Kader, G.D. & Perry, M.(2007), “Variability for Categorical Variables”, Journal of Statistics Education, 15(2) www.amstat.org/publications/jse/v15n2/kader.html Kromrey, J.D., Romano, J. & Hibbard, S.(2008), “Alpha_CI: A SAS@ macro for Computing Confidence Intervals for Coefficient alpha”, SAS Global Forum, Paper 230-2008. Lejk, E.(2008), Management of cultural diversity in group assessment for learning, Centre for Excellence in Teaching & Learning Assessment for Learning, CETL AfL, Univ of Northumbria., northumbria.ac.uk/static/5007/cetlpdf/emmaleyk. (Nov 24,2008) Martin, E. & Paredes, P. (2004), “Using learning styles for dynamic group formation in adaptive collaborative hypermedia systems”, Proceedings of the First International Workshop on Adaptive Hypermedia and Collaborative Web-based Systems, AHCW, 188-198 www.ii.uam.es/~rcarro/AHCW04/MartinParedes.pdf. Matlock-Hetzel, S.(1997), “Basic Concepts in item and test analysis”, Annual Meeting of the SouthWest Educational Research Association, Austin, 1997, San Antonio. ED406441, www.eric.ed.gov, (Aug 2005). McConnell, J. J.(2006), “Active and cooperative learning: further tips and tricks (part 3)”, SIGCSE Bulletin 38(2), 24–28. McDaniel, E., Roth, B. & Miller M.(2005), National Defense University, Washington, DC, USA, “Concept Mapping as a Tool for Curriculum Design”, Issues in Informing Science and Information Technology, 2, 505-512. http://www.informingscience.org/proceedings/InSITE2005/I42f49McDa.pdf McWhaw, K., Schnackerberg, H., Sclater, J. & Abrami, P.C.(2003), “From Cooperation to Collaboration: Helping students become collaborative learners”, R.M. Gilles(Ed), Co-operative Learning: The Social and intellectual outcomes of learning in groups. London: Routledge Falmer. Mentz, E.,Van Der Walt, J.L. & Goosen L.(2008), “The effect of incorporating cooperative learning 36
  • 13. Journal of Education and Practice www.iiste.org ISSN 2222-1735 (Paper) ISSN 2222-288X (Online) Vol 3, No 3, 2012 principles in pair programming for student teachers”, Computer Science Education,18(4), 247-260. Moskal, B. M.(2000),”Scoring rubrics: what, when and how?”, Practical Assessment, Research & Evaluation, 7(3). http://PAREonline.net/ Muehlenbrock, M.(2006), “Learning group formation based on learner profile and context”,. International. Journal on e-learning IJEL 5(1), 19–26. Nicolay, J. A.(2002), “Group assessment in the online learning environment”, New Directives in Teaching and Learning , 91(Fall), 43–53. Doi 10.1002/tl.65 Nijstad, B.A. &, De Dreu C.(2002), “Creativity and Group innovation”, Applied Psychology 51(3) , 400-406. Nunnalli, J. C.(1978), Psychometric theory (2nd ed.). New York: McGraw-Hill Palincsar, A.S & Herrenkohl, L.R.(1999), “Designing Collaborative Contexts: Lessons from three research programs”, In A.M. O’donnell & A.King (Eds), Cognitive Perspectives on Peer Learning, 151-178. Mahwah,NJ:Erlbaum. Pinto, Y.(2008), “A Framework for Competency Based Curriculum Design for IT Courses”, Proceedings of the International Conference on Education, Research and Innovation, IATED, Nov 2008, Spain, ISBN: 978-84-612- 5091-2, 107-124 Richards, D.(2009),”Designing project-based courses with a focus on group formation and Assessment”, ACM Transactions on Computer Education, 9(1), Article 2. Doi 10.1145/1513593.1513595. Rudner, L.M. & Schafer, W.D., What Teachers Need to Know about Assessment, Published by the National Education Association Rutherford, R.H.(2001), “Using personality inventories to help form teams for software engineering class th projects”, Proceedings of the 6 Annual Conference on Innovation and Technology in Computer Science Education, SIGCSE Bulletin 33(3).73-77 Schroth, G., Pankake, A. & Gates, G.(1999), “A Comparison of Pedagogical Approaches to Teaching Graduate Students in Educational Administration”, Journal of Instructional Psychology, Dec 1999. Shaw, M.E(1976), Group dynamics: The psychology of small group behavior (3rd Ed.). New York: McGraw-Hill. Somekh, B. & Lewin, C (2005). Research Methods in Social Sciences, Sage Publications. Stallings, W.M.(1985), “Mind Your p’s and Alphas”, Educational Researcher, 14(9) 19-20, American Educational Research association, http://www.jstor.org/stable/1174554 Thompson, B., Diamond, K.E., McWilliam, R., Snyder, P. & Snyder, S. (2005), “Evaluating the Quality of Evidence from Correlational Research for Evidence-based practice”, Exceptional Children, 71(2) (Winter issue), Ms #076-70-r. Waite, W.M., Jackson, M.H., Diwan, A. & Leonardi, P.M.(2004), “Student culture versus group work in th Computer Science”, Proceedings of the 35 SIGCSE Technical Symposium on Computer Science Education, ACM SIGSCE Bulletin 36(1), 12-16 Webb, N.M., Nemer, K.M., Chizhik, A.W. & Sugrue, B. (1998), “Equity issues in collaborative group assessment: Group composition and performance”, American Educational Research Journal, 35(4), 607–665. Wilcox, A.R.(1973), “Indices of Qualitative variation and Political Measurement”, The Western Political Quarterly, 26(2), 325-34. Winn, W.(2002), “Current Trends in Educational Technology Research: The Study of Learning Environments”, Educational Psychology Review, 14(3), 331-35 Zendler, A., Spannagel, C. & Klaudt, D.(2008), “Process as content in computer science education: empirical determination of central processes”, Computer Science Education, 18(4), 231-245. StatSoft, Inc. (2010). Electronic Statistics Textbook. Tulsa, OK: StatSoft. WEB: http://www.statsoft.com/textbook 37
  • 14. Journal of Education and Practice www.iiste.org ISSN 2222-1735 (Paper) ISSN 2222-288X (Online) Vol 3, No 3, 2012 Consumer’s guide to Education Research, Center for Public Education, http://www.centerforpubliceducation.org. Centre for the study of higher education, Assessing Learning in Australian Universities, Ideas, strategies and resources for quality in student assessment, Assessing group work, http://www.cshe.unimelb.edu.au/assessinglearning 38
  • 15. International Journals Call for Paper The IISTE, a U.S. publisher, is currently hosting the academic journals listed below. The peer review process of the following journals usually takes LESS THAN 14 business days and IISTE usually publishes a qualified article within 30 days. Authors should send their full paper to the following email address. More information can be found in the IISTE website : www.iiste.org Business, Economics, Finance and Management PAPER SUBMISSION EMAIL European Journal of Business and Management EJBM@iiste.org Research Journal of Finance and Accounting RJFA@iiste.org Journal of Economics and Sustainable Development JESD@iiste.org Information and Knowledge Management IKM@iiste.org Developing Country Studies DCS@iiste.org Industrial Engineering Letters IEL@iiste.org Physical Sciences, Mathematics and Chemistry PAPER SUBMISSION EMAIL Journal of Natural Sciences Research JNSR@iiste.org Chemistry and Materials Research CMR@iiste.org Mathematical Theory and Modeling MTM@iiste.org Advances in Physics Theories and Applications APTA@iiste.org Chemical and Process Engineering Research CPER@iiste.org Engineering, Technology and Systems PAPER SUBMISSION EMAIL Computer Engineering and Intelligent Systems CEIS@iiste.org Innovative Systems Design and Engineering ISDE@iiste.org Journal of Energy Technologies and Policy JETP@iiste.org Information and Knowledge Management IKM@iiste.org Control Theory and Informatics CTI@iiste.org Journal of Information Engineering and Applications JIEA@iiste.org Industrial Engineering Letters IEL@iiste.org Network and Complex Systems NCS@iiste.org Environment, Civil, Materials Sciences PAPER SUBMISSION EMAIL Journal of Environment and Earth Science JEES@iiste.org Civil and Environmental Research CER@iiste.org Journal of Natural Sciences Research JNSR@iiste.org Civil and Environmental Research CER@iiste.org Life Science, Food and Medical Sciences PAPER SUBMISSION EMAIL Journal of Natural Sciences Research JNSR@iiste.org Journal of Biology, Agriculture and Healthcare JBAH@iiste.org Food Science and Quality Management FSQM@iiste.org Chemistry and Materials Research CMR@iiste.org Education, and other Social Sciences PAPER SUBMISSION EMAIL Journal of Education and Practice JEP@iiste.org Journal of Law, Policy and Globalization JLPG@iiste.org Global knowledge sharing: New Media and Mass Communication NMMC@iiste.org EBSCO, Index Copernicus, Ulrich's Journal of Energy Technologies and Policy JETP@iiste.org Periodicals Directory, JournalTOCS, PKP Historical Research Letter HRL@iiste.org Open Archives Harvester, Bielefeld Academic Search Engine, Elektronische Public Policy and Administration Research PPAR@iiste.org Zeitschriftenbibliothek EZB, Open J-Gate, International Affairs and Global Strategy IAGS@iiste.org OCLC WorldCat, Universe Digtial Library , Research on Humanities and Social Sciences RHSS@iiste.org NewJour, Google Scholar. Developing Country Studies DCS@iiste.org IISTE is member of CrossRef. All journals Arts and Design Studies ADS@iiste.org have high IC Impact Factor Values (ICV).