Following a catastrophic event, a detailed damage and loss assessment is conducted within 2 weeks to document effects before recovery occurs. Remote sensing data like satellite imagery can process flood extent and damage at various resolutions. Post-disaster field surveys complement remote sensing data and disaster maps, providing asset-level details. For historical events over 15 years ago, assessments are scarce with limited information, but tsunami databases provide a good source of data on past significant events. This study assesses utilizing data from old tsunami events by examining intensity scales applied to two historical New Zealand events to exploit database information for hazard assessments.
1. Following a catastrophic event a detailed damage and loss
assessment follows to avoid losing important information as
recovery/cleaning occurs within a short time (i.e. 2 weeks) after
the event. With respect to documenting the direct effects many
data sets of relevance exist :
Remote Sensing products (RS; Satellite or other data such as
drone) at various resolutions. Remote Sensing products (RS;
Satellite or other data such as drone) can be processed to give
precise flood extent and damage.
Other data collections such as those from post-tsunami field
surveys may compliment post-disaster maps and help calibrate
tsunami inundation models.
Layers of information on updated assets may need to be
complimented from post-tsunami field surveys as they contain
specific detailed data with respect to each category of assets.
Remote Sensing technology can provide information for the development of layers
in the production of detailed post-disaster maps. This can be done for
new events but for older events such detail of information is lacking. Post-disaster
assessments for historical events-that occurred more than 15 years ago- are either
scarce or contain limited information. A good source of information with a large
collection of data related to past significant events is tsunami historical databases.
Applying intensities to historical tsunami events
Using the scale by Lekkas et al (2013) we assigned intensities to observations of
tsunamis known to have impacted or been observed in New Zealand in historical
times. We have selected one distant event-Chile 1960- to New Zealand and one
local-March 1947 Gisborne-as examples to test the applicability of the scale to
historical events. For each location impacted by an event, a grade indicating
tsunami intensity was assigned based on descriptive accounts and measured
quantities where available.
The use of intensity scales in exploiting tsunami historical databases
Aggeliki BARBEROPOULOU1,2, Finn SCHEELE3
1 Previously at the Institute of Geodynamics-National Observatory of Athens, Lofos Nymphon, Thisseio, Greece
2 AIR Worldwide, 131 Dartmouth st, Boston MA 02116 abarberopoulou@air-worldwide.com
3 Department of Geological Sciences, University of Canterbury, Private Bag 4800, Christchurch New Zealand, finnscheele@gmail.com
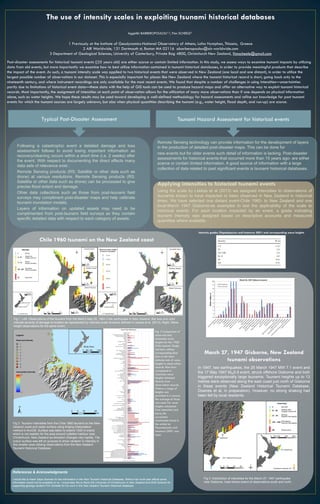
Fig 3. Distribution of intensities for the March 27, 1947 earthquake
near Gisborne. Inset shows extent of observations south and north.
March 27, 1947 Gisborne, New Zealand
tsunami observations
In 1947, two earthquakes, the 25 March 1947 MW 7.1 event and
the 17 May 1947 MW5.9 event, struck offshore Gisborne and both
triggered exceptionally large tsunamis. Tsunami heights up to 13
metres were observed along the east coast just north of Gisborne
in these events (New Zealand Historical Tsunami Database,
Downes et al, in preparation). However, no strong shaking had
been felt by local residents.
References & Acknowledgments
I would like to thank Gaye Downes for the information in the New Tsunami Historical Database. Without her multi-year efforts some
information would not be available to us. I would also like to thank the University of Christchurch in New Zealand and GNS Science for
supporting geology student Finn Scheele for his work in the New Zealand Tsunami Historical Database.
Typical Post-Disaster Assessment Tsunami Hazard Assessment for historical events
Post-disaster assessments for historical tsunami events ([25 years old) are either scarce or contain limited information. In this study, we assess ways to examine tsunami impacts by utilizing
data from old events, but more importantly we examine how to best utilize information contained in tsunami historical databases, in order to provide meaningful products that describe
the impact of the event. As such, a tsunami intensity scale was applied to two historical events that were observed in New Zealand (one local and one distant), in order to utilize the
largest possible number of observations in our dataset. This is especially important for places like New Zealand where the tsunami historical record is short, going back only to the
nineteenth century, and where instrument recordings are only available for the most recent events. We found that despite a number of challenges in using intensities—uncertainties
partly due to limitations of historical event data—these data with the help of GIS tools can be used to produce hazard maps and offer an alternative way to exploit tsunami historical
records. Most importantly, the assignment of intensities at each point of observation allows for the utilization of many more observations than if one depends on physical information
alone, such as water heights. We hope these results may be used toward developing a well-defined methodology for hazard assessments and refine our knowledge for past tsunami
events for which the tsunami sources are largely unknown, but also when physical quantities describing the tsunami (e.g., water height, flood depth, and run-up) are scarce.
Chile 1960 tsunami on the New Zealand coast
Fig.1. Left: Observations of the tsunami from the Mw9.5 May 22, 1960 Chile earthquake in New Zealand. Bar size and color
indicate severity of damage at location as represented by intensity scale divisions defined in Lekkas et al. (2013). Right: Wave
height observations for the same event.
Fig 3. Tsunami Intensities from the Chile 1960 tsunami on the New
Zealand coast and raster surface using Kriging interpolation
method in ArcGIS. Surface was taken to extend 1500 m inland
which is not realistic for the area around Lyttelton harbour near
Christchurch, New Zealand as elevation changes very rapidly. The
colour surface was left on purpose to show variation in intensity in
this smaller area utilising observations from the New Zealand
Tsunami Historical Database.
Fig. 2 Comparison of
observed and
estimated wave
heights for the 1960
Chile tsunami. Single
red bars without
corresponding blue
bars in the chart
indicate lack of wave
heights in observation
records. Blue bars
correspond to
maximum wave
heights obtained
directly from
observation records.
Where a range of
heights was
provided in a record,
the average of those
was used. For wave
heights calculated
from intensities (red
bars), the
correlation
relationship found in
the article by
Papadopoulos and
Imamura (2001 was
used.
Intensity grades (Papadopoulos and Imamura 2001) and corresponding wave heights