Media Optimizer - Digital Advertising Report 2015
•
1 like•2,242 views

Adobe Media Optimizer - Digital Advertising Report 2015

Recommended
Recommended
More Related Content
What's hot
What's hot (20)
Viewers also liked
Viewers also liked (20)
Similar to Media Optimizer - Digital Advertising Report 2015
Similar to Media Optimizer - Digital Advertising Report 2015 (20)
Recently uploaded
Recently uploaded (20)
Media Optimizer - Digital Advertising Report 2015
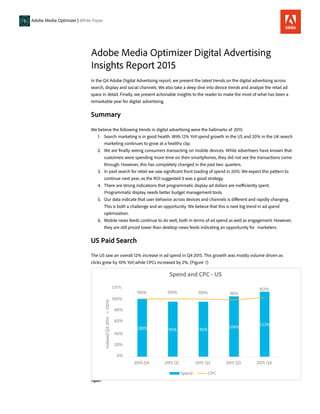
- 1. Adobe Media Optimizer | White Paper Adobe Media Optimizer Digital Advertising Insights Report 2015 In the Q4 Adobe Digital Advertising report, we present the latest trends on the digital advertising across search, display and social channels. We also take a deep dive into device trends and analyze the retail ad space in detail. Finally, we present actionable insights to the reader to make the most of what has been a remarkable year for digital advertising. Summary We believe the following trends in digital advertising were the hallmarks of 2015: 1. Search marketing is in good health. With 12% YoYspend growth in the US and 20% in the UK search marketing continues to grow at a healthy clip. 2. We are finally seeing consumers transacting on mobile devices. While advertisers have known that customers were spending more time on their smartphones, they did not see the transactions come through. However, this has completely changed in the past two quarters. 3. In paid search for retail we saw significant front loading of spend in 2015. We expect this pattern to continue next year, as the ROI suggested it was a good strategy. 4. There are strong indications that programmatic display ad dollars are inefficiently spent. Programmatic display needs better budget management tools. 5. Our data indicate that user behavior across devices and channels is different and rapidly changing. This is both a challenge and an opportunity. We believe that this is next big trend in ad spend optimization. 6. Mobile news feeds continue to do well, both in terms of ad spend as well as engagement. However, they are still priced lower than desktop news feeds indicating an opportunity for marketers. US Paid Search The US saw an overall 12% increase in ad spend in Q4 2015. This growth was mostly volume driven as clicks grew by 10% YoY,while CPCs increased by 2%. (Figure 1) Figure 1 Spend and CPC - US 100% 80% 60% 100% 95% 95% 104% 112% 40% 20% 0% 2014 Q4 2015 Q1 2015 Q2 2015 Q3 2015 Q4 Spend CPC IndexedQ42014=100%
- 2. 2 US Search Engine Breakdown Google consolidated its position in the US search market with a 79% market share by spend in Q4 2015. This is up by 4.5% from a year before. We note that the Yahoo Gemini program that start in mid-2015, now accounts for 1% of the market by spend. (Figure 2) Figure 2 CPC Trends Google CPCs rose 7% YoYwhile Bing CPCs dropped by 10% (Figure 3). We attribute this to the growth of mobile traffic where Google has a lead. Owing to its higher Revenue per Click (RPC), advertisers spent more on the platform raising both its market share and its CPCs. Figure 3 Search Engine CPC - US Search Engine Market Share by Spend - US 100% 90% 80% 70% 60% 50% 40% 30% 20% 10% 0% 2014 Q4 2015 Q1 2015 Q2 2015 Q3 2015 Q4 Google Bing Yahoo Gemini SpendShare
- 3. 3 Mobile Breakdown Mobile devices (Smartphones + tablets) now account for 32% of all US paid search spend. With this shift, spend in smartphones accelerated in Q4 2015. Figure 4 We believe that smartphones have reached an inflection point as consumers are finally using them to directly transact rather than surf and research. While RPCs for all devices increased YoY, they increase substantially by 48% for smartphones. Similarly, ROI for tablets and desktops remained flat YoYbut increased by 31% for smartphones. Advertisers recognised this trend of an increase in smartphone transactions, therefore, they bid more agressively. As a result the CPC rose by 9% YoY.(Figure 5) Figure 5 CPC, RPC and ROI by Device - US Spend Share by Device - US 100% 90% 80% 70% 60% 50% 40% 30% 20% 10% 0% 12% 14% 12% 13% 12% 2014 Q4 2015 Q1 2015 Q2 2015 Q3 2015 Q4 Computer s Tablets Smartphones SpendShare
- 4. 4 Retail Spend Share of Q4 2015 - US 45% 40% 35% 30% 25% 20% 15% 10% 5% 0% Special Report: US Retail Q4 2015 While search engine spend for retail grew at a healthy 12% YoY,we noticed a significant shift in how the ad dollars were spent in the retail season. While ad spending has typically been back loaded with the bulk of ad spend in December, we saw the bulk of the ad spend in Nov in 2015. We call this the “priming effect” (Figure 6). The earlier ad spend primed customers to purchase earlier in the season and as a result all key consumer related metrics saw a similar earlier spike (Figure 7). Oct Nov 2014 Dec Oct Nov 2015 Dec Figure 6 Figure 7 Q4 2015 Retail CPC, RPC and ROI - US 140% 120% 100% 80% 60% 40% 20% 0% Oct Nov Dec Oct Nov Dec Oct Nov Dec CPC RPC ROI IndexedOct2015SpendShareofQ42015
- 5. 5 PLA Performance PLA click share in retail increased between 2014 and 2015 from 20% to 26% (Figure 8). PLAs now account for more than 1 in 4 clicks in retail paid search in US. Figure 8 Further, the acceleration was enabled by its adoption on smartphones both by advertisers and consumers. While smartphones represented only 7% of PLA spend in Q4 2015, they represented 24% of PLA spend in Q4 2015, a 340% increase (Figure 9). Further, consumers responded to these ads too, as revenue share of smart- phones for PLAs increased from 4% in to 17% in 2015. Figure 9 PLA Spend and Click Share - US 35% 30% 25% 15% 10% 5% 2014 Q4 2015 Q1 2015 Q2 2015 Q3 2015 Q4 Spend Share Click Share PLA Spend and Revenue Share by Smartphones - US 25% 14% 10% 2014 Q4 2% 2015 Q1 2015 Q2 2015 Q3 2015 Q4 Spend Share Revenue Share ShareofSearch SmartphoneShareofPLA
- 6. 6 UK Paid Search The UK market saw an overall 20% increase in ad spend in Q4 2015 (Figure 10). This growth was all volume driven as clicks grew by 23% YoY,while CPCs fell by 3%. Figure 10 UK Search Engine Breakdown Bing’s spend share in the UK remained small at 7% (Figure 11). Their CPC was persistently cheaper than that of Google (Figure 12). In terms of RPC the two search engines were comparable but Bing had a higher ROI consistently throughout the year. It shows there is still room for further investment in Bing. Figure 11 Spend and CPC - UK 120% 100% 80% 60% 40% 20% 2014 Q4 2015 Q1 2015 Q2 2015 Q3 2015 Q4 97% 120%111%107%103% Search Engine Market Share by Spend - UK 100% 90% 80% 70% 60% 50% 40% 30% 20% 10% 0% 2014 Q4 2015 Q1 2015 Q2 2015 Q3 2015 Q4 Google Bing SpendShareIndexedQ42015=100%
- 7. 7 Figure 12 Figure 13 Mobile Breakdown Mobile devices (Smartphones + tablets) now account for 53% of all UK paid search spend (Figure 14). This shift in spending more on smartphones accelerated in Q4 2015. We note that click share of smartphones and tablets increasing too. The two combine to represent 60% of click share by device. CPC by Search Engine - UK 140% 120% 114% 116% 108% 100% 97% 100% 91% 77% 80% 80% 76% 80% 60% 40% 20% 0% 2014 Q4 2015 Q1 2015 Q2 2015 Q3 2015 Q4 Google Bing ROI by Search Engine - UK 160% 140% 120% 100% 80% 60% 40% 20% 0% 2014 Q4 2015 Q1 2015 Q2 2015 Q3 2015 Q4 Google IndexedQ42015GoogleROI=100% IndexedQ42014GoogleCPC=100%
- 8. 8 Figure 14 Smartphones now represent the majority of clicks and spend in the UK, another inflection point in their upward trajectory. We also note that while RPC remained better for computers the ROI for smartphones improved and were now similar to tablets (Figure 15). Special Report on Programmatic in the US We found two key trends in display that hint at the trend of things to come. The first was the average CPMs during the retail season. We note that the CPMs in display rose the week before black Friday (Figure 16). In the case of paid search, demand and volume is higher the week of Black Friday. This shows the cross channel nature of search and display at work. Advertisers are aware that display works earlier in the sales funnel and are priming audiences for Black Friday before they advertise heavily on search. In this sense, advertisers in the US are spending their money efficiently. Figure 15 CPC, RPC and ROI by Device - UK Spend Share by Device - UK 100% 90% 80% 70% 60% 50% 40% 30% 20% 10% 0% 28% 2014 Q4 2015 Q1 2015 Q2 2015 Q3 2015 Q4 Computer s Tablets Smartphone s SpendShare
- 9. 9 Figure 16 However, when looking at CPMs by the day of the month, a glaring inefficiency emerges. CPMs tend to be higher at the beginning of the month than the end (Figure 17). This indicates that advertisers are overpaying for impressions at the beginning of the month and exhausting their budgets as the month progresses. Savvy advertisers could optimize for this by back loading their spend towards the end of the month. Daily CPM through Q4 Black Friday Figure 17 DoM
- 10. When looking at hour of day trends by category an interesting pattern (or lack thereof) emerges (Figure 18). The peak traffic differs significantly by category. Advertisers would do well to account for category of the inventory when placing bids on programmatic inventory. Figure 18 Similarly, CPMs by category varied significantly throughout the retail season (Figure 19). For more information www.adobe.com/solutions/ digital-marketing.html Figure 19 Adobe Systems Incorporated 345 Park Avenue San Jose, CA 95110-2704 USA www.adobe.com Adobe and the Adobe logo are either registered trademarks or trademarks of Adobe Systems Incorporated in the United States and/or other countries. All other trademarks are the property of their respective owners. © 2016 Adobe Systems Incorporated. All rights reserved. Printed in the USA. 10 01/16 Hourly CPM variations by category Category CPM by hour Automotive Education Food & Drink Shopping Technology &Computing