1. Professional and Scientific Practice 1:Labs
Department of Biosciences & Chemistry
L4 FLR Formative Assessment
Instructions:
1) Complete your name.
2) Save file as: surname_FLR_form_2019-20.docx e.g. Campbell_S_FLR _form_2019-20.docx
3) Insert your work on the final page so that the feedback forms are at the front.
4) Submit your work to Blackboard submission tool on the Blackboard site and Turnitin as a Word-
compatible file (not a pdf).
Student Name: AdinaGeorgianaDorobantu
Number: 30019475
Learning contract? Insert details if applicable here.
Marker:
Grade:
Strengths:
Areas to improve:
Student comments for feed-forward
how will you use this feedback to improve your future work?:
2. Indicator
First
(High)
First Upper Second
Lower Second Third Fail Fail
Introduction
(Hypothesis
and aims
only)
10%
Exceptional knowledge and
understanding of the subject and
its underlying concepts
Hypothesis is relevant and
clearly stated. Concise and
appropriate aims and objectives
for experiment outlined. All
elements of report introduced in
a correct, clear, concise manner.
No errors.
Excellent knowledge of the subject
beyond what was taught.
Hypothesis is relevant and clearly
stated. Concise and appropriate
aims and objectives for experiment
outlined. All elements of report
introduced in a correct, clear,
concise manner. Very minor errors.
A very good breadth of knowledge
and understanding relating facts
and concepts together. Hypothesis
is relevant and clearly stated.
Concise and appropriate aims and
objectives for experiment outlined.
All elements of report introduced in
a scientifically correct manner.
Minor errors.
A good breadth of knowledge and
understanding. Hypothesis is
stated, but may be unclear. Aims
and objectives stated, but may be
unclear or limited. All areas of the
report introduced, but lack of
understanding shown in some
areas.
Knowledge and understanding is
sufficient to deal with terminology,
basic facts and concepts. Hypothesis
is stated, but may be unclear or
incomplete. Aims and objectives
stated, but may be unclear, limited or
incomplete. Most areas of report
introduced, may show lack of
understanding.
Insufficient knowledge and
understanding of the subject
and its underlying concepts.
Hypothesis absent. Statement
of aims unclear, limited or
incomplete. Introduction
incomplete and contains major
errors in understanding.
Highlyinsufficient or
no evidence of
knowledge or
understanding of the
subject. No statement
of aims or hypothesis.
Introduction missing,
irrelevant or inaccurate
in the most part.
Materials
and Methods
30%
Clear methods, in past
impersonal tense and in
paragraphs. Updates from
modifications from the lab script
given. Correct format and details
of statistical analysis. No errors.
Clear methods, in past impersonal
tense and in paragraphs. Updates
from modifications from the lab
script given. Correct format and
details of statistical analysis. Very
minor errors.
Clear methods, in past impersonal
tense and in paragraphs. Updates
from modifications from the lab
script given. Correct format and
details of statistical analysis. Minor
errors.
Methods provided in past
impersonal tense and in
paragraphs but changes may not
have been incorporated and some
errors in style.
Some information given on
statistics, but may be incomplete or
inaccurate.
Lab script re-worded but may lack full
consistency to style of past tense/
paragraphs. i.e. may use bullet points.
No details of statistical analysis.
Some attempt to re-word lab
script but not in past tense or in
paragraphs.
Bullets from lab script.
Results
40%
Data presentation is exceptional.
Clear well labeled graphs (to
include title, axis titles and
units). Figures with correct
annotations and clear legends
(including figure numbers).
Correct statistics provided. Well
written logical description of
results, to make the data
understandable to the reader.
No errors.
Data presentation excellent. Clearly
labeled graphs (to include title, axis
titles and units). Figures with
correct annotations and clear
legends (including figure numbers).
Correct statistics provided. Well
written logical description of results,
to make the data understandable to
the reader. Very minor errors.
Data presentation is very good.
Clear well labeled graphs (to
include title, axis titles and units).
Figures with correct annotations
and clear legends (including figure
numbers). Correct statistics
provided. Well written logical
description of results, to make the
data understandable to the reader.
Minor errors.
Graphs and tables are good but
may be incorrectly labelled. Limited
written description of result. Figure
legends limited. Statistical analysis
contains errors.
Graphs and tables are sufficient.
Maybe incorrectly labelled, some may
be absent. No written description of
result. Figure legends absent. Data
analysis contains errors
Graphs and tables insufficient.
Incorrectly labelled, some may
be absent. No written description
of result. Figure legends absent.
No data analysis.
Limited results, some
graphs or raw data
given.
Discussion
10%
Discussion shows critical
evaluation of whether the aims
of the experiment were
achieved. Aims of lab or
hypothesis referred to. All key
findings and results
summarised.. No errors.
Discussion goes beyond what has
been taught. Aims of lab or
hypothesis referred to. All key
findings and results summarised.
Full discussion of whether the aims
of the experiment were achieved.
Very minor errors.
Discussion able to relate
facts/concepts together. Aims of lab
or hypothesis referred to. All key
findings and results summarised.
Full discussion of whether the aims
of the experiment were achieved..
Minor errors.
Discussion balanced towards the
descriptive rather than analytical.
Summary of results given but
limited discussion of whether aims
were achieved.
Discussion deals with terminology,
basic facts and concepts. Summary of
some results, limited link to aims or
hypothesis.
Discussion is descriptive.
Summary of some results, no
link to aims or hypothesis.
Inaccurate and irrelevant
content
Formatting,
referencing
and
scientific
presentation
10%
Excellent communication skills
beyond expectation of the level.
Exception use of relevant
scientific language throughout.
No errors present.
Strong communication skills. Clear,
informative title. Report is written
clearly, concisely, in the appropriate
tense and impersonal style.
Excellent use of relevant scientific
language. Very minor error present.
Section content is correct. Very
minor errors.
Very good demonstration of
communication skills. Clear,
informative title. Report is, written
clearly, concisely, in the appropriate
tense and correct use of scientific
language. Minor errors present.
Section content is correct. correct
and thorough.
Good demonstration of
communication skills. Title is basic
and not informative.
May be errors in use of tense and
style. Mistakes in use of scientific
English.
Section content is correct.
Communication/presentation is
generally competent but with some
weaknesses. Title is sufficient and but
not informative. Many errors in use of
tense and style. Mistakes in use of
scientific English may not be
appropriate. Some confusion over
section content.
Title is insufficient. English,
language may not be appropriate
errors in tense and or style.
Much confusion over section
content.
No title. Report not word
processed. English is
generally confused and
inappropriate. Section
content
not adhered to fully. N
3. Class CG% General Characteristics L4
FIRST
96
Exceptional knowledge and understanding of the subject and its underlying concepts; critical evaluation/synthesis/analysis and of
reading/research; evidence of breadth and depth of reading/research to inform development of work; exceptional demonstration of
relevant skills; excellent communication; performance in some, if not all, areas deemed beyond expectation of the level.
89
81 Excellent knowledge of thesubjectasthestudent istypically able togobeyond what hasbeentaught (particularly forahigh 1st
); evidence of
breadth of reading/research to inform development of work; excellent demonstration of relevant skills; demonstrates strong
communication skills.
74
UPPER SECOND
68 As below but very good work characterised by evidence of wider understandingof the subjectas the student is typically able to relate
facts/concepts together with some ability to apply to known/taught contexts; identification and selection of material to informdevelopment
of work; very good demonstration of relevantskills;demonstrates good communication skills.
65
62
LOWER SECOND
58 Agood breadth of knowledge and understanding of thetaughtcontent although balanced towards the descriptive rather than analytical; uses
set material to inform development of work; addresses all aspects ofthe given brief; good demonstration of relevant taught skills,
though may be limited in range; communication shows clarity but structure may lack coherence.
55
52
THIRD
48 Knowledgeandunderstanding issufficient todealwithterminology,basicfactsandconceptsbutfailstomakemeaningful synthesis;relies on set
material to informdevelopment of work; generally addresses mostof the requirements of the given brief; adequate demonstration of
relevant skills over a limited range; communication/presentation is generally competent but with some weaknesses.
45
42
FAIL
35
Insufficient knowledge and understanding of the subject and its underlying concepts; some ability to evaluate given reading/research
however work is more generally descriptive; naively follows or may ignore set material in development of work; given brief may be only
tangentially addressed or may ignore key aspects of the brief; demonstration of relevant skills over areduced range; communication shows
limited clarity, poor presentation, structure may not be coherent.
25
15 Highly insufficientor no evidence of knowledge or understandingof the subject; understanding of taught concepts is typically at the word
levelwithfacts beingreproducedin adisjointed or decontextualised manner; ignores setmaterial in developmentof work;failsto address most
or all of the requirements of the brief;failsto demonstrate relevant skills;lacks basic communication skills.
5
ZERO 0 Work of no merit OR absent, work not submitted, penalty in some misconductcases.
4. Comparing the Biuret method and UV method for protein determination
Report by Adina Georgiana Dorobantu
Experiment conducted by Adina Georgiana Dorobantu
Introduction
The level of protein content in the human body plays an important role in maintaining
homeostasis, allowing for physiological processes to occur in normal conditions and the general state of
health. In this experiment, Bovine serum albumin (BSA) was used, which is a serum albumin protein
derived from cows with many biochemical applications (Bovine Serum Albumins – Albumin, Sigma-
Aldrich, 2020).
This experiment was conducted in order to understand the differences between two important
protein assays, the Biuret method and UV method, and to determine the protein concentration of an
unknown sample X.
The Biuret method is considered to be a reference method for protein determination of biological
fluids, due to its high accuracy and precision, but also because of its simplicity, rapidity and reliability.
The biuret reaction takes place by the addition of copper II ions to peptide protein bonds in an alkaline
solution which forms a blue-violet complex that reflects a proportional relation of concentration by color.
The UV method represents the quantification of ultraviolet absorption by proteins, being greatly
influenced by the presence of certain amino acids such as tryptophan and tyrosine which because of their
chemical structures, strongly absorb light while analyzed in the spectrophotometer. The advantages of the
UV method are its simplicity and the fact that no reagent addition to the protein is necessary for analysis,
which makes the sample recoverable (Noble, 2014).
The aim of this formal lab report is to assess the Biuret method and UV method used, based on 3
different principles. The accuracy of the method showed the closeness of the results produced to the
actual value of the samples. The two methods were also analyzed in order to determine the precision,
which showed which method gave the least variation in replicate measurements. Analyses was also
conducted by assessing the sensitivity of both methods, to determine which method can reliably detect the
smallest amount of protein in a sample.
The hypothesis of this experiment was that the concentration values generated using the Biuret
method were more accurate, precise and sensitive compared to the concentration values obtained using
the UV method.
5. Methods
Prepare standards for standard curve
A 30 g/L stock solution of BSA was prepared. Using the stock solution (30 g/L albumin), a series
of standards of known increasing concentrations were prepared.
Biuret Method for Protein Determination
Biuret reagent (4.5 mL) was added to the series of standards containing 0.5 mL of BSA (30 g/L).
The experiment was carried out in triplicates for sample X, QC samples (2 g/L) and QC samples (25 g/L).
Biuret reagent (4.5 mL) was added to 0.5 mL of sample X triplicates, 0.5 mL of QC triplicates sample (2
g/L) and 0.5 mL of QC triplicates sample (25 g/L). The standards, X, QC (2 g/L) and QC (25 g/L)
samples were left to incubate at room temperature for 10 minutes. Then the absorbance was quantified
using a spectrophotometer at 610 nm.
UV Method for Protein Determination
Distilled water (4.5 mL) was added to the series of standards containing 0.5 mL of BSA (30 g/L).
The experiment was carried out in triplicates for sample X, QC (2 g/L) samples and QC (25 g/L) samples.
Distilled water (4.5 mL) was added to 0.5 mL of sample X triplicates, 0.5 mL of QC (2 g/L) triplicates
and QC (25 g/L) triplicates. Then the absorbance was quantified using a spectrophotometer at 295 nm.
Statistical Analysis
The absorbance and concentration values of the standard dilution series were plotted into a
calibration graph using Excel. The equation for the line and R2 were deducted from the calibration graph
using Excel. Then the equation for the line was used to determine the concentration of the X, QC (2 g/L)
and QC (25 g/L) triplicates samples. Using the concentration values, the mean, standard deviation (SD)
and the co-efficient of variation (CD) were calculated for the X sample, QC (2 g/L) and QC (25 g/L)
triplicates using Excel.
For example, the calculations produced for sample X are done as follows:
y= absorbance of sample X
x= concentration (g/L) of sample X
y= 0.0246*x
Replicate 1 sample X
x= y/0.0246
y= 0.377 A
x= 0.377/0.0246
x= 15.325 g/L
Replicate 2 sample X
x= y/0.0246
y= 0.377 A
x= 0.377/0.0246
x= 15.325 g/L
Replicate 3 sample X
x= y/0.0246
y= 0.383 A
x= 0.383/0.0246
x= 15.569 g/L
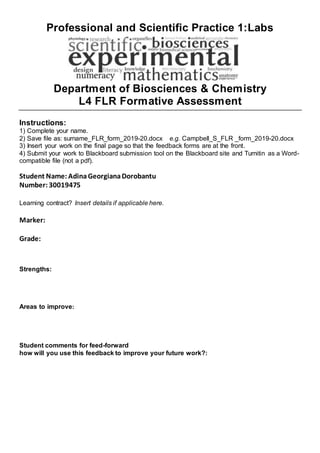
7. Results
Figure 1: Standard curve for BSA using the Biuret method of protein determination. A range of BSA samples
were measured at an absorbance of 610 nm. The graph was generated using Excel and a linear trendline was
added to allow the equation for the line and R² to be generated.
To measure the protein concentration of an unknown BSA sample, a standard curve using known
concentrations of BSA (1-30 g/L) was generated. The standard curve is shown in Figure 1 and indicates that as
the concentration of BSA increases there is a proportional increase in absorbance values, for example the 6 g/L
gave an absorbance value of 0.142 A while the 12 g/L gave a value of 0.298 A.
Figure 2: Standard curve for BSA using the UV method of protein determination. A range of BSA samples
were measured at an absorbance of 295 nm. The graph was generated using Excel and a linear trendline was
added to allow the equation for the line and R² to be generated.
To measure the protein concentration of an unknown BSA sample, a standard curve using known
concentrations of BSA (1-30 g/L) was generated. The standard curve is shown in Figure 2 and indicates that as
the concentration of BSA increases there is a proportional increase in absorbance values, for example the 12 g/L
gave an absorbance value of 0.489 A while the 18 g/L gave a value of 0.566 A.
8. Biuret Methodconcentrationvalues for unknown X, QC (2 g/L) and QC (25 g/L) samples
Concentration (g/L)
1. 2. 3. Mean SD CV
X sample 15.325 15.325 15.569 15.406 0.141 0.914
QC (2 g/L) 1.951 1.951 2.032 1.978 0.047 2.364
QC (25 g/L) 24.308 24.349 24.552 24.403 0.131 0.535
Figure 3: Concentration (g/L), mean, standard deviation (SD) and coefficient of variation (CV) for X, QC (2
g/L) and QC (25 g/L) samples using the Biuret method of protein determination. Three replicates were
produced for each type of sample and measured at an absorbance of 610 nm. The table was produced using
Excel and the mean, SD and CV values were also generated in Excel and included.
The concentration values were generated for each set of samples using the equation for the line deducted
from the BSA standard curve for Biuret method and were registered in a table, shown in Figure 3, which
indicates that replicates of the same sample vary in value and produce different concentrations for each reading.
For example, Replicate 1. of QC (25 g/L) sample gave a concentration value of 24.308 g/L, while Replicate 3.
of the same QC (25 g/L) sample gave a concentration value of 24.552 g/L.
UV Methodconcentrationvalues for unknown X, QC (2 g/L) and QC (25 g/L) samples
Concentration (g/L)
1. 2. 3. Mean SD CV
X sample 16.089 17.637 17.427 17.051 0.830 4.925
QC (2 g/L) 2.152 1.732 1.706 1.863 0.250 13.435
QC (25 g/L) 28.136 28.136 27.742 28.005 0.227 0.812
Figure 4: Concentration (g/L), mean, standard deviation (SD) and coefficient of variation (CV) for X, QC (2
g/L) and QC (25 g/L) samples using the UV method of protein determination. Three replicates were produced
for each type of sample and measured at an absorbance of 295 nm. The table was produced using Excel and the
mean, SD and CV values were also generated in Excel and included.
The concentration (g/L) values were generated for each set of samples using the equation for the line
deducted from the BSA standard curve for UV method and registered in a table, shown in Figure 4, which
indicates that replicates of the same sample vary in value and produce different concentrations for each reading.
For example, Replicate 1. of X sample gave a concentration value of 16.089 g/L, while Replicate 3. of the same
X sample gave a concentration value of 17.427 g/L.
9. Discussion
The concentration of sample X generated by using the Biuret method (15.406 g/L) and the concentration
generated by using the UV method (17.051 g/L) showed that the Biuret method was more accurate than the UV
method, with the value produced being closer to the true concentration of the unknown sample X (15 g/L). The
Biuret method was also more accurate in generating concentrations for QC (2 g/L) samples (1.978 g/L) and QC
(25 g/L) samples (24.308 g/L), compared to concentrations obtained using the UV method for QC (2 g/L)
samples (1.863 g/L) and QC (25 g/L) samples (28.005 g/L).
The variation in concentration values of each set of replicates using the Biuret method was more precise,
than the concentration values obtained using the UV method. For example, Biuret method generated
concentrations of the triplicate set of 15.325 g/L, 15.325 g/L and 15.569 g/L for sample X, which were more
precise to the true concentration, while UV method gave concentrations of 16.089 g/L, 17.637 g/L and 17.427
g/L for sample X, less precise than the true concentration. The Biuret method also showed more precision in
determining the concentrations of QC (2g /L) sample replicates and of QC (25 g/L) sample replicates, compared
to the concentrations obtained using the UV method.
The Biuret method showed a bigger sensitivity when measuring QC (2 g/L) sample concentration, with a
mean value of 1.978 g/L, rather than the UV method for QC (2 g/L) sample concentration, which gave a mean
value of 1.863 g/L, that was less sensitive.
References
Sigma-Aldrich, Bovine Serum Albumins – Albumin (2020), Merck, https://www.sigmaaldrich.com/life-
science/biochemicals/biochemical-products.html?TablePage=103994915, date of access: 3/12/2020 13:40
Noble E. James, Quantification of Protein Concentration Using UV Absorbance and Coomassie Dyes, Methods
in Enzymology (2014) PubMed.gov, DOI: 10.1016/b978-0-12-420070-8.00002-7, date of access:
3/12/2020,15:00