2. CHAPTER 8 • TECHNICAL DATA, FORMULAS AND CHARTS
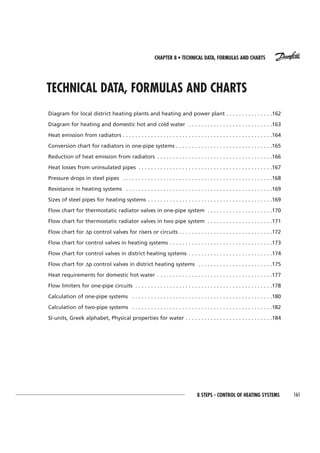
162 8 STEPS - CONTROL OF HEATING SYSTEMS
130 °C
70 °C
130 °C
130 °C
70 °C
70 °C
130 °C
130 °C
70 °C
70 °C
130 °C
130 °C
70 °C
70 °C
Diagram for local district heating plants connected to a heating and power plant.
Heating and
power plant
Local heating plant
Flue gas
cooler
Safety
valve
Exp. tank
Boiler
Safety
valve
Heat exchanger
Accumulator
Heat meter
Flue gas
cooler
Safety
valve
Exp. tank
Boiler
Safety
valve
Heat exchanger
Accumulator
Heat meter
Flue gas
cooler
Safety
valve
Exp. tankBoiler
Safety
valve
Heat exchanger
Accumulator
Heat meter
3. 8 STEPS - CONTROL OF HEATING SYSTEMS
CHAPTER 8 • TECHNICAL DATA, FORMULAS AND CHARTS
163
<6 >6
120-70 °C
90 °C
65 °C
Diagram for heating and domestic hot and cold water.
Expansion tank
∆p - control
Flow meter
Domestic hot water
Domestic cold water
Flowmeter> 6 storeys
Heat meter
Domestic hot water 60
Domestic cold water
Circulation
Control valve< 6 storeys
Storeys
4. 40 30 25 20 16
0
1,0
0,9
0,8
0,7
0,6
0,5
0,4
0,3
0,2
0,1
1,1
1,2
0 1,0 2,0 Q
90
60
70
80
50
0,5 1,5 2,5
1
2
4
5
6
3
164 8 STEPS - CONTROL OF HEATING SYSTEMS
CHAPTER 8 • TECHNICAL DATA, FORMULAS AND CHARTS
Heat emission from radiators.
Two-pipe system with thermostatic
valves.
Measured 1 : tflow 75 oC, ∆t 8 oC
Heat requirement : 0,83, Q = 2,47
tflow 80 oC : 2 ∆t 16 oC, Q = 1,23
Every point along the horizontal line
0,83 gives the same heat emission.
The influence of gravity forces on heat emission from a radiator in a two-
pipe system
For a correctly sized radiator 3 ( with manual radiator valve in a two-pipe
system ) the heat emission will increases only by 5% when the flow
increases by 23%, 4 , depending on gravity forces. The temperature drop
across the radiator however will decrease by 5oC and that is significant,
because it reduces the capacity of the whole system all the way down to
the heating and power plant.
Resuls ∆t for one- and two - pipe circuits, and required pump capacity
when thermostatic valves utilize internal and external heat gains.
Two-pipe circuit One-pipe circuit
Point Heat Flow ∆t Circuit resi- Pump ca- Flow ∆t Pump ca-
gain % % oC stance % pacity % % oC pacity %
3 0 100 25 100 100 100 25 100
5 10 66 33 44 29 100 22,5 100
6 20 47 39 22 10 100 20 100
n = 1,3 troom = 20 oC tflow = 90 oC ∆t = 25 oC
∆t oC
Heat
emission
Q
12
10
8
6
5
4
5. 165
CHAPTER 8 • TECHNICAL DATA, FORMULAS AND CHARTS
8 STEPS - CONTROL OF HEATING SYSTEMS
0,8
0,9
1,0
1,1
1,2
1,3
1,4
1,5
1,6
1,7
1,8
1,9
2,0
2 3 4 5 6 7 8 9 10 11 12 13 14 15 16 17 18 19 20 21 22 23 24 25 26 27 28 29 30
90
85
80
75
70
60 65
2
1
Conversion chart for radiators in one-pipe circuits.
Conversion chart for panel and section radiators in one-pipe circuits.
Enter the current tflow and temperature drop and find the conver-
sion factor, Fc.
Multiply the heat requirement by Fc and select size of the radiator
according to the new value.
Example.
Calculated heat requirement: 1.230 W.
tflow : 82 oC, ∆t: 15 oC, 1
Fc = 1,16 2
Converted heat requirement: 1.230 x 1,16 = 1.427 W.
Formula for calculating Fc:
49,33 x ln
t1 - t2[ ]
t1 - tr n
t2 - tr
( ) n
Panel radiator 1,28
Section radiator 1,29
Convector 1,3 - 1,33
F =
tflow
oC
Fc
∆t oC
6. 166 8 STEPS - CONTROL OF HEATING SYSTEMS
CHAPTER 8 • TECHNICAL DATA, FORMULAS AND CHARTS
a
The control unit has to sense the room temperature to be able to control it.
No enclosure
0%
Shelf with
opening
0%
Shelf close to
the wall
10 -2%
Open fronted
recess with a
shelf
12 -6%
Encased with
grille in front
> -15%
Encased with
small grille in
front. Not
recommended.
> -30%
Acceptable
cabinet.
≈ -8 - 10%
Reduction of heat emission from radiators fixed in some type of enclosure
Radiation from a radiator depending on the treatment of the
surface.
Material Surface treatment Radiation %
Steel, cast iron 100
Oil paint 100
Aluminium or
copper bronzes 75
Zinc white 101
Lead white 99
Enamelled White 101
Matt green 96
Aluminium 8
10 - 100 mm 30 - 100 mm
Alternative
openings a+40
>100mm
7. 167
0
100
200
300
400
0
20 40 60 80 100 120
80/89 65/76
50/6
40
32
25
20
10
15
CHAPTER 8 • TECHNICAL DATA, FORMULAS AND CHARTS
8 STEPS - CONTROL OF HEATING SYSTEMS
Heat losses from uninsulated horizontal pipe.
For vertical pipe reduce by 20%
One-pipe above another reduce by 12%
Three pipes above each other reduce by 20%
Temperature above room temperature oC
Heat emission
W/m pipe DN/0
9. 0,1
0,2
0,3
0,5
1,0
2
3
,01 ,02,03 ,05 0,1 ,2 ,3 ,5 1
1
2
6
4
3
2 3 4 5 107
169
CHAPTER 8 • TECHNICAL DATA, FORMULAS AND CHARTS
8 STEPS - CONTROL OF HEATING SYSTEMS
∆p for ζ values at differnt rates.
Symbol Units Coefficient of resistance, ζ
Branch tee 1
Through tee 1
Elbow, smooth 0,2
Bend 1
The values for the coefficient of resis-
tance for tees, elbows and bends.
The pressure drop is calculated from:
∆p = ζ 0,5 ρ ν2 ,
Recommended portion of pipe losses for different systems or part of
systems.
Type of system Unit Friction %
Heating Small buildings 50 - 60
Large buildings 60 - 70
Sub-stations Primary and secondary side 20 - 30
Distribution pipe net work Primary side 80 - 90
ζ valuem/s
∆p kPa
Sizes of steel pipes for heating systems. Working pressure 1,0 MPa (10 bar)
Nominal diameter External diameter Wall thickness Internal diameter
mm inch mm mm mm
8 1/4 13,50 2,25 9
10 3/8 17,00 2,25 12,5
15 1/2 21,25 2,75 15,75
20 3/4 26,75 2,75 21,25
25 1 33,50 3,25 27,00
32 1 1/4 42,25 3,25 35,75
40 1 1/2 48,00 3,50 41,00
50 2 60,00 3,50 53,00
65 2 1/2 75,50 3,75 68,00
80 3 88,50 4,00 80,50
100 4 114,00 4,00 106,00
125 5 140,00 4,50 131,00
150 6 165,00 4,50 156,00
17. 177
CHAPTER 8 • TECHNICAL DATA, FORMULAS AND CHARTS
8 STEPS - CONTROL OF HEATING SYSTEMS
0
0,5
1,0
1,5
2,0
2,5
0
50
100
150
200
250
300
350
400
1 10 50 100 150 200 250
Heat requirement for hot water according to the Swedish Board of District Heating
Domestic hot water, Q L/s. Effect, P kW
Number of apartments.