SlideShare a Scribd company logo
1 of 16
Confidence IntervalPut values in GREEN cells; output or
answers in YELLOW cellsEnter input in blue cells ; Look for
answers in yellow cellst or z Confidence Interval for
µConfidence Interval for p ProportionsConfidence
Level0.990Enter decimalConfidence Level0.950Enter
decimaln27n329Mean17.3185Number of
Successes141StDev3.4029pop stdevnoEnter yes if population
stdev knownEnter No if population stdev is
unknownSE0.654888Sample
Proportion0.428571t2.779SE0.027283Margin of
Error1.819935z1.960Lower Limit15.498565Margin of
Error0.053475Upper Limit19.138435Lower
Limit0.375096Upper Limit0.482046
sample mean & standard deviatioPut values in blue cells; output
or answers in YELLOW cellsEnter values starting from B5
cellData18.4Mean17.318516.1Sample Standard
Deviation3.402919.516.512.517.213.817.919.19.823.818.719.11
519.21711.515.722.523.719.917.61517.820.714.215.4
Minimum Sample SizeEnter input in blue cells ; Look for
answers in yellow cellsMinimum Sample Size μ for population
meanMinimum Sample Size p for ProportionConfidence
Level0.950Enter decimalConfidence Level0.920Enter
decimalStDev10Sample Proportion0.5If sample proportion
unknown enter 0.5Error3Error0.03Write percentage as
decimalz-Value1.960z-Value1.751Minimum Sample
Size43Minimum Sample Size852
EMPIRICAL RULEEmpirical Rule using standard error for
CONFIDENCE INTERVALANSWEREmpirical Rule68-95-
99.7mean0.43Lower numberUpper number standard
deviation068%0.370.49Standard
error0.0695%0.310.5599.70%0.250.61
Hello, Sylvain. What I wanna do is give you a brief overview
of what you have to do for your week seven Lab. So in the week
seven lab, the only spreadsheet we're going to really need is
your week six spreadsheet. So if you go to Modules and under
week six and got the lesson here shall weeks, Week six
spreadsheet. I've already downloaded it, so it looks like this. So
this is the spreadsheet you should have downloaded for the
lab. So I will download that. Another thing that I would
download is the week seven Lab. So that looks like this. Now
remember these lecture notes are for you to write all over
them. Make any little documentation that you would like to help
you do your lab. Ok. So in the week seven lab, you're, the only
spreadsheet you need is the week six spreadsheet, but you do
need your week five lab data. So go ahead and take a moment to
pull that. That should be the ten heights that your
instructor gave you and then the ten heights that you
gathered. Ok. So to get, I talk about how to get the weeks, six
spreadsheets. So you have that. Now in order to kind of give an
example of what you're going to do in your lab. I want to go
back and look at our data from lab five. Now remember the
scenario for lab five. I'm a principal of a high school. I walk
down the senior map hallway and I picked one class in one class
had ten students in it. And I pooled their midterm exam math
scores. And they're listed here. If you remember from lab from
last week that our mean, I'm just going to write it here. Feel
free to fill in on your sheet. Our mean was a 76.9. Our standard
deviation was 11.3964. And if remember our score that we were
comparing was an 85. So I'm gonna write those down. Okay? So
what I wanna do is I want to find a 95% confidence interval
for the true mean midterm average of all the people in the class
spraying it all. And then even trying to branch out further if we
could to all the people in that or see years or whatever, what
would the population we're trying to represent. So if you open
up your week six spreadsheet, it's asking for competence
level. And so our first one is 95. N is how many pieces of data
we have. We only have ten. Are mean was 76.9, our standard
deviation was 11.396 for population standard deviation, our
answer is no, we don't know, we didn't have a
population. They're asking if this standard deviation is a
population standard deviation or not. And it was not because
we've pulled a sample. Okay. You would only type yes, here if
you've actually pulled an entire population. Okay? And so then
it gives us some great information here in yellow. But the one
thing you're going to take a look at are these the margin of
error, you're lower and your upper limit. So I'm going to take a
screenshot because that's the first thing that's asking for. Take a
screenshot or Dina and you feel free to do the same so that you
have it. And then I'll even, and then you can print these out and
look at them while you're doing it for lab. Let me make it very
small. So it, since he got up into space. Okay. So there's my
95% confidence at all. Now, give a practical interpretation of
what this means. Well, what this means is that I can write, I am
95% confident. I am 95% confident that the true average of the
mass mid-term exam is between 68.785.1 k. I am 95% confident
that the true average, remember we only pull ten people. But if I
were, if I wanted that to represent the entire average of the
midterm exam of everybody who took it. It's between a
68.785.1. I'm 95% sure that the average will be there. So what I
mean by that is I would have to verify I would have to go and
pull the midterm math exam of every single student who took it
in that senior year at that school and average it out. And what
I'm saying is a 95% sure that that average will fall between
60.785.1. A lot of students say, oh, I'm 95% confident that the
average of my sample, now, you know the average of your
sample, the average of your sample with 76.9. So don't, when
you're making a practical interpretation, you're not saying
something about the sample. You're seeing something about the
true mean of the population. If that makes sense. So you're
basing it off of the sample that you have. Okay? Then what
you're gonna do is you're going to do a 99% confidence
interval. So all you have to do is go back to our spreadsheet and
I, and when its height in, in blue, that I'm changing the
confidence level from 0.952.99. So let's change this to
0.99. Then I'm going to take a screenshot in your answers
should match mine right now. We're doing this together for the
midterm math example. Okay? So here's my screenshot. Now
this is for a 99% confidence interval. So what is the practical
interpretation of that? Again, let's write this out. I am 99%
confident that the true average of the midterm exam is between
65.288.6. So 60 by 0.288.6. And I'm getting that from the lower
and the upper limit of my confidence interval. Now, want you to
do is I want you to look at the margin of error. The margin of
error for being 99% confident was 11.7, and the margin of error
for being 95% confident was 8.15. What does that
mean? Explain what that even means. What would the margin
of error be larger or smaller? So in this case, and I want to tell
you the answer for years, but for this case, it would be
larger. And I want you to think about why that is. Look at the
confidence intervals themselves. If you come back up here for
the 95, mm, the 95 was between 68.785.1 and this is
65.288.6. It's kind of hard. You want to see if we can look at
them side-by-side even that would be great. But you should
notice that the interval for the 99% confidence is wider. It's a
wider interval. Why is that? Think about that. Why is it, why is
it bigger? Well, I want you to think about this. If you're 99%
confident, that means that you don't want to be wrong, right? I
mean, you never want to be wrong anytime. But 99% confidence
means that you're, you're, you're pretty sure, like you're
very, very sure that it's going to fall between 65.20.6. That the
more sure. How could you even me washer by opening up the
interval? Does that make sense? So let me demonstrate here,
maybe this will make more sense. Let's say I was like, I am sure
that the average amount of rain I'm going to get is two inches
and six inches of rain, I'm sure but 95%. Well, I don't want you
to be 95%. I want you to be 99%. All of you want me to be that
sure. I'm sure is between 015 Inches of rain. I don't know where
we're living but 0.15. so what I did is I've widened my interval
so that I could have the amount of inches of rain inside of my
interval. You widen it, you include more numbers. Therefore,
that makes you more confident. Okay? So that's what happened
here. So what we did just to recap, we took data from last week,
okay? And we looked at the mean, the score, and the standard
deviation, and we constructed a 9599% confidence interval. We
talked about what they mean in context of the problem. Okay?
We also looked at what happened to the interval itself as we
become more confident and feel free to play around with this a
little bit. What if you're 80% confident? What if you're 90%
confident? So look what happens to your margin as you do
that. Look what happens to the length of your interval when
you change your level of confidence. That's really great to bring
in to your lab. So hopefully that explains what we're gonna do
in your actual lab. So let's look at your actual lab. So what
you're going to be doing is you're going to first, I want you to
read articles about competence intervals. I would really like you
to see how they apply, especially in the health sciences. And
these articles will kind of inspire that thought. Okay? And then
what you're gonna do is you're going to, and I would love the
little summary. I would love a little summary starting off this
lab of what you learned from these articles. Then the next
step, using the data that you collected in week five. Now
remember in week five, you had ten different peoples height
plus the ten that you or your professor gave you. So you should
have 20 numbers. I want you to discuss the Gad Yair method
of collection was its systematic convenience. Cluster, cluster
stratified simple random. What are some false? I know you
highlighted this in week five, but now I want you to talk about
what are some faults with the type of data collection,
okay. What other types of data collections could you used
instead? And how might that affected your survey? So this right
here is the really important part. This is what I am trying to see
what you have learned, okay? So it's about telling me again
what type of method you chose. Telling me what faults come
with that method, some research might be involved. And then
telling me another type of method that you would've liked to try
if you could have and how that would affect your study. Okay.
Then you're going to tell me what the point estimate was, the
point estimates, your mean. So in our case when we're talking
about the midterm, whereas my lecture notes here again, this
right here, maybe I should write this down. The mean, the
76.9, that's your point estimate. This is what we're basing it off
of. Okay? So the point estimate is the mean. Okay? So give a
point estimate for the mean of the average height of all people
at the place of your work. If that's where you pull your sample
and start by putting the 20 heights you are working with into the
blue data. So we've done this already. You should already have
your data in and you know what your mean is in your sample
standard deviation. Then what you're gonna do is you're going
to construct a 95% confidence interval for the true mean height
of all the pupil, the place of your work, what is the
interval? And provide a screenshot which we did today. Then
you're going to give me a practical interpretation what this
means. So what you're explaining is your 95% confident that the
true mean height of all the people that you work with or the
population that you have is between this and this, okay? Then
you're gonna put, of course going to post a screenshot. Then
you're going to change your confidence levels. With 99%
confidence level, you're going to take a screenshot and provide
that as well. You're going to compare the margins of error. So
this is where you're going to talk about what happened to your
margin of error when we went from a 95 to 99% confidence
interval, what happened to your interval when he went from 95
to 99% confidence interval? There should be a good
paragraph explaining what happened, why it's happening, and
try to explain it in the context of the data and the lab. And that's
it. And then you're just going to save your document and
upload and that will submit your work. Please feel free to reach
out if you have any questions or concerns.
Lab 7 Lecture Notes
You will need your Week 5 Lab Data!!
1. Go to Modules in the course room and click on Week 7
Lesson: Hypothesis Testing
2. Click on Week 7 Assignment: Lab
3. Download the Week 6
4. Let’s look at our data from Lab 5!
Data Set: Ten Grades on the Midterm Exam
50
68
74
77
80
86
86
80
78
90
Mean: ________ Our Score: _________
Standard Deviation: _________
5. Find a 95% confidence interval for the true mean Midterm
Average of all the people in the class. What is the interval?
[Provide a Screenshot].
6. Give a practical interpretation of the 95% confidence
interval.
7. Find a 99% confidence interval for the true mean Midterm
Average of all the people in the class. What is the interval?
[Provide a Screenshot].
8. Give a practical interpretation of the 99% confidence
interval. Would the margin of error be larger or smaller for the
99% CI? Explain your reasoning.
Lab 7 Overview
J
LU
TERMINOLOGY 101
Confidence intervals: Part 2
MAHER M. EL-MASRI, RN, PhD, IS AN ASSOCIATE
PROFESSOR AND RESEARCH LEADERSHIP CHAIR
IN THE FACULTY OF NURSING, UNIVERSITY OF
WINDSOR, IN WINDSOR, ONT.
Confidence interval: The range of values, consistent with the
data, that is believed to encompass the actual or
"true" population value
Source: Lang, T.A., & Secic, M. (2006). How to Report
Statistics in Medicine. (2nd ed.). Philadelphia: American
College of Physicians
Part 1, which appeared in the February 2012
issue, introduced the concept of confidence
intervals (CIs) for mean values. This article
explains how to compare the CIs of two mean
scores to draw a conclusion about whether or
not they are statistically different. Two mean
scores are said to be statistically different if their
respective CIs do not overlap. Overlap of the CIs
suggests that the scores may represent the same
"true" population value; in other words, the true
difference in the mean scores may be equivalent
NurseONE resources
ON THIS TOPIC
EBSCO-MEDLINE FULL-TEXT ARTICLES
• Hildebrandt, M., Vervölgyi, E., & Bender, R. (2009).
Calculation of NNTs in RCTs with time-to-event
outcomes: A literature review. BMC Medical
Research Methodology, 9,21.
• Hildebrandt, M., Bender, R., Gehrmann, U.,
& Blettner, M. (2006). Calculating confidence
intervals for impact numbers. ß/MCMed/co/
Research Methodology, 6, 32.
• Altman, D. G. (1998). Confidence intervals forthe
number needed to treat. BMJ (Clinical Research
Ed.), 317(7168), 1309-1312.
MYÎLIBRARY
• Campbell, M. |., Machin, D., & Walters, S. I. (2010).
Medical statistics: A textbook for the health
sciences (4th ed).
• Mateo, M. A., & Kirchhoff, K. T. (Eds.). (2009).
Research for advanced practice nurses:
From evidence to practice.
• Webb, C, & Roe, B. (Eds.). (2007). Reviewing
research evidence for nursing practice:
Systematic reviews.
to zero. Some researchers choose to provide the
CI for the difference of two mean scores instead
of providing a separate CI for each of the mean
scores. In that case, the difference in the mean
scores is said to be statistically significant if its
CI does not include zero (e.g., if the lower limit is
10 and the upper limit is 30). If the CI includes
zero (e.g., if the lower limit is -10 and the upper
limit is 30), we conclude that the observed
difference is not statistically significant.
To illustrate this point, let's say that we want
to compare the mean blood pressure (BP) of
exercising and sedentary patients. The mean BP
is 120 mmHg (95% CI 110-130 mmHg) for the
exercising group and 140 mmHg (95% CI
120-160 mmHg) for the non-exercising group.
We notice that the mean BP values of the two
groups differ by 20 mmHg, and we want to
determine whether this difference is statistically
significant. Notice that the range of values
between 120 and 130 mmHg falls within the CIs
for both groups (i.e., the CIs overlap). Thus, we
conclude that the 20 mmHg difference between
the mean BP values is not statistically
significant. Now, say that the mean BP is
120 mmHg (95% CI 110-130 mmHg) for the
exercising group and 140 mmHg (95% CI
136-144 mmHg) for the sedentary group. In this
case, the two CIs do not overlap: none of the
values within the first CI fall within the range
of values of the second CI. Thus, we conclude
that the mean BP difference of 20 mmHg is
statistically significant.
Remember, we can use either the CIs of two
mean scores or the CI of their difference to draw
conclusions about whether or not the observed
difference between the scores is statistically
significant. •
10 CANADL!N-NURSE.COM
Copyright of Canadian Nurse is the property of Canadian
Nurses Association and its content may not be copied
or emailed to multiple sites or posted to a listserv without the
copyright holder's express written permission.
However, users may print, download, or email articles for
individual use.
TH
E
R
ES
EA
R
c
H
F
IL
E
Il
lu
S
T
r
a
T
IO
n
:
V
A
N
N
I L
O
R
Ig
g
IO
To draw conclusions about a study population,
researchers use samples that they assume truly
represent the population. The confidence
interval (CI) is among the most reliable
indicators of the soundness of their assumption.
A CI is the range of values within which the
population value being studied is believed to fall.
CIs are reported in the results section of
published research and are often calculated
either for mean or proportion data (calculation
details are beyond the scope of this article).
A 95% CI, which is the most common level used
(others are 90% and 99%), means that if
researchers were to sample numerous times
from the same population and calculate a range
of estimates for these samples, 95% of the
intervals within the lower and upper limits of
this range will include the population value.
To illustrate the 95% CI of a mean value, say
that a sample of patients with hypertension has
a mean blood pressure of 120 mmHg and that
the 95% CI for this mean was calculated to range
from 110 to 130 mmHg. This might be reported
as: mean 120 mmHg, 95% CI 110-130 mmHg.
It indicates that if other samples from the same
population of patients were generated and
intervals for the mean blood pressure of these
samples were estimated, 95% of the intervals
between the lower limit of 110 mmHg and the
upper limit of 130 mmHg would include the true
mean blood pressure of the population.
Notice that the width of the CI range is a very
important indicator of how reliably the sample
value represents the population in question.
If the CI is narrow, as it is in our example of
110-130 mmHg, then the upper and lower limits
of the CI will be very close to the mean value of
Confidence interval: The range of values, consistent with the
data, that is believed to encompass the actual or
“true” population value
Source: Lang, T.A., & Secic, M. (2006). How to Report
Statistics in Medicine. (2nd ed.). Philadelphia: American
College of Physicians
the sample. This sample mean value is probably a
more reliable estimate of the true mean value of
the population than a sample mean value with a
wider CI of, for example, 110-210 mmHg. With
such a wide CI, the population mean could be as
high as 210 mmHg, which is far from the sample
mean of 120 mmHg. In fact, a very wide CI in a
study should be a red flag: it indicates that more
data should have been collected before any
serious conclusions were drawn about the
population. Remember, the narrower the CI, the
more likely it is that the sample value represents
the population value. n
MAHER M. EL-MASRI, RN, PhD, IS AN ASSOCIATE
PROFESSOR AND RESEARCH LEADERSHIP CHAIR
IN THE FACULTY OF NURSINg, UNIVERSITY OF
WINDSOR, IN WINDSOR, ONT.
Confidence intervals: Part 1
TERMInoLogy 101
NurseONE resources
on THIS TopIc
EBSCO-MEDlInE full-text articles
• Hildebrandt, M., Vervölgyi, E., & Bender, R. (2009).
Calculation of NNTs in RCTs with time-to-event outcomes:
A literature review. BMC Medical Research Methodology,
9, 21.
• Hildebrandt, M., Bender, R., Gehrmann, U., & Blettner,
M. (2006). Calculating confidence intervals for impact
numbers. BMC Medical Research Methodology, 6, 32.
• Altman, D. G. (1998). Confidence intervals for the number
needed to treat. BMJ (Clinical Research Ed.), 317(7168),
1309-1312.
Myilibrary
• Campbell, M. J., Machin, D., & Walters, S. J. (2010). Medical
statistics: A textbook for the health sciences (4th ed).
• Mateo, M. A., & Kirchhoff, K. T. (Eds.). (2009). Research for
advanced practice nurses: From evidence to practice.
• Webb, C., & Roe, B. (Eds.). (2007). Reviewing research
evidence for nursing practice: Systematic reviews.
8 CANADIAN-NURSE.COM
Copyright of Canadian Nurse is the property of Canadian
Nurses Association and its content may not be copied
or emailed to multiple sites or posted to a listserv without the
copyright holder's express written permission.
However, users may print, download, or email articles for
individual use.

More Related Content

Similar to Confidence interval put values in green cells; output or answers in

Quantitative Methods for Lawyers - Class #15 - R Boot Camp - Part 2 - Profess...
Quantitative Methods for Lawyers - Class #15 - R Boot Camp - Part 2 - Profess...Quantitative Methods for Lawyers - Class #15 - R Boot Camp - Part 2 - Profess...
Quantitative Methods for Lawyers - Class #15 - R Boot Camp - Part 2 - Profess...Daniel Katz
 
Math class 8 data handling
Math class 8 data handling Math class 8 data handling
Math class 8 data handling HimakshiKava
 
What Averages Dont Tell You
What Averages Dont Tell YouWhat Averages Dont Tell You
What Averages Dont Tell Youcliffhurst
 
Confidence Interval ModuleOne of the key concepts of statist.docx
Confidence Interval ModuleOne of the key concepts of statist.docxConfidence Interval ModuleOne of the key concepts of statist.docx
Confidence Interval ModuleOne of the key concepts of statist.docxmaxinesmith73660
 
- Aow-Aowf--,d--Tto o4prnbAuSDUJ_ pya.docx
- Aow-Aowf--,d--Tto o4prnbAuSDUJ_ pya.docx- Aow-Aowf--,d--Tto o4prnbAuSDUJ_ pya.docx
- Aow-Aowf--,d--Tto o4prnbAuSDUJ_ pya.docxmercysuttle
 
Statistical tests
Statistical testsStatistical tests
Statistical testsmartyynyyte
 
Example of a one-sample Z-test The previous lecture in P.docx
Example of a one-sample Z-test The previous lecture in P.docxExample of a one-sample Z-test The previous lecture in P.docx
Example of a one-sample Z-test The previous lecture in P.docxcravennichole326
 
Example of a one-sample Z-test The previous lecture in P.docx
Example of a one-sample Z-test The previous lecture in P.docxExample of a one-sample Z-test The previous lecture in P.docx
Example of a one-sample Z-test The previous lecture in P.docxelbanglis
 
Exam 2 (covers Chapters 6 and 7), Math 140 Spring 2015,.docx
 Exam 2 (covers Chapters 6 and 7), Math 140 Spring 2015,.docx Exam 2 (covers Chapters 6 and 7), Math 140 Spring 2015,.docx
Exam 2 (covers Chapters 6 and 7), Math 140 Spring 2015,.docxMARRY7
 
F ProjHOSPITAL INPATIENT P & L20162017Variance Variance Per DC 20.docx
F ProjHOSPITAL INPATIENT P & L20162017Variance Variance Per DC 20.docxF ProjHOSPITAL INPATIENT P & L20162017Variance Variance Per DC 20.docx
F ProjHOSPITAL INPATIENT P & L20162017Variance Variance Per DC 20.docxmecklenburgstrelitzh
 
35880 Topic Discussion7Number of Pages 1 (Double Spaced).docx
35880 Topic Discussion7Number of Pages 1 (Double Spaced).docx35880 Topic Discussion7Number of Pages 1 (Double Spaced).docx
35880 Topic Discussion7Number of Pages 1 (Double Spaced).docxdomenicacullison
 
Week 6 lecture_math_221_apr_2012
Week 6 lecture_math_221_apr_2012Week 6 lecture_math_221_apr_2012
Week 6 lecture_math_221_apr_2012Brent Heard
 
WEEK 5 HOMEWORK 5THIS WEEK INVOLVES READING NEW TABLES, THE t-TA.docx
WEEK 5 HOMEWORK 5THIS WEEK INVOLVES READING NEW TABLES, THE t-TA.docxWEEK 5 HOMEWORK 5THIS WEEK INVOLVES READING NEW TABLES, THE t-TA.docx
WEEK 5 HOMEWORK 5THIS WEEK INVOLVES READING NEW TABLES, THE t-TA.docxcockekeshia
 
Lecture_Wk08.pdf
Lecture_Wk08.pdfLecture_Wk08.pdf
Lecture_Wk08.pdfNiel89
 
Programming methodology lecture16
Programming methodology lecture16Programming methodology lecture16
Programming methodology lecture16NYversity
 
Percentages_2.ppt
Percentages_2.pptPercentages_2.ppt
Percentages_2.pptanna786828
 
Sampling methods theory and practice
Sampling methods theory and practice Sampling methods theory and practice
Sampling methods theory and practice Ravindra Sharma
 

Similar to Confidence interval put values in green cells; output or answers in (20)

Quantitative Methods for Lawyers - Class #15 - R Boot Camp - Part 2 - Profess...
Quantitative Methods for Lawyers - Class #15 - R Boot Camp - Part 2 - Profess...Quantitative Methods for Lawyers - Class #15 - R Boot Camp - Part 2 - Profess...
Quantitative Methods for Lawyers - Class #15 - R Boot Camp - Part 2 - Profess...
 
Math class 8 data handling
Math class 8 data handling Math class 8 data handling
Math class 8 data handling
 
Week 7 Lecture
Week 7 LectureWeek 7 Lecture
Week 7 Lecture
 
What Averages Dont Tell You
What Averages Dont Tell YouWhat Averages Dont Tell You
What Averages Dont Tell You
 
Confidence Interval ModuleOne of the key concepts of statist.docx
Confidence Interval ModuleOne of the key concepts of statist.docxConfidence Interval ModuleOne of the key concepts of statist.docx
Confidence Interval ModuleOne of the key concepts of statist.docx
 
- Aow-Aowf--,d--Tto o4prnbAuSDUJ_ pya.docx
- Aow-Aowf--,d--Tto o4prnbAuSDUJ_ pya.docx- Aow-Aowf--,d--Tto o4prnbAuSDUJ_ pya.docx
- Aow-Aowf--,d--Tto o4prnbAuSDUJ_ pya.docx
 
Statistical tests
Statistical testsStatistical tests
Statistical tests
 
Lec2
Lec2Lec2
Lec2
 
Example of a one-sample Z-test The previous lecture in P.docx
Example of a one-sample Z-test The previous lecture in P.docxExample of a one-sample Z-test The previous lecture in P.docx
Example of a one-sample Z-test The previous lecture in P.docx
 
Example of a one-sample Z-test The previous lecture in P.docx
Example of a one-sample Z-test The previous lecture in P.docxExample of a one-sample Z-test The previous lecture in P.docx
Example of a one-sample Z-test The previous lecture in P.docx
 
Exam 2 (covers Chapters 6 and 7), Math 140 Spring 2015,.docx
 Exam 2 (covers Chapters 6 and 7), Math 140 Spring 2015,.docx Exam 2 (covers Chapters 6 and 7), Math 140 Spring 2015,.docx
Exam 2 (covers Chapters 6 and 7), Math 140 Spring 2015,.docx
 
F ProjHOSPITAL INPATIENT P & L20162017Variance Variance Per DC 20.docx
F ProjHOSPITAL INPATIENT P & L20162017Variance Variance Per DC 20.docxF ProjHOSPITAL INPATIENT P & L20162017Variance Variance Per DC 20.docx
F ProjHOSPITAL INPATIENT P & L20162017Variance Variance Per DC 20.docx
 
35880 Topic Discussion7Number of Pages 1 (Double Spaced).docx
35880 Topic Discussion7Number of Pages 1 (Double Spaced).docx35880 Topic Discussion7Number of Pages 1 (Double Spaced).docx
35880 Topic Discussion7Number of Pages 1 (Double Spaced).docx
 
Week 6 lecture_math_221_apr_2012
Week 6 lecture_math_221_apr_2012Week 6 lecture_math_221_apr_2012
Week 6 lecture_math_221_apr_2012
 
Sample Size Determination
Sample Size Determination Sample Size Determination
Sample Size Determination
 
WEEK 5 HOMEWORK 5THIS WEEK INVOLVES READING NEW TABLES, THE t-TA.docx
WEEK 5 HOMEWORK 5THIS WEEK INVOLVES READING NEW TABLES, THE t-TA.docxWEEK 5 HOMEWORK 5THIS WEEK INVOLVES READING NEW TABLES, THE t-TA.docx
WEEK 5 HOMEWORK 5THIS WEEK INVOLVES READING NEW TABLES, THE t-TA.docx
 
Lecture_Wk08.pdf
Lecture_Wk08.pdfLecture_Wk08.pdf
Lecture_Wk08.pdf
 
Programming methodology lecture16
Programming methodology lecture16Programming methodology lecture16
Programming methodology lecture16
 
Percentages_2.ppt
Percentages_2.pptPercentages_2.ppt
Percentages_2.ppt
 
Sampling methods theory and practice
Sampling methods theory and practice Sampling methods theory and practice
Sampling methods theory and practice
 

More from ARIV4

Please go through the document completely before providing the answe.docx
Please go through the document completely before providing the answe.docxPlease go through the document completely before providing the answe.docx
Please go through the document completely before providing the answe.docxARIV4
 
Please follow the instruction carefully. APA stile. Mínimum three re.docx
Please follow the instruction carefully. APA stile. Mínimum three re.docxPlease follow the instruction carefully. APA stile. Mínimum three re.docx
Please follow the instruction carefully. APA stile. Mínimum three re.docxARIV4
 
Please follow the instructions attached in MS Word. Font Arial,  .docx
Please follow the instructions attached in MS Word. Font Arial,  .docxPlease follow the instructions attached in MS Word. Font Arial,  .docx
Please follow the instructions attached in MS Word. Font Arial,  .docxARIV4
 
Please help me write a report focusing on photocatalysis of TiO2 .docx
Please help me write a report focusing on photocatalysis of TiO2 .docxPlease help me write a report focusing on photocatalysis of TiO2 .docx
Please help me write a report focusing on photocatalysis of TiO2 .docxARIV4
 
Please follow the directions in the assignment content Environme.docx
Please follow the directions in the assignment content Environme.docxPlease follow the directions in the assignment content Environme.docx
Please follow the directions in the assignment content Environme.docxARIV4
 
Please follow the directions below to complete the project1.).docx
Please follow the directions below to complete the project1.).docxPlease follow the directions below to complete the project1.).docx
Please follow the directions below to complete the project1.).docxARIV4
 
Please follow all directions please. the attachment titled assignme.docx
Please follow all directions please. the attachment titled assignme.docxPlease follow all directions please. the attachment titled assignme.docx
Please follow all directions please. the attachment titled assignme.docxARIV4
 
Please draft a personal message that you would like to appear on you.docx
Please draft a personal message that you would like to appear on you.docxPlease draft a personal message that you would like to appear on you.docx
Please draft a personal message that you would like to appear on you.docxARIV4
 
Please explain how you have met various BSN Essentials for each co.docx
Please explain how you have met various BSN Essentials for each co.docxPlease explain how you have met various BSN Essentials for each co.docx
Please explain how you have met various BSN Essentials for each co.docxARIV4
 
Please Follow directions or I will dispute please answer origina.docx
Please Follow directions or I will dispute please answer origina.docxPlease Follow directions or I will dispute please answer origina.docx
Please Follow directions or I will dispute please answer origina.docxARIV4
 
Please find the attached.Task 1 -  In 150 words comment on att.docx
Please find the attached.Task 1  -  In 150 words comment on att.docxPlease find the attached.Task 1  -  In 150 words comment on att.docx
Please find the attached.Task 1 -  In 150 words comment on att.docxARIV4
 
Please draw primarily from this weeks readings (and use additio.docx
Please draw primarily from this weeks readings (and use additio.docxPlease draw primarily from this weeks readings (and use additio.docx
Please draw primarily from this weeks readings (and use additio.docxARIV4
 
Please explain the reoccurring theme (sub-textual idea) of blin.docx
Please explain the reoccurring theme (sub-textual idea) of blin.docxPlease explain the reoccurring theme (sub-textual idea) of blin.docx
Please explain the reoccurring theme (sub-textual idea) of blin.docxARIV4
 
Please fill the attached Self-Assessment Surveys (TWO) and calcula.docx
Please fill the attached Self-Assessment Surveys (TWO) and calcula.docxPlease fill the attached Self-Assessment Surveys (TWO) and calcula.docx
Please fill the attached Self-Assessment Surveys (TWO) and calcula.docxARIV4
 
Please explain the rules of the calling program (Caller Rules).docx
Please explain the rules of the calling program (Caller Rules).docxPlease explain the rules of the calling program (Caller Rules).docx
Please explain the rules of the calling program (Caller Rules).docxARIV4
 
Please follow directions to receive all possible points!!The int.docx
Please follow directions to receive all possible points!!The int.docxPlease follow directions to receive all possible points!!The int.docx
Please follow directions to receive all possible points!!The int.docxARIV4
 
Please follow instructions A blanch interpersonal record attached..docx
Please follow instructions A blanch interpersonal record attached..docxPlease follow instructions A blanch interpersonal record attached..docx
Please follow instructions A blanch interpersonal record attached..docxARIV4
 
Please explain how you have met various BSN Essentials for each cour.docx
Please explain how you have met various BSN Essentials for each cour.docxPlease explain how you have met various BSN Essentials for each cour.docx
Please explain how you have met various BSN Essentials for each cour.docxARIV4
 
Please explain how you have met various Bachelor of Science in Nur.docx
Please explain how you have met various Bachelor of Science in Nur.docxPlease explain how you have met various Bachelor of Science in Nur.docx
Please explain how you have met various Bachelor of Science in Nur.docxARIV4
 
Please DiscussWhat are host-based, client-based, client-serv.docx
Please DiscussWhat are host-based, client-based, client-serv.docxPlease DiscussWhat are host-based, client-based, client-serv.docx
Please DiscussWhat are host-based, client-based, client-serv.docxARIV4
 

More from ARIV4 (20)

Please go through the document completely before providing the answe.docx
Please go through the document completely before providing the answe.docxPlease go through the document completely before providing the answe.docx
Please go through the document completely before providing the answe.docx
 
Please follow the instruction carefully. APA stile. Mínimum three re.docx
Please follow the instruction carefully. APA stile. Mínimum three re.docxPlease follow the instruction carefully. APA stile. Mínimum three re.docx
Please follow the instruction carefully. APA stile. Mínimum three re.docx
 
Please follow the instructions attached in MS Word. Font Arial,  .docx
Please follow the instructions attached in MS Word. Font Arial,  .docxPlease follow the instructions attached in MS Word. Font Arial,  .docx
Please follow the instructions attached in MS Word. Font Arial,  .docx
 
Please help me write a report focusing on photocatalysis of TiO2 .docx
Please help me write a report focusing on photocatalysis of TiO2 .docxPlease help me write a report focusing on photocatalysis of TiO2 .docx
Please help me write a report focusing on photocatalysis of TiO2 .docx
 
Please follow the directions in the assignment content Environme.docx
Please follow the directions in the assignment content Environme.docxPlease follow the directions in the assignment content Environme.docx
Please follow the directions in the assignment content Environme.docx
 
Please follow the directions below to complete the project1.).docx
Please follow the directions below to complete the project1.).docxPlease follow the directions below to complete the project1.).docx
Please follow the directions below to complete the project1.).docx
 
Please follow all directions please. the attachment titled assignme.docx
Please follow all directions please. the attachment titled assignme.docxPlease follow all directions please. the attachment titled assignme.docx
Please follow all directions please. the attachment titled assignme.docx
 
Please draft a personal message that you would like to appear on you.docx
Please draft a personal message that you would like to appear on you.docxPlease draft a personal message that you would like to appear on you.docx
Please draft a personal message that you would like to appear on you.docx
 
Please explain how you have met various BSN Essentials for each co.docx
Please explain how you have met various BSN Essentials for each co.docxPlease explain how you have met various BSN Essentials for each co.docx
Please explain how you have met various BSN Essentials for each co.docx
 
Please Follow directions or I will dispute please answer origina.docx
Please Follow directions or I will dispute please answer origina.docxPlease Follow directions or I will dispute please answer origina.docx
Please Follow directions or I will dispute please answer origina.docx
 
Please find the attached.Task 1 -  In 150 words comment on att.docx
Please find the attached.Task 1  -  In 150 words comment on att.docxPlease find the attached.Task 1  -  In 150 words comment on att.docx
Please find the attached.Task 1 -  In 150 words comment on att.docx
 
Please draw primarily from this weeks readings (and use additio.docx
Please draw primarily from this weeks readings (and use additio.docxPlease draw primarily from this weeks readings (and use additio.docx
Please draw primarily from this weeks readings (and use additio.docx
 
Please explain the reoccurring theme (sub-textual idea) of blin.docx
Please explain the reoccurring theme (sub-textual idea) of blin.docxPlease explain the reoccurring theme (sub-textual idea) of blin.docx
Please explain the reoccurring theme (sub-textual idea) of blin.docx
 
Please fill the attached Self-Assessment Surveys (TWO) and calcula.docx
Please fill the attached Self-Assessment Surveys (TWO) and calcula.docxPlease fill the attached Self-Assessment Surveys (TWO) and calcula.docx
Please fill the attached Self-Assessment Surveys (TWO) and calcula.docx
 
Please explain the rules of the calling program (Caller Rules).docx
Please explain the rules of the calling program (Caller Rules).docxPlease explain the rules of the calling program (Caller Rules).docx
Please explain the rules of the calling program (Caller Rules).docx
 
Please follow directions to receive all possible points!!The int.docx
Please follow directions to receive all possible points!!The int.docxPlease follow directions to receive all possible points!!The int.docx
Please follow directions to receive all possible points!!The int.docx
 
Please follow instructions A blanch interpersonal record attached..docx
Please follow instructions A blanch interpersonal record attached..docxPlease follow instructions A blanch interpersonal record attached..docx
Please follow instructions A blanch interpersonal record attached..docx
 
Please explain how you have met various BSN Essentials for each cour.docx
Please explain how you have met various BSN Essentials for each cour.docxPlease explain how you have met various BSN Essentials for each cour.docx
Please explain how you have met various BSN Essentials for each cour.docx
 
Please explain how you have met various Bachelor of Science in Nur.docx
Please explain how you have met various Bachelor of Science in Nur.docxPlease explain how you have met various Bachelor of Science in Nur.docx
Please explain how you have met various Bachelor of Science in Nur.docx
 
Please DiscussWhat are host-based, client-based, client-serv.docx
Please DiscussWhat are host-based, client-based, client-serv.docxPlease DiscussWhat are host-based, client-based, client-serv.docx
Please DiscussWhat are host-based, client-based, client-serv.docx
 

Recently uploaded

On National Teacher Day, meet the 2024-25 Kenan Fellows
On National Teacher Day, meet the 2024-25 Kenan FellowsOn National Teacher Day, meet the 2024-25 Kenan Fellows
On National Teacher Day, meet the 2024-25 Kenan FellowsMebane Rash
 
How to setup Pycharm environment for Odoo 17.pptx
How to setup Pycharm environment for Odoo 17.pptxHow to setup Pycharm environment for Odoo 17.pptx
How to setup Pycharm environment for Odoo 17.pptxCeline George
 
UGC NET Paper 1 Mathematical Reasoning & Aptitude.pdf
UGC NET Paper 1 Mathematical Reasoning & Aptitude.pdfUGC NET Paper 1 Mathematical Reasoning & Aptitude.pdf
UGC NET Paper 1 Mathematical Reasoning & Aptitude.pdfNirmal Dwivedi
 
SOC 101 Demonstration of Learning Presentation
SOC 101 Demonstration of Learning PresentationSOC 101 Demonstration of Learning Presentation
SOC 101 Demonstration of Learning Presentationcamerronhm
 
FSB Advising Checklist - Orientation 2024
FSB Advising Checklist - Orientation 2024FSB Advising Checklist - Orientation 2024
FSB Advising Checklist - Orientation 2024Elizabeth Walsh
 
Interdisciplinary_Insights_Data_Collection_Methods.pptx
Interdisciplinary_Insights_Data_Collection_Methods.pptxInterdisciplinary_Insights_Data_Collection_Methods.pptx
Interdisciplinary_Insights_Data_Collection_Methods.pptxPooja Bhuva
 
2024-NATIONAL-LEARNING-CAMP-AND-OTHER.pptx
2024-NATIONAL-LEARNING-CAMP-AND-OTHER.pptx2024-NATIONAL-LEARNING-CAMP-AND-OTHER.pptx
2024-NATIONAL-LEARNING-CAMP-AND-OTHER.pptxMaritesTamaniVerdade
 
80 ĐỀ THI THỬ TUYỂN SINH TIẾNG ANH VÀO 10 SỞ GD – ĐT THÀNH PHỐ HỒ CHÍ MINH NĂ...
80 ĐỀ THI THỬ TUYỂN SINH TIẾNG ANH VÀO 10 SỞ GD – ĐT THÀNH PHỐ HỒ CHÍ MINH NĂ...80 ĐỀ THI THỬ TUYỂN SINH TIẾNG ANH VÀO 10 SỞ GD – ĐT THÀNH PHỐ HỒ CHÍ MINH NĂ...
80 ĐỀ THI THỬ TUYỂN SINH TIẾNG ANH VÀO 10 SỞ GD – ĐT THÀNH PHỐ HỒ CHÍ MINH NĂ...Nguyen Thanh Tu Collection
 
Salient Features of India constitution especially power and functions
Salient Features of India constitution especially power and functionsSalient Features of India constitution especially power and functions
Salient Features of India constitution especially power and functionsKarakKing
 
Beyond_Borders_Understanding_Anime_and_Manga_Fandom_A_Comprehensive_Audience_...
Beyond_Borders_Understanding_Anime_and_Manga_Fandom_A_Comprehensive_Audience_...Beyond_Borders_Understanding_Anime_and_Manga_Fandom_A_Comprehensive_Audience_...
Beyond_Borders_Understanding_Anime_and_Manga_Fandom_A_Comprehensive_Audience_...Pooja Bhuva
 
Exploring_the_Narrative_Style_of_Amitav_Ghoshs_Gun_Island.pptx
Exploring_the_Narrative_Style_of_Amitav_Ghoshs_Gun_Island.pptxExploring_the_Narrative_Style_of_Amitav_Ghoshs_Gun_Island.pptx
Exploring_the_Narrative_Style_of_Amitav_Ghoshs_Gun_Island.pptxPooja Bhuva
 
Wellbeing inclusion and digital dystopias.pptx
Wellbeing inclusion and digital dystopias.pptxWellbeing inclusion and digital dystopias.pptx
Wellbeing inclusion and digital dystopias.pptxJisc
 
How to Add New Custom Addons Path in Odoo 17
How to Add New Custom Addons Path in Odoo 17How to Add New Custom Addons Path in Odoo 17
How to Add New Custom Addons Path in Odoo 17Celine George
 
How to Give a Domain for a Field in Odoo 17
How to Give a Domain for a Field in Odoo 17How to Give a Domain for a Field in Odoo 17
How to Give a Domain for a Field in Odoo 17Celine George
 
General Principles of Intellectual Property: Concepts of Intellectual Proper...
General Principles of Intellectual Property: Concepts of Intellectual  Proper...General Principles of Intellectual Property: Concepts of Intellectual  Proper...
General Principles of Intellectual Property: Concepts of Intellectual Proper...Poonam Aher Patil
 
The basics of sentences session 3pptx.pptx
The basics of sentences session 3pptx.pptxThe basics of sentences session 3pptx.pptx
The basics of sentences session 3pptx.pptxheathfieldcps1
 
Plant propagation: Sexual and Asexual propapagation.pptx
Plant propagation: Sexual and Asexual propapagation.pptxPlant propagation: Sexual and Asexual propapagation.pptx
Plant propagation: Sexual and Asexual propapagation.pptxUmeshTimilsina1
 
How to Manage Global Discount in Odoo 17 POS
How to Manage Global Discount in Odoo 17 POSHow to Manage Global Discount in Odoo 17 POS
How to Manage Global Discount in Odoo 17 POSCeline George
 
Understanding Accommodations and Modifications
Understanding  Accommodations and ModificationsUnderstanding  Accommodations and Modifications
Understanding Accommodations and ModificationsMJDuyan
 
Python Notes for mca i year students osmania university.docx
Python Notes for mca i year students osmania university.docxPython Notes for mca i year students osmania university.docx
Python Notes for mca i year students osmania university.docxRamakrishna Reddy Bijjam
 

Recently uploaded (20)

On National Teacher Day, meet the 2024-25 Kenan Fellows
On National Teacher Day, meet the 2024-25 Kenan FellowsOn National Teacher Day, meet the 2024-25 Kenan Fellows
On National Teacher Day, meet the 2024-25 Kenan Fellows
 
How to setup Pycharm environment for Odoo 17.pptx
How to setup Pycharm environment for Odoo 17.pptxHow to setup Pycharm environment for Odoo 17.pptx
How to setup Pycharm environment for Odoo 17.pptx
 
UGC NET Paper 1 Mathematical Reasoning & Aptitude.pdf
UGC NET Paper 1 Mathematical Reasoning & Aptitude.pdfUGC NET Paper 1 Mathematical Reasoning & Aptitude.pdf
UGC NET Paper 1 Mathematical Reasoning & Aptitude.pdf
 
SOC 101 Demonstration of Learning Presentation
SOC 101 Demonstration of Learning PresentationSOC 101 Demonstration of Learning Presentation
SOC 101 Demonstration of Learning Presentation
 
FSB Advising Checklist - Orientation 2024
FSB Advising Checklist - Orientation 2024FSB Advising Checklist - Orientation 2024
FSB Advising Checklist - Orientation 2024
 
Interdisciplinary_Insights_Data_Collection_Methods.pptx
Interdisciplinary_Insights_Data_Collection_Methods.pptxInterdisciplinary_Insights_Data_Collection_Methods.pptx
Interdisciplinary_Insights_Data_Collection_Methods.pptx
 
2024-NATIONAL-LEARNING-CAMP-AND-OTHER.pptx
2024-NATIONAL-LEARNING-CAMP-AND-OTHER.pptx2024-NATIONAL-LEARNING-CAMP-AND-OTHER.pptx
2024-NATIONAL-LEARNING-CAMP-AND-OTHER.pptx
 
80 ĐỀ THI THỬ TUYỂN SINH TIẾNG ANH VÀO 10 SỞ GD – ĐT THÀNH PHỐ HỒ CHÍ MINH NĂ...
80 ĐỀ THI THỬ TUYỂN SINH TIẾNG ANH VÀO 10 SỞ GD – ĐT THÀNH PHỐ HỒ CHÍ MINH NĂ...80 ĐỀ THI THỬ TUYỂN SINH TIẾNG ANH VÀO 10 SỞ GD – ĐT THÀNH PHỐ HỒ CHÍ MINH NĂ...
80 ĐỀ THI THỬ TUYỂN SINH TIẾNG ANH VÀO 10 SỞ GD – ĐT THÀNH PHỐ HỒ CHÍ MINH NĂ...
 
Salient Features of India constitution especially power and functions
Salient Features of India constitution especially power and functionsSalient Features of India constitution especially power and functions
Salient Features of India constitution especially power and functions
 
Beyond_Borders_Understanding_Anime_and_Manga_Fandom_A_Comprehensive_Audience_...
Beyond_Borders_Understanding_Anime_and_Manga_Fandom_A_Comprehensive_Audience_...Beyond_Borders_Understanding_Anime_and_Manga_Fandom_A_Comprehensive_Audience_...
Beyond_Borders_Understanding_Anime_and_Manga_Fandom_A_Comprehensive_Audience_...
 
Exploring_the_Narrative_Style_of_Amitav_Ghoshs_Gun_Island.pptx
Exploring_the_Narrative_Style_of_Amitav_Ghoshs_Gun_Island.pptxExploring_the_Narrative_Style_of_Amitav_Ghoshs_Gun_Island.pptx
Exploring_the_Narrative_Style_of_Amitav_Ghoshs_Gun_Island.pptx
 
Wellbeing inclusion and digital dystopias.pptx
Wellbeing inclusion and digital dystopias.pptxWellbeing inclusion and digital dystopias.pptx
Wellbeing inclusion and digital dystopias.pptx
 
How to Add New Custom Addons Path in Odoo 17
How to Add New Custom Addons Path in Odoo 17How to Add New Custom Addons Path in Odoo 17
How to Add New Custom Addons Path in Odoo 17
 
How to Give a Domain for a Field in Odoo 17
How to Give a Domain for a Field in Odoo 17How to Give a Domain for a Field in Odoo 17
How to Give a Domain for a Field in Odoo 17
 
General Principles of Intellectual Property: Concepts of Intellectual Proper...
General Principles of Intellectual Property: Concepts of Intellectual  Proper...General Principles of Intellectual Property: Concepts of Intellectual  Proper...
General Principles of Intellectual Property: Concepts of Intellectual Proper...
 
The basics of sentences session 3pptx.pptx
The basics of sentences session 3pptx.pptxThe basics of sentences session 3pptx.pptx
The basics of sentences session 3pptx.pptx
 
Plant propagation: Sexual and Asexual propapagation.pptx
Plant propagation: Sexual and Asexual propapagation.pptxPlant propagation: Sexual and Asexual propapagation.pptx
Plant propagation: Sexual and Asexual propapagation.pptx
 
How to Manage Global Discount in Odoo 17 POS
How to Manage Global Discount in Odoo 17 POSHow to Manage Global Discount in Odoo 17 POS
How to Manage Global Discount in Odoo 17 POS
 
Understanding Accommodations and Modifications
Understanding  Accommodations and ModificationsUnderstanding  Accommodations and Modifications
Understanding Accommodations and Modifications
 
Python Notes for mca i year students osmania university.docx
Python Notes for mca i year students osmania university.docxPython Notes for mca i year students osmania university.docx
Python Notes for mca i year students osmania university.docx
 

Confidence interval put values in green cells; output or answers in

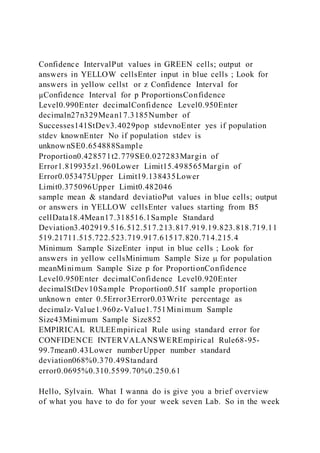
  • 1. Confidence IntervalPut values in GREEN cells; output or answers in YELLOW cellsEnter input in blue cells ; Look for answers in yellow cellst or z Confidence Interval for µConfidence Interval for p ProportionsConfidence Level0.990Enter decimalConfidence Level0.950Enter decimaln27n329Mean17.3185Number of Successes141StDev3.4029pop stdevnoEnter yes if population stdev knownEnter No if population stdev is unknownSE0.654888Sample Proportion0.428571t2.779SE0.027283Margin of Error1.819935z1.960Lower Limit15.498565Margin of Error0.053475Upper Limit19.138435Lower Limit0.375096Upper Limit0.482046 sample mean & standard deviatioPut values in blue cells; output or answers in YELLOW cellsEnter values starting from B5 cellData18.4Mean17.318516.1Sample Standard Deviation3.402919.516.512.517.213.817.919.19.823.818.719.11 519.21711.515.722.523.719.917.61517.820.714.215.4 Minimum Sample SizeEnter input in blue cells ; Look for answers in yellow cellsMinimum Sample Size μ for population meanMinimum Sample Size p for ProportionConfidence Level0.950Enter decimalConfidence Level0.920Enter decimalStDev10Sample Proportion0.5If sample proportion unknown enter 0.5Error3Error0.03Write percentage as decimalz-Value1.960z-Value1.751Minimum Sample Size43Minimum Sample Size852 EMPIRICAL RULEEmpirical Rule using standard error for CONFIDENCE INTERVALANSWEREmpirical Rule68-95- 99.7mean0.43Lower numberUpper number standard deviation068%0.370.49Standard error0.0695%0.310.5599.70%0.250.61 Hello, Sylvain. What I wanna do is give you a brief overview of what you have to do for your week seven Lab. So in the week
  • 2. seven lab, the only spreadsheet we're going to really need is your week six spreadsheet. So if you go to Modules and under week six and got the lesson here shall weeks, Week six spreadsheet. I've already downloaded it, so it looks like this. So this is the spreadsheet you should have downloaded for the lab. So I will download that. Another thing that I would download is the week seven Lab. So that looks like this. Now remember these lecture notes are for you to write all over them. Make any little documentation that you would like to help you do your lab. Ok. So in the week seven lab, you're, the only spreadsheet you need is the week six spreadsheet, but you do need your week five lab data. So go ahead and take a moment to pull that. That should be the ten heights that your instructor gave you and then the ten heights that you gathered. Ok. So to get, I talk about how to get the weeks, six spreadsheets. So you have that. Now in order to kind of give an example of what you're going to do in your lab. I want to go back and look at our data from lab five. Now remember the scenario for lab five. I'm a principal of a high school. I walk down the senior map hallway and I picked one class in one class had ten students in it. And I pooled their midterm exam math scores. And they're listed here. If you remember from lab from last week that our mean, I'm just going to write it here. Feel free to fill in on your sheet. Our mean was a 76.9. Our standard deviation was 11.3964. And if remember our score that we were comparing was an 85. So I'm gonna write those down. Okay? So what I wanna do is I want to find a 95% confidence interval for the true mean midterm average of all the people in the class spraying it all. And then even trying to branch out further if we could to all the people in that or see years or whatever, what would the population we're trying to represent. So if you open up your week six spreadsheet, it's asking for competence level. And so our first one is 95. N is how many pieces of data we have. We only have ten. Are mean was 76.9, our standard deviation was 11.396 for population standard deviation, our answer is no, we don't know, we didn't have a
  • 3. population. They're asking if this standard deviation is a population standard deviation or not. And it was not because we've pulled a sample. Okay. You would only type yes, here if you've actually pulled an entire population. Okay? And so then it gives us some great information here in yellow. But the one thing you're going to take a look at are these the margin of error, you're lower and your upper limit. So I'm going to take a screenshot because that's the first thing that's asking for. Take a screenshot or Dina and you feel free to do the same so that you have it. And then I'll even, and then you can print these out and look at them while you're doing it for lab. Let me make it very small. So it, since he got up into space. Okay. So there's my 95% confidence at all. Now, give a practical interpretation of what this means. Well, what this means is that I can write, I am 95% confident. I am 95% confident that the true average of the mass mid-term exam is between 68.785.1 k. I am 95% confident that the true average, remember we only pull ten people. But if I were, if I wanted that to represent the entire average of the midterm exam of everybody who took it. It's between a 68.785.1. I'm 95% sure that the average will be there. So what I mean by that is I would have to verify I would have to go and pull the midterm math exam of every single student who took it in that senior year at that school and average it out. And what I'm saying is a 95% sure that that average will fall between 60.785.1. A lot of students say, oh, I'm 95% confident that the average of my sample, now, you know the average of your sample, the average of your sample with 76.9. So don't, when you're making a practical interpretation, you're not saying something about the sample. You're seeing something about the true mean of the population. If that makes sense. So you're basing it off of the sample that you have. Okay? Then what you're gonna do is you're going to do a 99% confidence interval. So all you have to do is go back to our spreadsheet and I, and when its height in, in blue, that I'm changing the confidence level from 0.952.99. So let's change this to 0.99. Then I'm going to take a screenshot in your answers
  • 4. should match mine right now. We're doing this together for the midterm math example. Okay? So here's my screenshot. Now this is for a 99% confidence interval. So what is the practical interpretation of that? Again, let's write this out. I am 99% confident that the true average of the midterm exam is between 65.288.6. So 60 by 0.288.6. And I'm getting that from the lower and the upper limit of my confidence interval. Now, want you to do is I want you to look at the margin of error. The margin of error for being 99% confident was 11.7, and the margin of error for being 95% confident was 8.15. What does that mean? Explain what that even means. What would the margin of error be larger or smaller? So in this case, and I want to tell you the answer for years, but for this case, it would be larger. And I want you to think about why that is. Look at the confidence intervals themselves. If you come back up here for the 95, mm, the 95 was between 68.785.1 and this is 65.288.6. It's kind of hard. You want to see if we can look at them side-by-side even that would be great. But you should notice that the interval for the 99% confidence is wider. It's a wider interval. Why is that? Think about that. Why is it, why is it bigger? Well, I want you to think about this. If you're 99% confident, that means that you don't want to be wrong, right? I mean, you never want to be wrong anytime. But 99% confidence means that you're, you're, you're pretty sure, like you're very, very sure that it's going to fall between 65.20.6. That the more sure. How could you even me washer by opening up the interval? Does that make sense? So let me demonstrate here, maybe this will make more sense. Let's say I was like, I am sure that the average amount of rain I'm going to get is two inches and six inches of rain, I'm sure but 95%. Well, I don't want you to be 95%. I want you to be 99%. All of you want me to be that sure. I'm sure is between 015 Inches of rain. I don't know where we're living but 0.15. so what I did is I've widened my interval so that I could have the amount of inches of rain inside of my interval. You widen it, you include more numbers. Therefore, that makes you more confident. Okay? So that's what happened
  • 5. here. So what we did just to recap, we took data from last week, okay? And we looked at the mean, the score, and the standard deviation, and we constructed a 9599% confidence interval. We talked about what they mean in context of the problem. Okay? We also looked at what happened to the interval itself as we become more confident and feel free to play around with this a little bit. What if you're 80% confident? What if you're 90% confident? So look what happens to your margin as you do that. Look what happens to the length of your interval when you change your level of confidence. That's really great to bring in to your lab. So hopefully that explains what we're gonna do in your actual lab. So let's look at your actual lab. So what you're going to be doing is you're going to first, I want you to read articles about competence intervals. I would really like you to see how they apply, especially in the health sciences. And these articles will kind of inspire that thought. Okay? And then what you're gonna do is you're going to, and I would love the little summary. I would love a little summary starting off this lab of what you learned from these articles. Then the next step, using the data that you collected in week five. Now remember in week five, you had ten different peoples height plus the ten that you or your professor gave you. So you should have 20 numbers. I want you to discuss the Gad Yair method of collection was its systematic convenience. Cluster, cluster stratified simple random. What are some false? I know you highlighted this in week five, but now I want you to talk about what are some faults with the type of data collection, okay. What other types of data collections could you used instead? And how might that affected your survey? So this right here is the really important part. This is what I am trying to see what you have learned, okay? So it's about telling me again what type of method you chose. Telling me what faults come with that method, some research might be involved. And then telling me another type of method that you would've liked to try if you could have and how that would affect your study. Okay. Then you're going to tell me what the point estimate was, the
  • 6. point estimates, your mean. So in our case when we're talking about the midterm, whereas my lecture notes here again, this right here, maybe I should write this down. The mean, the 76.9, that's your point estimate. This is what we're basing it off of. Okay? So the point estimate is the mean. Okay? So give a point estimate for the mean of the average height of all people at the place of your work. If that's where you pull your sample and start by putting the 20 heights you are working with into the blue data. So we've done this already. You should already have your data in and you know what your mean is in your sample standard deviation. Then what you're gonna do is you're going to construct a 95% confidence interval for the true mean height of all the pupil, the place of your work, what is the interval? And provide a screenshot which we did today. Then you're going to give me a practical interpretation what this means. So what you're explaining is your 95% confident that the true mean height of all the people that you work with or the population that you have is between this and this, okay? Then you're gonna put, of course going to post a screenshot. Then you're going to change your confidence levels. With 99% confidence level, you're going to take a screenshot and provide that as well. You're going to compare the margins of error. So this is where you're going to talk about what happened to your margin of error when we went from a 95 to 99% confidence interval, what happened to your interval when he went from 95 to 99% confidence interval? There should be a good paragraph explaining what happened, why it's happening, and try to explain it in the context of the data and the lab. And that's it. And then you're just going to save your document and upload and that will submit your work. Please feel free to reach out if you have any questions or concerns. Lab 7 Lecture Notes You will need your Week 5 Lab Data!!
  • 7. 1. Go to Modules in the course room and click on Week 7 Lesson: Hypothesis Testing 2. Click on Week 7 Assignment: Lab 3. Download the Week 6 4. Let’s look at our data from Lab 5! Data Set: Ten Grades on the Midterm Exam 50 68 74 77 80 86 86 80 78 90 Mean: ________ Our Score: _________ Standard Deviation: _________ 5. Find a 95% confidence interval for the true mean Midterm Average of all the people in the class. What is the interval? [Provide a Screenshot].
  • 8. 6. Give a practical interpretation of the 95% confidence interval. 7. Find a 99% confidence interval for the true mean Midterm Average of all the people in the class. What is the interval? [Provide a Screenshot]. 8. Give a practical interpretation of the 99% confidence interval. Would the margin of error be larger or smaller for the 99% CI? Explain your reasoning. Lab 7 Overview J LU
  • 9. TERMINOLOGY 101 Confidence intervals: Part 2 MAHER M. EL-MASRI, RN, PhD, IS AN ASSOCIATE PROFESSOR AND RESEARCH LEADERSHIP CHAIR IN THE FACULTY OF NURSING, UNIVERSITY OF WINDSOR, IN WINDSOR, ONT. Confidence interval: The range of values, consistent with the data, that is believed to encompass the actual or "true" population value Source: Lang, T.A., & Secic, M. (2006). How to Report Statistics in Medicine. (2nd ed.). Philadelphia: American College of Physicians Part 1, which appeared in the February 2012 issue, introduced the concept of confidence intervals (CIs) for mean values. This article explains how to compare the CIs of two mean scores to draw a conclusion about whether or not they are statistically different. Two mean scores are said to be statistically different if their respective CIs do not overlap. Overlap of the CIs suggests that the scores may represent the same "true" population value; in other words, the true difference in the mean scores may be equivalent NurseONE resources ON THIS TOPIC EBSCO-MEDLINE FULL-TEXT ARTICLES • Hildebrandt, M., Vervölgyi, E., & Bender, R. (2009). Calculation of NNTs in RCTs with time-to-event
  • 10. outcomes: A literature review. BMC Medical Research Methodology, 9,21. • Hildebrandt, M., Bender, R., Gehrmann, U., & Blettner, M. (2006). Calculating confidence intervals for impact numbers. ß/MCMed/co/ Research Methodology, 6, 32. • Altman, D. G. (1998). Confidence intervals forthe number needed to treat. BMJ (Clinical Research Ed.), 317(7168), 1309-1312. MYÎLIBRARY • Campbell, M. |., Machin, D., & Walters, S. I. (2010). Medical statistics: A textbook for the health sciences (4th ed). • Mateo, M. A., & Kirchhoff, K. T. (Eds.). (2009). Research for advanced practice nurses: From evidence to practice. • Webb, C, & Roe, B. (Eds.). (2007). Reviewing research evidence for nursing practice: Systematic reviews. to zero. Some researchers choose to provide the CI for the difference of two mean scores instead of providing a separate CI for each of the mean scores. In that case, the difference in the mean scores is said to be statistically significant if its CI does not include zero (e.g., if the lower limit is 10 and the upper limit is 30). If the CI includes zero (e.g., if the lower limit is -10 and the upper limit is 30), we conclude that the observed difference is not statistically significant.
  • 11. To illustrate this point, let's say that we want to compare the mean blood pressure (BP) of exercising and sedentary patients. The mean BP is 120 mmHg (95% CI 110-130 mmHg) for the exercising group and 140 mmHg (95% CI 120-160 mmHg) for the non-exercising group. We notice that the mean BP values of the two groups differ by 20 mmHg, and we want to determine whether this difference is statistically significant. Notice that the range of values between 120 and 130 mmHg falls within the CIs for both groups (i.e., the CIs overlap). Thus, we conclude that the 20 mmHg difference between the mean BP values is not statistically significant. Now, say that the mean BP is 120 mmHg (95% CI 110-130 mmHg) for the exercising group and 140 mmHg (95% CI 136-144 mmHg) for the sedentary group. In this case, the two CIs do not overlap: none of the values within the first CI fall within the range of values of the second CI. Thus, we conclude that the mean BP difference of 20 mmHg is statistically significant. Remember, we can use either the CIs of two mean scores or the CI of their difference to draw conclusions about whether or not the observed difference between the scores is statistically significant. • 10 CANADL!N-NURSE.COM Copyright of Canadian Nurse is the property of Canadian
  • 12. Nurses Association and its content may not be copied or emailed to multiple sites or posted to a listserv without the copyright holder's express written permission. However, users may print, download, or email articles for individual use. TH E R ES EA R c H F IL E Il lu S T r a
  • 13. T IO n : V A N N I L O R Ig g IO To draw conclusions about a study population, researchers use samples that they assume truly represent the population. The confidence interval (CI) is among the most reliable indicators of the soundness of their assumption. A CI is the range of values within which the population value being studied is believed to fall. CIs are reported in the results section of published research and are often calculated either for mean or proportion data (calculation details are beyond the scope of this article). A 95% CI, which is the most common level used (others are 90% and 99%), means that if researchers were to sample numerous times
  • 14. from the same population and calculate a range of estimates for these samples, 95% of the intervals within the lower and upper limits of this range will include the population value. To illustrate the 95% CI of a mean value, say that a sample of patients with hypertension has a mean blood pressure of 120 mmHg and that the 95% CI for this mean was calculated to range from 110 to 130 mmHg. This might be reported as: mean 120 mmHg, 95% CI 110-130 mmHg. It indicates that if other samples from the same population of patients were generated and intervals for the mean blood pressure of these samples were estimated, 95% of the intervals between the lower limit of 110 mmHg and the upper limit of 130 mmHg would include the true mean blood pressure of the population. Notice that the width of the CI range is a very important indicator of how reliably the sample value represents the population in question. If the CI is narrow, as it is in our example of 110-130 mmHg, then the upper and lower limits of the CI will be very close to the mean value of Confidence interval: The range of values, consistent with the data, that is believed to encompass the actual or “true” population value Source: Lang, T.A., & Secic, M. (2006). How to Report Statistics in Medicine. (2nd ed.). Philadelphia: American College of Physicians the sample. This sample mean value is probably a more reliable estimate of the true mean value of
  • 15. the population than a sample mean value with a wider CI of, for example, 110-210 mmHg. With such a wide CI, the population mean could be as high as 210 mmHg, which is far from the sample mean of 120 mmHg. In fact, a very wide CI in a study should be a red flag: it indicates that more data should have been collected before any serious conclusions were drawn about the population. Remember, the narrower the CI, the more likely it is that the sample value represents the population value. n MAHER M. EL-MASRI, RN, PhD, IS AN ASSOCIATE PROFESSOR AND RESEARCH LEADERSHIP CHAIR IN THE FACULTY OF NURSINg, UNIVERSITY OF WINDSOR, IN WINDSOR, ONT. Confidence intervals: Part 1 TERMInoLogy 101 NurseONE resources on THIS TopIc EBSCO-MEDlInE full-text articles • Hildebrandt, M., Vervölgyi, E., & Bender, R. (2009). Calculation of NNTs in RCTs with time-to-event outcomes: A literature review. BMC Medical Research Methodology, 9, 21. • Hildebrandt, M., Bender, R., Gehrmann, U., & Blettner, M. (2006). Calculating confidence intervals for impact numbers. BMC Medical Research Methodology, 6, 32. • Altman, D. G. (1998). Confidence intervals for the number needed to treat. BMJ (Clinical Research Ed.), 317(7168), 1309-1312.
  • 16. Myilibrary • Campbell, M. J., Machin, D., & Walters, S. J. (2010). Medical statistics: A textbook for the health sciences (4th ed). • Mateo, M. A., & Kirchhoff, K. T. (Eds.). (2009). Research for advanced practice nurses: From evidence to practice. • Webb, C., & Roe, B. (Eds.). (2007). Reviewing research evidence for nursing practice: Systematic reviews. 8 CANADIAN-NURSE.COM Copyright of Canadian Nurse is the property of Canadian Nurses Association and its content may not be copied or emailed to multiple sites or posted to a listserv without the copyright holder's express written permission. However, users may print, download, or email articles for individual use.