1. Orbitz Worldwide, Inc. Reports Second Quarter 2012 Results
Chicago, August 8, 2012 - Orbitz Worldwide, Inc. (NYSE: OWW) today announced results for the second
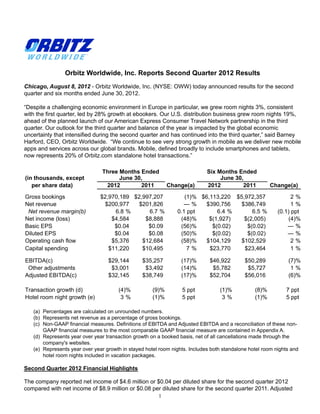
quarter and six months ended June 30, 2012.
“Despite a challenging economic environment in Europe in particular, we grew room nights 3%, consistent
with the first quarter, led by 28% growth at ebookers. Our U.S. distribution business grew room nights 19%,
ahead of the planned launch of our American Express Consumer Travel Network partnership in the third
quarter. Our outlook for the third quarter and balance of the year is impacted by the global economic
uncertainty that intensified during the second quarter and has continued into the third quarter,” said Barney
Harford, CEO, Orbitz Worldwide. “We continue to see very strong growth in mobile as we deliver new mobile
apps and services across our global brands. Mobile, defined broadly to include smartphones and tablets,
now represents 20% of Orbitz.com standalone hotel transactions.”
Three Months Ended Six Months Ended
(in thousands, except June 30, June 30,
per share data) 2012 2011 Change(a) 2012 2011 Change(a)
Gross bookings $2,970,189 $2,997,207 (1)% $6,113,220 $5,972,357 2%
Net revenue $200,977 $201,826 —% $390,756 $386,749 1%
Net revenue margin(b) 6.8 % 6.7 % 0.1 ppt 6.4 % 6.5 % (0.1) ppt
Net income (loss) $4,584 $8,888 (48)% $(1,927) $(2,005) (4)%
Basic EPS $0.04 $0.09 (56)% $(0.02) $(0.02) —%
Diluted EPS $0.04 $0.08 (50)% $(0.02) $(0.02) —%
Operating cash flow $5,376 $12,684 (58)% $104,129 $102,529 2%
Capital spending $11,220 $10,495 7% $23,770 $23,464 1%
EBITDA(c) $29,144 $35,257 (17)% $46,922 $50,289 (7)%
Other adjustments $3,001 $3,492 (14)% $5,782 $5,727 1%
Adjusted EBITDA(c) $32,145 $38,749 (17)% $52,704 $56,016 (6)%
Transaction growth (d) (4)% (9)% 5 ppt (1)% (8)% 7 ppt
Hotel room night growth (e) 3% (1)% 5 ppt 3% (1)% 5 ppt
(a) Percentages are calculated on unrounded numbers.
(b) Represents net revenue as a percentage of gross bookings.
(c) Non-GAAP financial measures. Definitions of EBITDA and Adjusted EBITDA and a reconciliation of these non-
GAAP financial measures to the most comparable GAAP financial measure are contained in Appendix A.
(d) Represents year over year transaction growth on a booked basis, net of all cancellations made through the
company's websites.
(e) Represents year over year growth in stayed hotel room nights. Includes both standalone hotel room nights and
hotel room nights included in vacation packages.
Second Quarter 2012 Financial Highlights
The company reported net income of $4.6 million or $0.04 per diluted share for the second quarter 2012
compared with net income of $8.9 million or $0.08 per diluted share for the second quarter 2011. Adjusted
1
2. EBITDA was $32.1 million for the second quarter 2012.
Gross Bookings and Net Revenue
Gross bookings declined one percent year over year at reported rates. On a constant currency basis, gross
bookings were up one percent in the quarter primarily driven by higher vacation package and hotel volume,
higher air fares and a shift in air carrier mix, partially offset by lower air volume.
Net revenue was $201.0 million for the second quarter 2012, relatively flat year over year. On a constant
currency basis, net revenue was up two percent in the quarter due primarily to higher vacation package and
hotel volume, higher net revenue per airline ticket and higher advertising revenue, partially offset by lower air
volume and lower revenue from travel insurance and hosting. Hotel net revenue, including hotels booked on
a standalone basis and as part of a vacation package, represented 38 percent of the company's total net
revenue for the trailing twelve months ended June 30, 2012, up from 36 percent for the trailing twelve
months ended June 30, 2011.
Three Months Ended Six Months Ended
June 30, June 30,
(in thousands) 2012 2011 Change 2012 2011 Change
Net Revenue
Standalone Air $67,313 $69,522 (3)% $139,557 $142,022 (2)%
Standalone Hotel 55,895 55,196 1% 105,360 100,385 5%
Vacation Package 36,388 33,479 9% 66,642 59,337 12 %
Advertising and Media 15,261 13,632 12 % 26,730 26,314 2%
Other 26,120 29,997 (13)% 52,467 58,691 (11)%
Total Net Revenue $200,977 $201,826 —% $390,756 $386,749 1%
Domestic $145,073 $142,026 2% $282,416 $276,359 2%
International 55,904 59,800 (7)% 108,340 110,390 (2)%
Total Net Revenue $200,977 $201,826 —% $390,756 $386,749 1%
Standalone air net revenue was $67.3 million in the second quarter 2012, down three percent year
over year. This decline was driven primarily by lower domestic air volume, partially offset by higher
net revenue per airline ticket and higher air volume at ebookers.
Standalone hotel net revenue was $55.9 million in the second quarter 2012, up one percent year over
year. This increase was driven primarily by higher hotel volume for the company's domestic leisure
business and ebookers, partially offset by lower volume at HotelClub.
• Vacation package net revenue increased nine percent in the quarter to $36.4 million due primarily to
higher volume for both the company's domestic leisure business and ebookers.
Advertising and media revenue increased 12 percent year over year in the second quarter to $15.3
million.
Other net revenue, which is comprised primarily of car rental, cruise, destination services, travel
insurance and airline hosting revenue, declined 13 percent year over year. This decline was driven
primarily by a new Department of Transportation regulation that went into effect January 2012, which
no longer allows travel insurance to be pre-selected on the company's domestic websites. This
change reduced travel insurance attachment rates. The termination of the company's remaining
airline hosting agreement in July 2011 also contributed to the decline.
In order to provide a more comparable view of the company's operating performance across periods,
Appendix A to this press release adjusts gross bookings and net revenue for currency impacts. The company
has also included a schedule of trended operating metrics in Appendix B to this press release.
2
3. Operating Expenses
Cost of revenue
Cost of revenue is comprised primarily of costs to operate customer service call centers, credit card
processing fees and other costs, which include customer refunds and charge-backs, hosting costs and
connectivity and other processing costs.
Three Months Ended
June 30, $ %
2012 2011 Change Change
(in thousands)
Customer service costs $14,011 $13,683 $328 2%
Credit card processing fees 11,413 11,964 (551) (5)%
Other 9,961 9,849 112 1%
Total cost of revenue $35,385 $35,496 $(111) —%
Cost of revenue for the second quarter 2012 was relatively flat year over year.
Selling, general and administrative (SG&A) expense
SG&A expense is comprised primarily of wages and benefits, contract labor costs, network communications,
systems maintenance and equipment costs and other costs, which include legal, foreign currency transaction
and hedging costs and other administrative costs.
Three Months Ended
June 30, $ %
2012 2011 Change Change
(in thousands)
Wages and benefits $37,522 $39,153 $(1,631) (4)%
Contract labor 6,223 6,650 (427) (6)%
Network communications, systems maintenance
and equipment 6,653 6,010 643 11 %
Other 16,914 16,079 835 5%
Total SG&A $67,312 $67,892 $(580) (1)%
SG&A expense for the second quarter 2012 decreased one percent year over year. Wages and benefits and
contract labor costs declined due primarily to cost savings achieved from the centralization of the ebookers
finance function and the absence of related severance costs incurred in the second quarter 2011. These
savings were offset by costs incurred to support the American Express partnership launch later this year,
higher network communication costs and higher legal fees.
Marketing expense
Marketing expense is comprised primarily of online marketing costs, such as search and banner advertising
and affiliate commissions, and offline marketing costs, such as television, radio and print advertising.
Three Months Ended
June 30, $ %
2012 2011 Change Change
(in thousands)
Marketing expense $69,136 $63,159 $5,977 9%
3
4. Marketing expense was up 9 percent year over year in the second quarter 2012. This increase was driven
primarily by higher global online marketing spend and the growth of the company's private label distribution
channel.
Interest Expense
Net interest expense was $9.3 million in the second quarter 2012, a five percent decline year over year. This
decline was due primarily to a lower effective interest rate and lower outstanding borrowings on the
company's term loan, partially offset by higher letter of credit fees.
At June 30, 2012, $100.0 million of the $440.0 million outstanding on the term loan had a fixed interest rate
of 3.68 percent through an interest rate swap. The weighted-average effective interest rate on the term loan
was 3.34 percent at June 30, 2012, down from 3.63 percent at June 30, 2011. At June 30, 2012, Orbitz
Worldwide was in compliance with all financial covenants in its Credit Agreement.
Cash Flow
Operating cash flow was $104.1 million for the six months ended June 30, 2012, a two percent increase year
over year. The increase in operating cash flow was due mainly to the net change in the company's working
capital accounts, in particular an increase in accrued merchant payables, partially offset by the timing of
payments received from Travelport.
At June 30, 2012, cash and cash equivalents were $170.4 million, up 25 percent from $136.2 million at
December 31, 2011.
Operational Highlights
Consumer Brands
• Orbitz Worldwide continued to invest in mobile commerce through new product offerings and
enhancements to its existing mobile products:
In June 2012, Orbitz.com re-launched the popular Orbitz Flights, Hotels, Cars for iPhone app,
adding major speed improvements, powerful sort and filtering capabilities and new mapping tools
that better highlight exclusive, mobile-only hotel discounts. The completely rebuilt Orbitz app is
the only fully native, streamlined in-app search and book experience for flights, hotel rooms and
car rentals. A consumer usability study found the newly updated Orbitz Flights, Hotels, Cars for
iPhone app to be the fastest and easiest way to search and book an entire trip among leading
travel apps, mobile websites and desktop sites tested. From June 21st to June 27th, Apple
featured this highly rated app as an Editors' Choice selection in the App Store.
Orbitz Worldwide released the first Android app for its ebookers, HotelClub, RatesToGo and
CheapTickets brands. In addition, the company launched a completely redesigned Orbitz Android
app powered by the global platform. All Orbitz Worldwide consumer brands now have apps for the
important Android platform, providing a great way to attract new customers as well as increase
loyalty among existing Android customers.
• In May 2012, Orbitz.com launched a new ad campaign to spark a movement among Americans to "Take
Vacation Back." Orbitz.com also introduced a refreshed website that brings to life the tenets of the new
campaign through a more colorful and vibrant look and feel. The site debuted an enhanced Orbitz.com
logo with a rich color palate, plus a sleek, fresh and lively design that draws users in and puts the most
useful travel tools and content front and center for consumers.
Partner Services
• During the second quarter 2012, Orbitz Worldwide signed new multi-year agreements with Fairmont
Hotels & Resorts and the Louvre Hotels Group, including the Golden Tulip Group, as well as partnership
4
5. agreements with a number of regional hotel groups including Accor's Adagio brand hotels in Europe,
Paramount Hotels in the United Kingdom, Servi Group and Protur in Spain and Tauzia Hotel
Management in Indonesia, among others. At June 30, 2012, Orbitz Worldwide websites featured over
100,000 bookable hotel properties.
• During the second quarter 2012, Orbitz Worldwide signed new distribution agreements with Hong Kong
Airlines, Malaysia Airlines, Emirates and Aerolineas Argentinas, among others, giving Orbitz.com,
CheapTickets and Orbitz for Business customers access to their fares, schedules and inventory.
• During the second quarter 2012, ebookers launched its partnership with travel content aggregator
Travelfusion, providing ebookers.com access to additional low cost carrier content.
• During the second quarter 2012, Orbitz Worldwide signed partner marketing contracts with a number of
destination marketing organizations including The Outer Banks Tourism, Visit Denver, Corpus Christi
Convention and Visitors Bureau, Bermuda Tourism, Edmonton Tourism, Memphis Convention and
Visitors Bureau, New York State Tourism, Greater Miami Convention and Visitors Bureau, Puerto Rico
Tourism Company, Tourism Queensland, Visit Baltimore and Arkansas Tourism.
Outlook
For the third quarter 2012, the company expects:
• Net revenue in the range of $197 million to $203 million; and
• Adjusted EBITDA between $32 million and $38 million.
For the full year 2012, the company expects:
• Net revenue up between two percent and four percent year over year; and
• Adjusted EBITDA between flat and up five percent year over year.
This update to our outlook reflects the deterioration in economic conditions in Europe, weaker air volume in
the U.S. online travel company channel and foreign exchange headwinds. This outlook assumes foreign
exchange rates as of July 31, 2012.
Quarterly Conference Call
Orbitz Worldwide will host a conference call to discuss its second quarter 2012 results at 10:00 a.m. EDT
(9:00 a.m. CDT) on Wednesday, August 8, 2012. A live webcast of the conference call can be accessed
through the Orbitz Worldwide Investor Relations website at investors.orbitz.com. An archive of the webcast
and a transcript will also be available on the website for at least 30 days.
About Orbitz Worldwide
Orbitz Worldwide is a leading global online travel company that uses innovative technology to enable leisure
and business travelers to research, plan and book a broad range of travel products. Orbitz Worldwide owns
a portfolio of consumer brands that includes Orbitz (www.orbitz.com), CheapTickets
(www.cheaptickets.com), ebookers (www.ebookers.com), HotelClub (www.hotelclub.com), RatesToGo
(www.ratestogo.com) and the Away Network (www.away.com). Also within the Orbitz Worldwide family,
Orbitz Worldwide Distribution (corp.orbitz.com/partnerships/distribution) delivers private label travel solutions
to a broad range of partners including many of the world's largest airlines, and Orbitz for Business
(www.orbitzforbusiness.com) delivers managed corporate travel solutions for corporations. For more
information on partnership opportunities with Orbitz Worldwide, visit corp.orbitz.com.
Orbitz Worldwide uses its Investor Relations website to make information available to its investors and the
public at investors.orbitz.com. You can sign up to receive email alerts whenever the company posts new
information to the website.
5
6. Forward-Looking Statements
This press release and its attachments may contain forward-looking statements that involve risks,
uncertainties and other factors concerning, among other things, the company's expected financial
performance and its strategic operational plans. The results presented are unaudited. The company's actual
results could differ materially from the results expressed or implied by such forward-looking statements and
reported results should not be considered as an indication of future performance. The potential risks,
uncertainties and other factors that could cause actual results to differ from those expressed by the forward-
looking statements in this press release and its attachments include, but are not limited to, competition in the
travel industry; factors affecting the level of travel activity, particularly air travel volume; the termination of any
major supplier's participation on the company's websites; the company's ability to renegotiate supplier
agreements on acceptable terms; maintenance and protection of the company's information technology and
intellectual property; the outcome of pending litigation; the company's level of indebtedness; risks associated
with doing business in multiple currencies; trends in the travel industry; and general economic and business
conditions. More information regarding these and other risks, uncertainties and factors is contained in the
section entitled "Risk Factors" in the company's filings with the Securities and Exchange Commission
("SEC") which are available on the SEC's website at www.sec.gov or the company's Investor Relations
website at investors.orbitz.com. You are cautioned not to unduly rely on these forward-looking statements,
which speak only as of the date of this press release. All information in this press release and its attachments
is as of August 8, 2012, and Orbitz Worldwide undertakes no obligation to publicly revise any forward-looking
statement.
About Non-GAAP Financial Measures
This press release and its attachments include certain non-GAAP financial measures as defined by the SEC.
These measures may be different from non-GAAP measures used by other companies. The presentation of
this financial information is not intended to be considered in isolation or as a substitute for the financial
information prepared and presented in accordance with U.S. generally accepted accounting principles
(GAAP). Further information regarding the non-GAAP financial measures included in this press release is
contained in Appendix A attached to this press release.
Media Contact: Investor Contact:
Chris Chiames Melissa Hayes
+1 312 894 6890 +1 312 260 2428
chris.chiames@orbitz.com melissa.hayes@orbitz.com
6
7. Orbitz Worldwide, Inc.
Condensed Consolidated Statements of Operations (Unaudited)
(in thousands, except share and per share data)
Three Months Ended June 30, Six Months Ended June 30,
2012 2011 2012 2011
Net revenue $200,977 $201,826 $390,756 $386,749
Cost and expenses
Cost of revenue 35,385 35,496 71,501 71,811
Selling, general and administrative 67,312 67,892 137,625 136,501
Marketing 69,136 63,159 134,664 128,516
Depreciation and amortization 14,272 15,442 28,150 30,716
Total operating expenses 186,105 181,989 371,940 367,544
Operating income 14,872 19,837 18,816 19,205
Other income (expense)
Net interest expense (9,284) (9,741) (19,239) (20,306)
Other income (expense) — (22) (44) 368
Total other expense (9,284) (9,763) (19,283) (19,938)
Income (loss) before income taxes 5,588 10,074 (467) (733)
Provision for income taxes 1,004 1,186 1,460 1,272
Net income (loss) $4,584 $8,888 $(1,927) $(2,005)
Net income (loss) per share - basic
Net income (loss) per share $0.04 $0.09 $(0.02) $(0.02)
Weighted-average shares outstanding 105,150,691 103,717,099 104,981,607 103,526,844
Net income (loss) per share - diluted
Net income (loss) per share $0.04 $0.08 $(0.02) $(0.02)
Weighted-average shares outstanding 107,434,031 105,129,716 104,981,607 103,526,844
7
8. Orbitz Worldwide, Inc.
Condensed Consolidated Balance Sheets (Unaudited)
(in thousands, except share data)
June 30, 2012 December 31, 2011
Assets
Current assets:
Cash and cash equivalents $170,436 $136,171
Accounts receivable (net of allowance for doubtful accounts of $1,588
and $1,108, respectively) 80,008 62,377
Prepaid expenses 13,315 15,917
Due from Travelport, net 17,165 3,898
Other current assets 5,490 2,402
Total current assets 286,414 220,765
Property and equipment, net 138,494 141,702
Goodwill 647,300 647,300
Trademarks and trade names 108,232 108,194
Other intangible assets, net 3,303 4,162
Deferred income taxes, non-current 6,346 7,311
Other non-current assets 16,391 16,352
Total Assets $1,206,480 $1,145,786
Liabilities and Shareholders' Equity
Current liabilities:
Accounts payable $20,438 $30,937
Accrued merchant payable 310,638 238,694
Accrued expenses 125,014 120,962
Deferred income 45,058 28,953
Term loan, current 25,800 32,183
Other current liabilities 11,839 2,034
Total current liabilities 538,787 453,763
Term loan, non-current 414,230 440,030
Tax sharing liability 70,822 68,411
Unfavorable contracts 2,220 4,440
Other non-current liabilities 19,878 18,617
Total Liabilities 1,045,937 985,261
Commitments and contingencies
Shareholders' Equity:
Preferred stock, $0.01 par value, 100 shares authorized, no shares
issued or outstanding — —
Common stock, $0.01 par value, 140,000,000 shares authorized,
104,768,061 and 103,814,769 shares issued, respectively 1,047 1,038
Treasury stock, at cost, 25,237 shares held (52) (52)
Additional paid-in capital 1,038,961 1,036,093
Accumulated deficit (882,813) (880,886)
Accumulated other comprehensive income (net of
accumulated tax benefit of $2,558) 3,400 4,332
Total Shareholders' Equity 160,543 160,525
Total Liabilities and Shareholders' Equity $1,206,480 $1,145,786
8
9. Orbitz Worldwide, Inc.
Condensed Consolidated Statements of Cash Flows (Unaudited)
(in thousands)
Six Months Ended June 30,
2012 2011
Operating activities:
Net loss $(1,927) $(2,005)
Adjustments to reconcile net loss to net cash provided by operating
activities:
Depreciation and amortization 28,150 30,716
Amortization of unfavorable contract liability (2,220) (940)
Non-cash net interest expense 7,490 7,177
Deferred income taxes 1,020 823
Stock compensation 4,292 4,927
Changes in assets and liabilities:
Accounts receivable (17,496) (14,918)
Deferred income 19,210 14,058
Due from Travelport, net (13,233) (33)
Accrued merchant payable 71,753 65,097
Accounts payable, accrued expenses and other current liabilities 16,790 4,732
Other (9,700) (7,105)
Net cash provided by operating activities 104,129 102,529
Investing activities:
Property and equipment additions (23,770) (23,464)
Changes in restricted cash (650) (4,538)
Net cash used in investing activities (24,420) (28,002)
Financing activities:
Payments on the term loan (32,183) (19,808)
Employee tax withholdings related to net share settlements of
equity-based awards (1,414) (941)
Payments on tax sharing liability (10,864) (7,228)
Payments on note payable (114) (114)
Net cash used in financing activities (44,575) (28,091)
Effects of changes in exchange rates on cash and cash equivalents (869) 2,299
Net increase in cash and cash equivalents 34,265 48,735
Cash and cash equivalents at beginning of period 136,171 97,222
Cash and cash equivalents at end of period $170,436 $145,957
Supplemental disclosure of cash flow information:
Income tax payments, net $1,016 $1,154
Cash interest payments $15,446 $13,915
9
10. Appendix A: Non-GAAP Financial Measures
EBITDA and Adjusted EBITDA
EBITDA is a performance measure used by management that is defined as net income or net loss plus: net
interest expense, provision for income taxes and depreciation and amortization. Adjusted EBITDA represents
EBITDA as adjusted for certain non-cash and unusual or non-recurring items as described below. Orbitz
Worldwide uses and believes investors and other external users of the company's financial statements
benefit from the presentation of EBITDA and Adjusted EBITDA in evaluating its operating performance
because:
• These measures provide greater insight into management decision making at Orbitz Worldwide as
they are among the primary metrics by which management evaluates the operating performance of
the company's business. Management believes that when viewed with GAAP results and the
accompanying reconciliation, EBITDA and Adjusted EBITDA provide additional information that is
useful for management and other external users to gain an understanding of the factors and trends
affecting the ongoing cash earnings capability of the company's business, from which capital
investments are made and debt is serviced. These supplemental measures are used by management
and the board of directors to evaluate the company's actual results against management's
expectations.
• EBITDA measures performance apart from items such as interest expense, income taxes and
depreciation and amortization. Management believes that the exclusion of interest expense is
necessary to evaluate the cash earnings capability of the business. The company generally only
funds working capital requirements with borrowed funds (specifically, funds borrowed under its
revolving credit facility), if at all, in the fourth quarter of the year when its cash balances are typically
the lowest. As a result, nearly all of the company's interest expense is not incurred to fund its
operating activities. In addition, excluding interest expense from the company's non-GAAP measures
is consistent with the company's intent to disclose the ongoing cash earnings capability of the
business, from which capital investments are made and debt is serviced. Management believes that
the exclusion of non-cash depreciation and amortization is also necessary to evaluate the cash
earnings capability of the business. Management believes that the review of its non-GAAP measures
in conjunction with other GAAP metrics, such as capital expenditures, is more useful in understanding
the company's business than the inclusion of depreciation and amortization expense in the non-
GAAP measures used by management, since depreciation and amortization expense has historically
fluctuated as a result of purchase accounting and this expense involves management judgment (e.g.
estimated useful lives).
• Adjusted EBITDA corresponds more closely to the ongoing cash earnings capability of the company's
business, by excluding the items described above and items such as litigation settlements that are
not driven by core operating results, certain other non-cash items, such as goodwill and intangible
asset impairment charges and stock-based compensation, and other unusual and non-recurring
items, such as restructuring charges.
EBITDA and Adjusted EBITDA, as presented for the three and six months ended June 30, 2012 and 2011,
are not defined under GAAP and do not purport to be an alternative to net loss as a measure of operating
performance. EBITDA and Adjusted EBITDA have certain limitations in that they do not take into account the
impact of certain expenses to the company's income statement, such as stock-based compensation,
goodwill and intangible asset impairment charges and certain one-time items, if applicable. Because not all
companies use identical calculations, this presentation of EBITDA and Adjusted EBITDA may not be
comparable to other similarly-titled measures used by other companies.
10
11. The following table provides a reconciliation of net loss to EBITDA:
Three Months Ended Six Months Ended
June 30, June 30,
2012 2011 2012 2011
(in thousands)
Net income (loss) $4,584 $8,888 $(1,927) $(2,005)
Net interest expense 9,284 9,741 19,239 20,306
Provision for income taxes 1,004 1,186 1,460 1,272
Depreciation and amortization 14,272 15,442 28,150 30,716
EBITDA $29,144 $35,257 $46,922 $50,289
EBITDA was adjusted by the items listed and described in more detail below. The following table provides a
reconciliation of EBITDA to Adjusted EBITDA:
Three Months Ended Six Months Ended
June 30, June 30,
2012 2011 2012 2011
(in thousands) (in thousands)
EBITDA $29,144 $35,257 $46,922 $50,289
Stock-based compensation expense (a) 2,576 2,950 4,292 4,927
Acceleration of amortization of net unfavorable
contract liability (b) — 542 — 780
Litigation settlements and other (c) 425 — 1,490 20
Adjusted EBITDA $32,145 $38,749 $52,704 $56,016
(a) Represents non-cash stock compensation expense.
(b) Represents a non-cash charge recorded to accelerate the amortization of the in-kind marketing and
promotional support asset from Continental Airlines under its Charter Associate Agreement with the
company. The useful life of this asset was shortened in 2010 following the merger of Continental Airlines
and United Airlines.
(c) Represents charges related to certain legal proceedings and other non-recurring professional fees.
11
12. Gross Bookings and Net Revenue, at Constant Currency
The company's reporting currency is the U.S. dollar. As a result, reported financial results are impacted by
the strength or weakness of the U.S. dollar relative to the currencies of the international markets in which the
company operates, particularly the Pound sterling, Euro, Swiss franc and Australian dollar. Management
evaluates the company's operating performance with and without the impact of changes in foreign exchange
rates because it believes excluding the impact of foreign exchange rates provides a more comparable view
of the company's operating performance across periods. Management believes that when viewed with GAAP
results and the accompanying reconciliation, management and other external users are better able to gain
an understanding of the factors and trends affecting operating performance. The following table adjusts
gross bookings and net revenue for foreign currency impacts across the relevant periods:
Three Months Ended
Total
(in thousands) Domestic International Orbitz Worldwide
Gross Bookings
Q2, 2012 Reported Gross Bookings $2,399,412 $570,777 $2,970,189
Q2, 2011 Reported Gross Bookings 2,414,061 583,146 2,997,207
Impact of Foreign Exchange Rates — (43,804) (43,804)
Q2, 2011 Gross Bookings at Constant Currency $2,414,061 $539,342 $2,953,403
Reported Gross Bookings Growth (1)% (2)% (1)%
Gross Bookings Growth at Constant Currency (1)% 6% 1%
Net Revenue
Q2, 2012 Reported Net Revenue $145,073 $55,904 $200,977
Q2, 2011 Reported Net Revenue 142,026 59,800 201,826
Impact of Foreign Exchange Rates — (4,283) (4,283)
Q2, 2011 Net Revenue at Constant Currency $142,026 $55,517 $197,543
Reported Net Revenue Growth 2% (7)% —%
Net Revenue Growth at Constant Currency 2% 1% 2%
12
13. Six Months Ended
Total
(in thousands) Domestic International Orbitz Worldwide
Gross Bookings
Q2, 2012 Reported Gross Bookings $4,891,976 $1,221,244 $6,113,220
Q2, 2011 Reported Gross Bookings 4,790,665 1,181,692 5,972,357
Impact of Foreign Exchange Rates — (51,572) (51,572)
Q2, 2011 Gross Bookings at Constant Currency $4,790,665 $1,130,120 $5,920,785
Reported Gross Bookings Growth 2% 3% 2%
Gross Bookings Growth at Constant Currency 2% 8% 3%
Net Revenue
Q2, 2012 Reported Net Revenue $282,416 $108,340 $390,756
Q2, 2011 Reported Net Revenue 276,359 110,390 386,749
Impact of Foreign Exchange Rates — (4,482) (4,482)
Q2, 2011 Net Revenue at Constant Currency $276,359 $105,908 $382,267
Reported Net Revenue Growth 2% (2)% 1%
Net Revenue Growth at Constant Currency 2% 2% 2%
13