Global Mobile and M-Commerce Trends 2011
•
3 gostaram•3,726 visualizações

This document provides a summary of global mobile and m-commerce trends in 2011. It covers mobile and m-commerce trends for 42 countries worldwide. Some key findings are that m-commerce sales in the US are expected to increase tenfold between 2010 and 2014, and that in Germany over 20% of smartphone owners used their phone frequently for product information in 2010. The document also provides country-specific mobile and m-commerce statistics and trends for regions including North America, Latin America, and Europe.

Recomendados
Recomendados
Mais conteúdo relacionado
Mais procurados
Mais procurados (11)
Semelhante a Global Mobile and M-Commerce Trends 2011
Semelhante a Global Mobile and M-Commerce Trends 2011 (20)
Mais de yStats.com
Mais de yStats.com (20)
Último
Último (20)
Global Mobile and M-Commerce Trends 2011
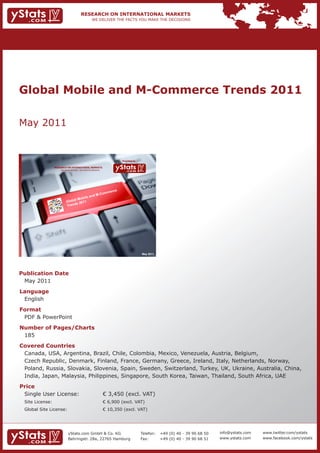
- 1. Global Mobile and M-Commerce Trends 2011 May 2011 Provided by RESEARCH ON INTERNATIONAL MARKETS We deliver the facts – you make the decisions e merc -Com and M al M obile Glob 1 s 201 Trend May 2011 Publication Date May 2011 Language English Format PDF & PowerPoint Number of Pages/Charts 185 Covered Countries Canada, USA, Argentina, Brazil, Chile, Colombia, Mexico, Venezuela, Austria, Belgium, Czech Republic, Denmark, Finland, France, Germany, Greece, Ireland, Italy, Netherlands, Norway, Poland, Russia, Slovakia, Slovenia, Spain, Sweden, Switzerland, Turkey, UK, Ukraine, Australia, China, India, Japan, Malaysia, Philippines, Singapore, South Korea, Taiwan, Thailand, South Africa, UAE Price Single User License: € 3,450 (excl. VAT) Site License: € 6,900 (excl. VAT) Global Site License: € 10,350 (excl. VAT) yStats.com GmbH & Co. KG Telefon: +49 (0) 40 - 39 90 68 50 info@ystats.com www.twitter.com/ystats Behringstr. 28a, 22765 Hamburg Fax: +49 (0) 40 - 39 90 68 51 www.ystats.com www.facebook.com/ystats
- 2. Global Mobile and M-Commerce Trends 2011 Key Findings Covering Mobile and M-Commerce Trends for 42 Countries worldwide • In the US, M-Commerce sales are expected to increase tenfold between 2010 and 2014. Furthermore, the number of mobile Internet users is expected to reach more than 100 million in 2011, approximately one third of the total population. • In Germany, M-Commerce is also predicted to boom. More than 20% of smartphone owners used their phone frequently for product information in 2010. • M-Commerce sales in the UK are expected to more than double in the next three years. In 2009, 2% of the British population used their mobile to shop online, while approximately one third had Internet on their mobile device. • In France, nearly 10% of consumers used M-Commerce in 2010. Moreover, one fourth of mobile Internet users have purchased a product with their mobile phone online in the first half of 2010. • In December 2010, nearly 10% of the total mobile audience in Japan accessed Retail Sites with their mobile phones. Company and Product Information About our Reports Market reports by yStats.com inform top managers about recent market trends and assist with strategic company decisions A list of advantages • yStats.com provides secondary market research: By using various sources of information we ensure maximum objectivity for all obtained data. As a result companies get a precise and unbiased impression of the market situation. • The analyses, statistical reports and forecasts are only based on reliable sources including national and international statistical offices, industry and trade associations, business reports, business and company databases, journals, company registries and news portals. • Our international employees research and filter all sources and translate relevant information into English. This ensures that the content of the original studies is correctly interpreted. • yStats.com delivers all research results as PowerPoint files. All data can therefore be used directly for board presentations or be individually adapted. • If required, yStats.com provides in-depth analysis for all research projects. Simply send us a request. About yStats.com • yStats.com has been committed to research up-to-date, objective and demand-based data on markets and competitors from various industries since 2005. • Headquartered in Hamburg, Germany, the firm has a strong international focus and is specialized in secondary market research. • In addition to reports on markets and competitors, yStats.com also carries out client-specific research. • Clients include leading global enterprises from various industries including B2C E-Commerce, electronic payment systems, mail order and direct marketing, logistics as well as banking and consulting. yStats.com GmbH & Co. KG Telefon: +49 (0) 40 - 39 90 68 50 info@ystats.com www.twitter.com/ystats Behringstr. 28a, 22765 Hamburg Fax: +49 (0) 40 - 39 90 68 51 www.ystats.com www.facebook.com/ystats
- 3. Global Mobile and M-Commerce Trends 2011 Table of Contents (1 of 5) 1. GLOBAL 2. NORTH AMERICA (cont.) • M-Commerce Forecast for US and Europe, by USA (Top Country) (cont.) Product Category, in %, 2011f • M-Commerce Forecast for US and Europe, by • Share of People who use M-Commerce, by Age Age Group, in %, 2011 Group, in %, 2009 • Mobile Payment Transaction Volume worldwide, • Top 10 Mobile Categories accessed via in USD billion, 2010 & 2014f Applications, by total Audience, in thousands and Growth vs. April 2009, in %, April 2010 • Share of People who have used the Mobile Phone in the last 6 Months to make a Purchase, Asia vs. • Fastest growing Mobile Categories by total US & Europe, in %, 2010 Audience Growth in %, December 2010 vs. December 2009 • Share of People who have ever used the Mobile Phone for certain Activities, Asia vs. US & Europe, • Purchased Products by US Mobile Users, in %, in %, 2010 2009 & 2010 • Number of Smartphones in Circulation, in • Products purchased via Mobile, in %, in the 12 thousand, 2010 including the US, EU5, Italy, UK, Months to February 2011 Germany, Spain & France • Products purchased via Mobile by Age, in %, in • Mobile Broadband Users and Penetration, in the 6 Months to February 2011 millions and %, in the Top 5 Countries, by mobile Broadband Subscribers, Q2 2010 • Products purchased via Mobile by Gender, in %, in the 6 Months to February 2011 • Top Mobile Shopping Trends, 2010 • Average Weekly Time spent on Mobile Shopping • M-Commerce Sales of eBay, in USD billion, Websites and Mobile Shopping Apps, in %, 2010 2009 & 2010 • Average Spend on Consumer Goods purchased via Mobile Devices, in %, in the 12 Months to February 2011 • Frequency of Mobile Purchases, in %, in the 12 2. NORTH AMERICA Months to February 2011 • Features considered most important when Canada purchasing Products on Mobile Website or App, in %, February 2011 • General M-Commerce Trends, 2010 • Mobile Web Audience by Age, in %, July 2009 • Most purchased Product Categories by Mobile • Share of Consumers who favor Mobile Payment Shoppers, in %, 2010 over traditional Payment Forms, in %, 2010 • Amount that Smartphone Owners are willing to spend on Products bought via M-Commerce, by USA (Top Country) Phone Type, in %, Q3 2009 • Shopping-related Smartphone Activities of US • M-Commerce Sales, in USD billion, 2009-2015f Smartphone Owners, in %, Q3 2009 • M-Commerce Trends, 2011 • Mobile Phone Behavior, Users of certain Features • M-Commerce Opportunities for Retailers, 2010 as % of total Mobile Audience, Oct.-Dec. 2010 • M-Commerce Features used by Multichannel • Smartphone Penetration, in % of all Mobile Retailers, in %, February 2010 Subscribers, Q4 2009-Q3 2010 • Top Mobile Activities by % Share of total Mobile • Mobile Social Network Users, in millions and Users, 3 Months prior to December 2010 Growth in %, 2009-2015f • Development of Mobile Internet Users (million) • M-Commerce Sales Information for Steve Madden, and their Percentage of Country Population, eBay and Marriott Hotels, 2010 2008-2014f • Mobile Payment Activities of Visa, 2011 • M-Commerce Usage by affluent Customers, by • M-Commerce Activities of Expedia, 2011 Frequency in %, March 2010 • M-Commerce Activities of Foot Locker, 2011 yStats.com GmbH & Co. KG Telefon: +49 (0) 40 - 39 90 68 50 info@ystats.com www.twitter.com/ystats Behringstr. 28a, 22765 Hamburg Fax: +49 (0) 40 - 39 90 68 51 www.ystats.com www.facebook.com/ystats
- 4. Global Mobile and M-Commerce Trends 2011 Table of Contents (2 of 5) 3. LATIN AMERICA 4. EUROPE Regional Regional • Mobile Phone Penetration and Mobile Broadband • Top Mobile Activities by % Share of total Mobile Penetration for 18 Latin American Countries, in %, Users in the EU5, October-December 2010 2009 • Fastest growing Mobile Categories in the EU5, by • Number of Mobile Phone Users, in millions, and total Audience Growth in %, December 2010 vs. Penetration in %, 2009-2015f December 2009 • Mobile Phone User Penetration by Country, in %, • Mobile Phone Behavior, Users of certain Features 2009-2015f as % of total Mobile Audience, December 2010 • Share of Consumers who favor Mobile Payment over traditional Payment Forms, in %, 2010 Argentina • Penetration of Mobile Phone Owners, Penetration Rate for Mobile Media Usage among Mobile Phone • Mobile Phone Penetration and Mobile Broadband Users, UK vs. France, Spain and Poland, in %, Penetration, in %, 2009 2010 • Mobile Internet Users by Country, in % of Population, 2006-2010 Brazil • Mobile Internet Users in the EU5 (France, Germany, Italy, Spain & UK), in million, and Penetration in %, 2009-2015f • Share of Consumers who favor Mobile Payment over traditional Payment Forms, in %, 2010 Austria Chile • Smartphone Penetration, in %, 2010 & 2015f • Mobile Phone Penetration and Mobile Broadband Penetration, in %, 2009 • Mobile Internet Users, in % of the Population, 2006-2010 Colombia • Mobile Phone Penetration and Mobile Broadband Belgium Penetration, in %, 2009 • Mobile Internet Users, in % of the Population, 2006-2010 • Internet Usage via mobile Phones, by Age Groups, Mexico in %, 2010 • Mobile Phone Penetration and Mobile Broadband Penetration, in %, 2009 Czech Republic Venezuela • Internet Usage via mobile Phones, by Age Groups, in %, 2010 • Mobile Phone Penetration and Mobile Broadband Penetration, in %, 2009 yStats.com GmbH & Co. KG Telefon: +49 (0) 40 - 39 90 68 50 info@ystats.com www.twitter.com/ystats Behringstr. 28a, 22765 Hamburg Fax: +49 (0) 40 - 39 90 68 51 www.ystats.com www.facebook.com/ystats
- 5. Global Mobile and M-Commerce Trends 2011 Table of Contents (3 of 5) 4. EUROPE (cont.) 4. EUROPE (cont.) Denmark Greece • Share of Online Shoppers who made a Purchase • Mobile Internet Users, in % of the Population, through their Mobile Phones; Denmark vs. Nordic 2007-2010 Region Average, in %, 2009 • Internet Usage via mobile Phones, by Age Groups, • Share of Online Shoppers who consider purchasing in %, 2010 Products via Mobile Phones; Denmark vs. Nordic Region Average, in %, 2009 Ireland • Reasons for not using Mobile Phones for Internet Shopping, in %, 2009 • Internet Usage via mobile Phones, by Age Groups, in %, 2010 Finland Italy • Share of Online Shoppers who made a Purchase through their Mobile Phones; Finland vs. Nordic Region Average, in %, 2009 • General M-Commerce Trends, 2010 • Share of Online Shoppers who consider purchasing • Mobile Activities of Online Shops, in %, 2010 Products via Mobile Phones; Finland vs. Nordic Region Average, in %, 2009 Netherlands • Reasons for not using Mobile Phones for Internet Shopping, in %, 2009 • Experience of Consumers with M-Commerce, in %, 2009 France (Top Country) • Type of Products Consumers are prepared to buy with their Mobile Phones, in %, 2009 • Share of Consumers who use M-Commerce, in %, April 2010 • Things Retailers could do to make it more likely for Consumers to shop with their Mobile Phone, • Share of Mobile Internet Users who purchased a in %, 2009 Product with their Mobile Phone, in %, in the 6 Months to May 2010 • Mobile Internet Users, in % of the Population, 2006-2010 • Most purchased Product Categories by Mobile Shoppers, in %, 2010 • Experience of Consumers with M-Commerce, in %, Norway 2009 • Share of Online Shoppers who made a Purchase • Type of Products Consumers are prepared to buy through their Mobile Phones; Norway vs. Nordic with their Mobile Phones, in %, 2009 Region Average, in %, 2009 • Things Retailers could do to make it more likely for • Share of Online Shoppers who consider purchasing Consumers to shop with Mobile Phone, in %, 2009 Products via Mobile Phones; Norway vs. Nordic Region Average, in %, 2009 Germany (Top Country) • Reasons for not using Mobile Phones for Internet Shopping, in %, 2009 • M-Commerce Sales Outlook, in EUR billion, 2014f • Internet and Mobile Broadband Access by Household Type, Household Income, Gender, Age • Share of Consumers who use M-Commerce, in %, and Employment Situation, in %, Q2 2010 April 2010 • Most purchased Product Categories by Mobile Shoppers, in %, 2010 Poland • Frequently used M-Commerce Features, by Smartphone Users in %, 2010 • Mobile Internet Users, in % of the Population, 2007-2010 • Breakdown of Online Shops, by Mobile Sites, in %, 2010 • Internet Usage via mobile Phones, by Age Groups, in %, 2010 • Internet Use by Cell Phone, including Transactions (e.g. Online Shopping), Functions, Editorial • Penetration of Mobile Phone Owners, Penetration Content, Social Media, in millions, 2010 Rate for Mobile Media Usage among Mobile Phone Users, in %, 2010 yStats.com GmbH & Co. KG Telefon: +49 (0) 40 - 39 90 68 50 info@ystats.com www.twitter.com/ystats Behringstr. 28a, 22765 Hamburg Fax: +49 (0) 40 - 39 90 68 51 www.ystats.com www.facebook.com/ystats
- 6. Global Mobile and M-Commerce Trends 2011 Table of Contents (4 of 5) 4. EUROPE (cont.) 4. EUROPE (cont.) Russia UK (Top Country) • Mobile Internet Key Trends, 2010 • M-Commerce Sales, 2009 & 2013f • M-Commerce Trends, 2010 Slovakia • Share of Consumers who use M-Commerce, in %, April 2010 • Internet Usage via mobile Phones, by Age Groups, • Share of Population with Internet on their Mobile in %, 2010 Phone, and Share of the Population who shopped on their Mobile, 2009 • Share of Smartphone Users who purchase Goods Slovenia with Applications, in %, and average Spending in GBP, April 2011 • Mobile Internet Users, in % of the Population, • Share of Online Buyers who shop via Mobile Phone, 2006-2010 at Home, on the Go, at Work and from a Friend’s • Internet Usage via mobile Phones, by Age Groups, House, in %, April 2011 in %, 2010 • Share of Smartphone Users who have ever bought Items with their Mobile, and Share of Smartphone Owners who expect to do so in the Spain next 12 Months, in %, April 2011 • Wireless Internet Users, by Type of Device and • Purchases / Downloads from Mobile Devices in %, Gender, in %, 2010 2009 • Top Mobile Sites by total Minutes spent, in millions, • Mobile Internet Users by Age and by Gender, in %, December 2010 January 2010 • M-Commerce Products with the fastest expected Growth, in %, 2011f Sweden • Two most popular M-Commerce Categories, by monthly Spending in GBP, April 2011 • Share of Online Shoppers who made a Purchase • M-Commerce Activities of Mobile and Smartphone through their Mobile Phones; Sweden vs. Nordic Users, in %, May 2010 Region Average, in %, 2009 • Biggest Challenges for M-Commerce, in %, April • Share of Online Shoppers who consider purchasing 2011 Products via Mobile Phones; Sweden vs. Nordic • 10 strategic Business Aspects for M-Commerce Region Average, in %, 2009 Sites • Reasons for not using Mobile Phones for Internet • Retailers’ Opinion towards M-Commerce, 2011 Shopping, in %, 2009 • Mobile Payment Activities of Vodafone, 2011 • Mobile Broadband Trends, 2010 Switzerland Ukraine • Mobile Internet Usage Trends, 2010 • Mobile Internet Users, in % of Internet Users, • Mobile Internet Usage from Smartphones, by 2007-H1 2010 Frequency, in %, 2010 • Share of Mobile Internet Users who want to find Products and Services, and Share of Mobile Internet Users who want to read User Reviews, in %, 2010 Turkey 5. ASIA-PACIFIC • Internet Usage via mobile Phones, by Age Groups, in %, 2010 Regional • Share of Mobile Payments on total E-Commerce • Consumers who plan to use M-Commerce within 3 Transactions / most popular Payment Methods, in Months, in %, 2010 %, 2010 • Consumers who favor Mobile Payment over • Mobile Payment through NFC Technology, traditional Payment Forms, in %, 2010 2010/2011 yStats.com GmbH & Co. KG Telefon: +49 (0) 40 - 39 90 68 50 info@ystats.com www.twitter.com/ystats Behringstr. 28a, 22765 Hamburg Fax: +49 (0) 40 - 39 90 68 51 www.ystats.com www.facebook.com/ystats
- 7. Global Mobile and M-Commerce Trends 2011 Table of Contents (5 of 5) 5. ASIA-PACIFIC (cont.) 5. ASIA-PACIFIC (cont.) Australia Singapore • M-Commerce Trends; including Sales, in AUD • Number of Mobile Shoppers (thousands), Sales million, 2010 (SGD million) generated through M-Commerce, and Share of M-Commerce on E-Commerce • Top 10 Items bought using Mobile Devices, in AUD Sales, 2010 million, 2010 • Share of Online Shoppers who are willing to make • Top 10 Items Consumers intend to purchase if Purchases with their Mobile Phone, and Share of they are available for Purchase on Mobile, 2010 High-Income Shoppers who are interested in • 7 M-Commerce Case Studies, 2010 Mobile Shopping, in %, 2010 China South Korea • M-Commerce Trends; incl. Estimate for the Mobile • Economic Activities of Mobile Phone Internet Users, Online Shopping Market, in USD billion, 2010 in % of Mobile Phone Internet Users, 2010 • Activities of Mobile Internet Users, in %, June 2010 • Smartphone Activities of Online Retailers, 2010 • Usage of Mobile Internet Sites, by Category, in %, Q1 2010 Taiwan • Mobile Internet Usage Trends, 2010 • Mobile Internet Users, in % of Internet Users, • Mobile NFC Payment Trends, including Number of 2009-2010 Users, 2010 & 2011f • Trends about Google-branded Smartphones, 2011 India Thailand • Foundation Trends of M-Commerce, 2010 • M-Commerce News of eBay India, 2011 • Share of Respondents, in %, who made a Purchase with their Mobile Phone in the last 3 Months to Sep./Oct. 2010, and Share of Respondents, in %, Japan (Top Country) who plan to do so within the 6 Months from Sep./ Oct 2010 • Top Mobile Activities by % Share of total Mobile • Top 5 Mobile Shopping Items, in %, 2010 Users, December 2010 • Mobile Phone Behavior, Users of certain Features as % of total Mobile Audience, December 2010 6. OTHER COUNTRIES • Location of Mobile Wallet Purchase for Mobile Users, in millions, December 2010 South Africa • Mobile Commerce Share of Rakuten’s total E-Commerce Revenue, in %, Q2 2004-Q2 2009 • Share of Respondents who access the Internet with their Mobile Phone, in %, 2009-2010 Malaysia • Share of Respondents, in %, who made a Purchase with their Mobile Phone, Sep./Oct. 2010, and Share of Respondents, in %, who plan to do so • Number of Mobile Shoppers (thousands), Sales within the 6 Months from Sep./Oct 2010 (RM million) generated through M-Commerce, and Share of M-Commerce on E-Commerce Sales, 2010 • Main Activities of Mobile Shoppers, in %, 2010 UAE • Top 3 Barriers for Mobile Shopping, in %, 2010 • Share of Respondents, in %, who made a Purchase with their Mobile Phone in the last 3 Months to Philippines Sep./Oct. 2010, and Share of Respondents, in %, who plan to do so within the 6 Months from Sep./Oct 2010 • Information about Mobile Payment Gateway Gcash and its Products, 2010 • Share of Consumers who access the Internet with their Mobile Phones, in %, 2010 • Information about Mobile Payment Gateway Smart Money, 2010 • Top 3 Product Categories purchased via Mobile Phone, in %, 2010 yStats.com GmbH & Co. KG Telefon: +49 (0) 40 - 39 90 68 50 info@ystats.com www.twitter.com/ystats Behringstr. 28a, 22765 Hamburg Fax: +49 (0) 40 - 39 90 68 51 www.ystats.com www.facebook.com/ystats
- 8. Global Mobile and M-Commerce Trends 2011 Samples RESEARCH ON INTERNATIONAL MARKETS We deliver the facts – you make the decisions TNT Express agreed to acquire a 50% stake in French parcel delivery company Adrexo Colis to strengthen its position in B2C E-Commerce. France: E-Commerce Activities of TNT Express and Adrexo Colis, 2010 TNT Express agreed to acquire a 50 percent stake in French parcel delivery company Adrexo Colis in a bid to strengthen its position in the country's fast growing market for e-commerce and business-to-consumer deliveries. The deal, which requires regulatory approval, will allow Netherlands- based TNT Express and Spir Communication, Adrexo's parent, to speed up the development of standard home delivery services with 48-hour and 72-hour delivery guarantees across France. Adrexo Colis, which has 300 full time employees, delivered 22 million parcels and generated revenue of $70 million in 2009. TNT Express said its 450-strong French sales force will market the new Adrexo Colis delivery service across France, complementing its own express services in the country. TNT Express has 120 hubs and depots in France serving 620 scheduled trucking services and 14 daily air connections. TNT said the French e-commerce market for products and services was worth over $33 billion in 2009, an increase of 26 percent on 2008. The number of online stores grew 35 percent during the period to 64,100. Source: Journal of Commerce Online, December 2010 45 RESEARCH ON INTERNATIONAL MARKETS We deliver the facts – you make the decisions In 2010, ‘Door-to-Door delivery services’ were the most used delivery option in South Korean B2C E-Commerce with 92%. South Korea: Used Delivery Services of B2C E-Commerce Orders, in %, 2009-2010 2009 2010 Year-on-Year Change Total 100 100 - Self-run delivery 2.8 2.9 +0.1 Door-to-door 87.0 92.1 +5.1 delivery services Postal services 1.5 1.2 -0.3 Offline partnership 6.2 2.2 -4.0 Others 2.4 1.6 -0.8 Source: Statistics Korea, March 2011 73 yStats.com GmbH & Co. KG Telefon: +49 (0) 40 - 39 90 68 50 info@ystats.com www.twitter.com/ystats Behringstr. 28a, 22765 Hamburg Fax: +49 (0) 40 - 39 90 68 51 www.ystats.com www.facebook.com/ystats
- 9. Report Order Form REPORT ORDER FORM Place Your Order as Follows: Call us at + 49 40 39 90 68 50 Fax us at + 49 40 39 90 68 51 using the form below: Scan and Email us at inquiry@ystats.com using the form below: Place your order now: Please confirm the license type you require: Single User License Site License1 Global Site License2 Report Title Publication Date Price (€) An invoice will be sent to your company. Please complete your contact details. Title: Mr/Mrs/Ms First Name Last Name Job Title Company Email Address Telephone Number Fax Number Address City State/Province Country Post Code/ZIP All Forms must have a signature to confirm your order: Signature Where did you find us? EU Companies must supply Purchase Order No Order Date Google/Search Engine VAT No (if required) Google Adwords/Online Advertising Article in Trade Journal Press Release Social Media Recommendation Others: ________________________ Note: Reports are provided in electronic PDF form. yStats.com will contact you in the future to provide our free newsletter or other mailings. If you do not wish to receive our newsletter or other mailings, you may advise us of this. Your contact information will not be sold to other organizations. 1 ) Site Licenses, allowing all users within a given geographical location of an organization to access the report, are available for double the price. 2 ) Global Site Licenses, allowing all worldwide users of an organization to access the report, are available for triple the price. yStats.com GmbH & Co. KG Telefon: +49 (0) 40 - 39 90 68 50 info@ystats.com www.twitter.com/ystats Behringstr. 28a, 22765 Hamburg Fax: +49 (0) 40 - 39 90 68 51 www.ystats.com www.facebook.com/ystats