Geography Awareness Week 2010 and GIS Day 2010 Competitions

Prior to 2010, the Department of Geography, University of Ottawa, hosted a poster competition among undergraduate and graduate students for GIS Day. In 2010, maps and photographs are added to include additional ways of representing geographic phenomena, and the competition is expanded to combine GIS Day with Geography Awareness Week. To assist in judging the entries, guidelines for evaluating maps, photographs, and posters were prepared by Barry Wellar, Professor Emeritus, University of Ottawa, and Past Chair, Geography Awareness Week, Canadian Association of Geographers. Initial responses to the guidelines by judges, faculty, and students suggest that the guidelines are very effective as a means to efficiently and fairly evaluate large numbers of geography-related exhibits in a short span of time, and are also useful as design frameworks and checklists for course outlines, research projects, publications, and term assignments.
Recommended

Recommended
More Related Content
Similar to Geography Awareness Week 2010 and GIS Day 2010 Competitions
Similar to Geography Awareness Week 2010 and GIS Day 2010 Competitions (20)
More from Barry Wellar
More from Barry Wellar (20)
Recently uploaded
Recently uploaded (20)
Geography Awareness Week 2010 and GIS Day 2010 Competitions
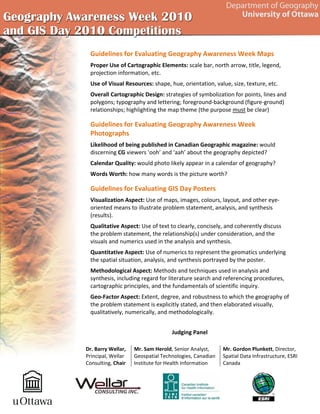
- 1. Geography Awareness Week 2010 and GIS Day 2010 Competitions Department of Geography University of Ottawa Guidelines for Evaluating Geography Awareness Week Maps Proper Use of Cartographic Elements: scale bar, north arrow, title, legend, projection information, etc. Use of Visual Resources: shape, hue, orientation, value, size, texture, etc. Overall Cartographic Design: strategies of symbolization for points, lines and polygons; typography and lettering; foreground‐background (figure‐ground) relationships; highlighting the map theme (the purpose must be clear) Guidelines for Evaluating Geography Awareness Week Photographs Likelihood of being published in Canadian Geographic magazine: would discerning CG viewers ‘ooh’ and ‘aah’ about the geography depicted? Calendar Quality: would photo likely appear in a calendar of geography? Words Worth: how many words is the picture worth? Guidelines for Evaluating GIS Day Posters Visualization Aspect: Use of maps, images, colours, layout, and other eye‐ oriented means to illustrate problem statement, analysis, and synthesis (results). Qualitative Aspect: Use of text to clearly, concisely, and coherently discuss the problem statement, the relationship(s) under consideration, and the visuals and numerics used in the analysis and synthesis. Quantitative Aspect: Use of numerics to represent the geomatics underlying the spatial situation, analysis, and synthesis portrayed by the poster. Methodological Aspect: Methods and techniques used in analysis and synthesis, including regard for literature search and referencing procedures, cartographic principles, and the fundamentals of scientific inquiry. Geo‐Factor Aspect: Extent, degree, and robustness to which the geography of the problem statement is explicitly stated, and then elaborated visually, qualitatively, numerically, and methodologically. Judging Panel Dr. Barry Wellar, Principal, Wellar Consulting, Chair Mr. Sam Herold, Senior Analyst, Geospatial Technologies, Canadian Institute for Health Information Mr. Gordon Plunkett, Director, Spatial Data Infrastructure, ESRI Canada