Gap analysis tool for performance improvement
•
7 gostaram•9,019 visualizações

A presentation that we did on using tools such as gap analysis, decision matrix and affinity diagram to facilitate group learning. This presentation was used for peer teaching and sharing during DACE facilitation elective.

Recomendados
Recomendados
Mais conteúdo relacionado
Mais procurados
Mais procurados (20)
Destaque
Destaque (14)
Último
Último (20)
Gap analysis tool for performance improvement
- 1. Gap analysis Group Members: Tan Jian Hong Denise Pong Goh Wei Koon Kamal
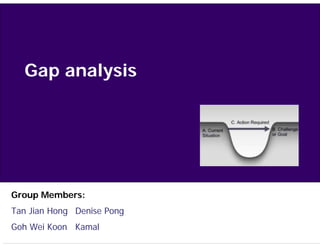
- 2. What is Gap Analysis? Gap analysis is a tool that helps us to compare its actual performance with its potential performance. Two core questions are: "Where are we?" and "Where do we want to be?
- 3. What does Gap Analysis plans to achieve? The goal of gap analysis is to identify the gap between the optimized allocation and integration of the inputs (resources) and the current level of allocation. This helps provide us with insight into areas which could be improved. Gap analysis provides a foundation for measuring investment of time, money and human resources required to achieve a particular outcome
- 4. Process of Gap Analysis The gap analysis process involves determining, documenting and approving the variance between business requirements and current capabilities. Gap analysis naturally flows from benchmarking and other assessments.
- 5. Areas to use Gap Analysis •Market potential •Existing usage •Product gap •Competitive gap •Current industrial potential
- 6. Decision Matrix / Perspective- Criteria Matrix
- 7. Decision Matrix • Consist of critical criteria used to assess a set of ideas to determine which one(s) are best possible solution(s) • Brings objectivity and thoroughness to decision making process • Prevents biasness by team members
- 8. Ideas Selection Perspective-Criteria Matrix Step A: Define 2 perspectives Step B: Define 2 criteria per perspective Step C: Select your ideas 8 Ref: Turning Ideas Into Gold pp 161 - 174
- 9. PCM: Examples of Perspectives • Customers, stakeholders • Internal / External • Management / Staffs • Public / Organization • Judges, etc. es iv ect sp per 2 e ct el 9 Ref: Turning Ideas Into Gold pp 161 - 174 S
- 10. PCM: Examples of Criteria • Least Cost / resources • Innovativeness • Maximum impact ve ti • Least risk ec sp • Shortest timeframe per • Most important / most urgency per • Maximum savings ria • Etc. rite c t2 ec S el 10 Ref: Turning Ideas Into Gold pp 161 - 174
- 11. Prioritizing from Organization Point of View High Impact 2 4 1 3 Low Low High Innovativeness 11 Ref: Turning Ideas Into Gold pp 161 - 174
- 12. Where to write? 2 cm Partnership With University for research of XXX 12 Ref: Turning Ideas Into Gold pp 161 - 174
- 13. Prioritizing from Public Point of View Fast Response 2 4 1 3 Slow Least Most convenient 13 Ref: Turning Ideas Into Gold pp 161 - 174
- 14. Where to write? 2 cm Partnership With University for research of XXX 14 Ref: Turning Ideas Into Gold pp 161 - 174
- 15. 1. Select all the ideas cm with 7 or 8 points 2 2. Discuss with your Partnership team to pick the best With ideas for NUS for implementation research of XXX 15 Ref: Turning Ideas Into Gold pp 161 - 174
- 16. Multi-Dimension Decision Matrix Factors Carol Mike Betty Joe Initiative 5 3 1 4 Learn 4 5 1 2 Compatible 4 2 3 1 Experience 1 3 4 5 Excel 3 4 4 4 SAS 4 5 3 2 Total 21 22 16 18 16
- 17. Affinity Diagram
- 18. Introduction • Creative brainstorming process in which consensus is reached by visual (written) rather than verbal means. • Can also be used as a management and planning tool that can help with the systematic analysis of large amounts of data. • Helps in translating large amounts of complex, apparently unrelated information, into natural and meaningful groupings of data.
- 19. Steps to carry out Affinity Diagram 1. Identify Performance Problem or Business Opportunity 2. Assemble the Right Team 3. Generate and Record Ideas 4. Silent Sorting 5. Consensus on Final Groupings 6. Create Header Cards That Describe the Grouping 7. Draw a Finished Affinity Diagram
- 20. Basic Structure of Affinity Diagram Problem Statement Header Card Header Card Header Card Idea Idea Idea Idea Idea Idea Idea Idea Idea
- 21. Advantages of Affinity Diagram • A team can generate a large number of ideas in a relatively short period of time. • Encourages participation because every person’s ideas find their way into the process. • Encourages ‘new’ thinking when only ‘old’ solutions are emerging from a group.
- 22. Advantages of Affinity Diagram • Facilitates the exploration of new and logical thought patterns by encouraging people to react from a creative response level rather than the intellectual and logical levels. • An effective way to deal with large and complex issues which may be ‘paralyzing’ the brainstorming of a team. • Consensus and support are reached on a solution because all participants have ‘ownership’ in the process.
- 23. Limitations of Affinity Diagram • The use of technical language skills may require detailed clarification of ideas which is not allowed because ideas are generated in silence and without discussion. • Group members must have the necessary expertise on the issue. • Getting a non-traditional group together that is willing to engage in ‘new thinking’ may be hard to do.