Knight Capital - Burges - Financing Renewables
•
2 gostaram•859 visualizações

Financing Renewables Presented by John Burges of Knight Capital at the Green Energy Act Finance Forum on Friday January 29, 2010 For more information visit http://www.marsdd.com/greenenergyforum

Recomendados
Mais conteúdo relacionado
Semelhante a Knight Capital - Burges - Financing Renewables
Semelhante a Knight Capital - Burges - Financing Renewables (20)
Mais de MaRS Discovery District
Mais de MaRS Discovery District (20)
Último
Último (20)
Knight Capital - Burges - Financing Renewables
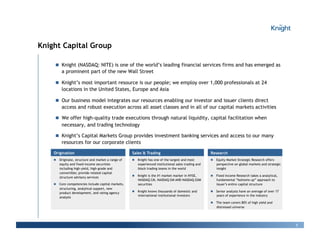
- 1. Knight Capital Group !! Knight (NASDAQ: NITE) is one of the world’s leading financial services firms and has emerged as a prominent part of the new Wall Street !! Knight’s most important resource is our people; we employ over 1,000 professionals at 24 locations in the United States, Europe and Asia !! Our business model integrates our resources enabling our investor and issuer clients direct access and robust execution across all asset classes and in all of our capital markets activities !! We offer high-quality trade executions through natural liquidity, capital facilitation when necessary, and trading technology !! Knight’s Capital Markets Group provides investment banking services and access to our many resources for our corporate clients Origination Sales & Trading Research !! Originate, structure and market a range of !! Knight has one of the largest and most !! Equity Market Strategic Research offers equity and fixed-income securities experienced institutional sales trading and perspective on global markets and strategic including high-yield, high-grade and block trading teams in the world insight convertible; provide related capital !! Knight is the #1 market marker in NYSE, !! Fixed Income Research takes a analytical, structure advisory services NASDAQ CM, NASDAQ GM AND NASDAQ GSM fundamental “bottoms-up” approach to !! Core competencies include capital markets, securities issuer’s entire capital structure structuring, analytical support, new !! Knight knows thousands of domestic and !! Senior analysts have an average of over 17 product development, and rating agency international institutional investors years of experience in the industry analysis !! The team covers 80% of high yield and distressed universe 1
- 2. Knight’s Sales & Trading Capabilities !! Knight is the #1 market maker in NYSE securities, with 17.25% total volume YTD !! Knight is the #1 market maker in NASDAQ CM securities, with 47.71% total volume YTD !! Knight is the #1 market maker in NASDAQ GM securities, with 42.16% total volume YTD !! Knight is the #1 market maker in NASDAQ GSM securities, with 18.06% total volume YTD Source: AutEx/BlockData FY2009 Global Sales Office Locations 2
- 3. Knight is the Market Leader in Cleantech Equity Trading #1 in Volume Share volume in (1/1/2009 – 12/31/2009) Source: AutEx Blockdata advertised US trade volume 3
- 4. What Does Our Trading Share Mean to Capital Markets? We track institutional buy and sell activity and generate real time insight for our capital markets team The best intelligence on the “new” Wall Street Capital market targeting and placement is significantly more efficient and cost effective 4
- 5. 5
- 6. Follow the Money Total Revenue (!) Market Cap at Year End (!) Source: Capital IQ 6
- 7. Asset Finance for Renewable Projects are 80% of capital – 70-80% debt financed Debt Financing for Projects is the bulk of Investment 7
- 8. PV Capital Requirements: Who Finances? Source: Good Energies 8
- 9. Renewable Energy Policies Matter 9
- 10. Solar Markets: Germany vs. California Cumulative MWs Sources: CPUC, CEC, SEIA and German equivalents. Germany added 10 times more solar than California last year even though California’s solar resource is about 70% better 10
- 11. The Holy Grail for attracting Capital !! Regulatory stability !! Avoid stop/start; no cap !! Simplicity !! Federal vs. State vs. IOU vs. Muni !! Numerous variations !! Barriers to entry – for capital and business !! Predictable cashflows from selling power !! Guaranteed transmission access !! Must take contracts !! Long term contracts to match long term assets !! Reasonable Returns across different projects !! Technology, size !! Expedited Permitting …the US share of worldwide solar shrunk to 5% 11
- 12. Parasitic Transaction Costs & Parasitic Transaction Time are Near-Zero Typical California paperwork for one project Typical Germany paperwork for one project Could be a 1kW-sized project, but maximum Could be a 1kW or 20MW-sized project, or bigger. 1MW (via CSI program). Even more paperwork for California projects larger than 1MW (via RPS program). Frictional Costs add 10% on the ratepayer for California projects vs. German ones Source: Gary Gerber, President of CalSEIA and Sun Light & Power, Jun09 12
- 13. Global Financial Meltdown !! Exacerbated winners from losers !! Less tax capacity & capital available by institutional investors !! Federal tax credits were becoming “worthless” !! Equity supply dries up; returns increase !! Fewer renewable energy projects !! ~3,000 MW less wind farms installed in US in ’09 vs. ’08 !! Loss of 38,000 “green collar” jobs Warren Buffet: “When the tide goes out you can see who has been swimming naked” 13
- 14. Shortfall in Tax Equity Source – GE Energy Financial Services 14
- 15. NREL Research Findings !! Countries with FITs: !! Have highest RE deployment !! Have highest job creation; highest economist benefits tied to industry, manufacturing & services !! Have counter-intuitively delivered lower-cost RE generation than countries employing “competitive” policies like the RPS & RO in the UK 15
- 16. FITS vs. Alternative Policies Wind power deployment in the EU: Source: EUROSTAT, 2008; NREL, 2008 16
- 17. NREL Findings - RE Policy & Cost FITs RPS + RECs * Electricity price + Tradable Green Certificate (i.e. REC) Source: BMU 2008; ISI, 2008; Fouquet, D. et al., 2008 17
- 18. NREL - FITS vs. RPS on Cost " NREL Research finding that FITs offer better value for money Source: OPTRES, 2007; NREL 2009 18
- 19. How Does Ontario’s RE Policy Compare? Ontario has the best RE policies in the Western Hemisphere 19
- 20. Investment Return for ON FIT Implied Debt Costs !! Investment appetite has returned – HY index has improved from 20% to ~ 8-9%; bank appetite remains restrained !! The FIT must take obligation from OPA (100% owned by the Province of Ontario) provides a stable source of cash flows for FIT projects and makes them financeable !! Province of Ontario’s (Corp rating: Aa1/AA-) bonds are trading at 4.2%; similar regulated US utilities trade within 100bps risk premium Treasuries !! FPL Group’s (Corp rating: A2/A) bonds are trading at 4.9%; US IPP’s long term bonds are trading between 8% to 9% !! Project Finance debt spreads for RE projects 300-350bps for all in costs 6.5-7%; cost of debt not the issue Yield to worst for Electric Utilities Yield to worst for Independent Power Producers FPL: 4.9% MIR: 9.1% ONT: 4.2% NRG: 8.4% RRI: 8.2% Source: Bloomberg, Knight as of 01/25/10 Source: Bloomberg, Knight as of 01/25/10 Notes: ONT: Province of Ontario, FPL: FPL Group Notes: MIR: Mirant Corp, NRG: NRG Energy, RRI: Reliant Energy 20
- 21. Ontario Projected IRRs OPA targeted 11% levered IRR OPA targeted 11% levered IRR 21
- 22. Attractive Post Tax Levered Equity IRR Returns Solar Ground Mounted (Installed $4.20-5.60) Wind Onshore (Installed $2.50-3.20) Scotia Capital Research 22
- 23. Conclusion !! Investment is fungible – it will flow to the best risk weighted returns !!Without debt financing RE isn’t scalable !! High IRRs are healthy but based on European experience show flexibility !! Get organized to protect FITs; articulate benefits Investors will pay a premium for liquidity – Knight is the leading provider of equity liquidity 23
- 24. Contact Information Capital Markets Contact Information Please contact John Burges for Clean Tech and Energy inquiries: jburges@knight.com 212-479-7498 Capital Markets Office Locations Greenwich, CT – DCM Corporate Headquarters New York City – ECM Headquarters Headquarters 545 Washington Blvd 405 Lexington Ave, 46th Fl 1 Greenwich Office Park South Jersey City, NJ 07310 New York, NY 10017 2nd Floor Greenwich, CT 06831 24