SlideShare uma empresa Scribd logo
1 de 22
Baixar para ler offline
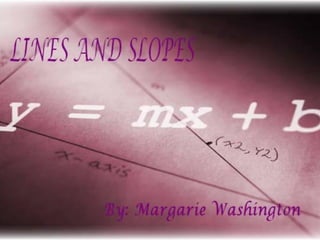
Lines and Slopes
                   Table of Contents
• Introduction
• Drawing a Line
  - Graphing Points First
• Slope
  - Calculating Slope
  - Finding Those Slopes
Introduction
John and his friend wants to catch flies with
 their tongues. Their tongues are going to go
straight just how a line would. John begins to
 use his knowledge about lines to catch flies.
Drawing a Line
When you are able to know two points on a line
 then you are able to find the rest of the line.
 John is going to draw a line through these
 points.
John shifts his tongue to reach the two points
  and go right through them.
John begins to draw arrows to show that the line
  goes on forever.


    *make sure you use a ruler or something with a straight edge to ensure
    that your line is straight.*
Graphing Points First
When graphing a line you must use an equation.
  Take for example when graphing the line:
3x + y = 9 John would have to find the values x
  and y to make the equation true.
He choices to have x value equal 2. Once John has
 the value x, he has to find y by substituting the
 value x=2 into the equation.

                   3x + y = 9
                   3(2) + y = 9
                    6+y=9
                    -6 =-6
                      Y=3
John realize that when x = 2, y = 3
which makes the equation true. Now
     he graphs the point ( 2, 3)


              (2, 3)
John needs one more point before graphing the
  line. So he has to find another value for x and
  y. He makes y = 0. He substitutes the value of
  y = 0 into the original equation.
(Shown below)
                     3x + y = 9
                     3x + 0 = 9
                       3x = 9
                      3      3
                        X=3
Here John found that when y=0, x=3
that makes the equation true. Now
   graph the second point (3,0)


              (2, 3)

                 (3, 0)
Again John draws a line through the
points and add the arrows. Then write
the equation beside the line to label it.


            (2, 3)


             (3, 0)

                3x + y = 9
To be sure John understands how to graph a
      line. He graphs another equation:
                   y = 2x - 4
Again he has to find
two points to graph         Y = 2x – 4
the equation. He has
to find the values for x   Y = 2(0) – 4
and y to make sure          Y=0–4
the equation is true.
For the first point he        Y = -4
substitutes 0 for the
variable x.
When John value x = 0 then y = -4. He
  can now graph the point (0, -4).


           (0, -4)
For the second
point he substitutes
1 for the variable x.

       Y= 2x – 4
      Y = 2(1) – 4
       Y=2–4
                                 Y = 2x - 4       (1, -2)
         Y = -2
                                              (0, -4)


 John value x = 1 then y = -2.                     He draws the line through the
 Now he can graph the second                       points and add the arrows. He
 point (1, -2).                                    then labels the line with the
                                                   equation.
Slope
   When using slope we use it to measure a line’s
                     slant.
 Here is a picture with three
 different types of slopes.
                                 There can even
                                 be a negative
                                 slope line and
                                 that’s when the
                                 lines point down
                                 instead of up.
                                 Ex. Shown to
                                 the right


The green line has the biggest slope and
  the red line has the smallest slope out of
  the three slopes.
Calculating the Slope
When calculating the
 slope John define the
 slope as the change in
 the y-coordinates divide
 by the change in the x-
 coordinates. Most
 people refer to it as the
 “rise over run”.

                             *The change in y-coordinate is
                             the “rise” and the change in the
                             x-coordinate is the “run”.*
Slope Formula
Change in x-coordinate         When identifying our
  and change in my y-           points, our first point
  coordinate is put in a        (x1, y1) and the second
  formula using the Greek       point (x2, y2). John
  letter delta ∆. This is an    substitute these points
  abbreviation for              in for the delta ∆.
  change.                                 Y2 –Y1
            ∆Y                    M= X2 – Y1
      M= ∆ X
Finding the Slope
         John first have to locate
           the two points on the
           line. We notice that the
           line intersect at the y-
           axis. This is the first
           point (0, 4). When then
           find the second point on
           the line where the two
           gridlines cross. This is
           our second point (2, 1).
Now that we have our points John
plugs it into the slope equation to find
the slope.

M = (y2 – y1)/ (x2 – x1)
M = (1 – 4) / (2 – 0)
M = -3 / 2

The slope is negative.
Overall
John has taught us how to draw a line by
  graphing the points and calculating the slope.
  Know he and his friends can catch their flies.
Cited
This is the site where I found my lesson plan and some
  of my graphs.
Drexel University. The Math Forum @ Drexel. 1994-
  2007. 1 December 2009
http://mathforum.org/cgraph/cslope/drawline.html
This is the site where I found some of my graphs.
Niebuhr. Blog Spot. 17 October 2009. 1 December 2009
http://nghsapphysicsb.blogspot.com/2009/10/super-
  explanation-of-how-rolling.html

Mais conteúdo relacionado

Mais procurados

Geo 3.6&7 slope
Geo 3.6&7 slopeGeo 3.6&7 slope
Geo 3.6&7 slopeejfischer
 
Linear Functions Presentation
Linear Functions PresentationLinear Functions Presentation
Linear Functions PresentationMelanie Loslo
 
7 3elimination
7 3elimination7 3elimination
7 3eliminationtaco40
 
Integrated 2 Section 6-3
Integrated 2 Section 6-3Integrated 2 Section 6-3
Integrated 2 Section 6-3Jimbo Lamb
 
Int Math 2 Section 6-3 1011
Int Math 2 Section 6-3 1011Int Math 2 Section 6-3 1011
Int Math 2 Section 6-3 1011Jimbo Lamb
 
Graphs linear equations and functions
Graphs linear equations and functionsGraphs linear equations and functions
Graphs linear equations and functionsanwarsalamappt
 
M1 Prsolutions08
M1 Prsolutions08M1 Prsolutions08
M1 Prsolutions08guest91c200
 
36 slopes of lines-x
36 slopes of lines-x36 slopes of lines-x
36 slopes of lines-xmath123a
 
Graphs of linear equation
Graphs of linear equationGraphs of linear equation
Graphs of linear equationJunila Tejada
 
11.2 graphing linear equations in two variables
11.2 graphing linear equations in two variables11.2 graphing linear equations in two variables
11.2 graphing linear equations in two variablesGlenSchlee
 
4.2 stem parabolas revisited
4.2 stem parabolas revisited4.2 stem parabolas revisited
4.2 stem parabolas revisitedmath123c
 
38 equations of lines-x
38 equations of lines-x38 equations of lines-x
38 equations of lines-xmath123a
 
Elizabeth& Valarie - Linear Function
Elizabeth& Valarie - Linear FunctionElizabeth& Valarie - Linear Function
Elizabeth& Valarie - Linear FunctionHope Scott
 
Graphing Linear Equations Teacher Lecture
Graphing Linear Equations Teacher LectureGraphing Linear Equations Teacher Lecture
Graphing Linear Equations Teacher LectureAdam Jackson
 
CST 504 Linear Equations
CST 504 Linear EquationsCST 504 Linear Equations
CST 504 Linear EquationsNeil MacIntosh
 

Mais procurados (19)

Geo 3.6&7 slope
Geo 3.6&7 slopeGeo 3.6&7 slope
Geo 3.6&7 slope
 
Linear Functions Presentation
Linear Functions PresentationLinear Functions Presentation
Linear Functions Presentation
 
identities1.2
identities1.2identities1.2
identities1.2
 
7 3elimination
7 3elimination7 3elimination
7 3elimination
 
Integrated 2 Section 6-3
Integrated 2 Section 6-3Integrated 2 Section 6-3
Integrated 2 Section 6-3
 
Int Math 2 Section 6-3 1011
Int Math 2 Section 6-3 1011Int Math 2 Section 6-3 1011
Int Math 2 Section 6-3 1011
 
Graphs linear equations and functions
Graphs linear equations and functionsGraphs linear equations and functions
Graphs linear equations and functions
 
M1 Prsolutions08
M1 Prsolutions08M1 Prsolutions08
M1 Prsolutions08
 
36 slopes of lines-x
36 slopes of lines-x36 slopes of lines-x
36 slopes of lines-x
 
Graphs of linear equation
Graphs of linear equationGraphs of linear equation
Graphs of linear equation
 
11.2 graphing linear equations in two variables
11.2 graphing linear equations in two variables11.2 graphing linear equations in two variables
11.2 graphing linear equations in two variables
 
4.2 stem parabolas revisited
4.2 stem parabolas revisited4.2 stem parabolas revisited
4.2 stem parabolas revisited
 
38 equations of lines-x
38 equations of lines-x38 equations of lines-x
38 equations of lines-x
 
Elizabeth& Valarie - Linear Function
Elizabeth& Valarie - Linear FunctionElizabeth& Valarie - Linear Function
Elizabeth& Valarie - Linear Function
 
Graphing Linear Equations Teacher Lecture
Graphing Linear Equations Teacher LectureGraphing Linear Equations Teacher Lecture
Graphing Linear Equations Teacher Lecture
 
CST 504 Linear Equations
CST 504 Linear EquationsCST 504 Linear Equations
CST 504 Linear Equations
 
1544 integration-define
1544 integration-define1544 integration-define
1544 integration-define
 
2.2 slope
2.2 slope2.2 slope
2.2 slope
 
Lesson 39b
Lesson 39bLesson 39b
Lesson 39b
 

Destaque

Fdi and ict effects on productivity growth in middle east countries
Fdi and ict effects on productivity growth in middle east countriesFdi and ict effects on productivity growth in middle east countries
Fdi and ict effects on productivity growth in middle east countriesAlexander Decker
 
Hr 2.0 Executive Summary
Hr 2.0 Executive SummaryHr 2.0 Executive Summary
Hr 2.0 Executive SummaryTalentys
 
The basics of social media advertising 3(2)
The basics of social media advertising 3(2)The basics of social media advertising 3(2)
The basics of social media advertising 3(2)Anna Agishtein
 
Dyn-Revolution
Dyn-RevolutionDyn-Revolution
Dyn-Revolutionbenom999
 

Destaque (6)

Aws simple db
Aws simple dbAws simple db
Aws simple db
 
Fdi and ict effects on productivity growth in middle east countries
Fdi and ict effects on productivity growth in middle east countriesFdi and ict effects on productivity growth in middle east countries
Fdi and ict effects on productivity growth in middle east countries
 
Hr 2.0 Executive Summary
Hr 2.0 Executive SummaryHr 2.0 Executive Summary
Hr 2.0 Executive Summary
 
Presentazione Human
Presentazione HumanPresentazione Human
Presentazione Human
 
The basics of social media advertising 3(2)
The basics of social media advertising 3(2)The basics of social media advertising 3(2)
The basics of social media advertising 3(2)
 
Dyn-Revolution
Dyn-RevolutionDyn-Revolution
Dyn-Revolution
 

Semelhante a Lines and Slopes

Linear equations part i
Linear equations part iLinear equations part i
Linear equations part icoburgmaths
 
2.2 linear equations and 2.3 Slope
2.2 linear equations and 2.3 Slope2.2 linear equations and 2.3 Slope
2.2 linear equations and 2.3 SlopeJessica Garcia
 
WRITING AND GRAPHING LINEAR EQUATIONS 1.pptx
WRITING AND GRAPHING LINEAR EQUATIONS 1.pptxWRITING AND GRAPHING LINEAR EQUATIONS 1.pptx
WRITING AND GRAPHING LINEAR EQUATIONS 1.pptxKristenHathcock
 
local_media5416891530663583326.ppt
local_media5416891530663583326.pptlocal_media5416891530663583326.ppt
local_media5416891530663583326.pptBimNapoles1
 
Slope and y intercept
Slope and y interceptSlope and y intercept
Slope and y interceptbillingssr
 
Linear equations part i
Linear equations part iLinear equations part i
Linear equations part iFendi Ard
 
Week 1 discussion : Systems of linear equations
Week 1 discussion :  Systems of linear equationsWeek 1 discussion :  Systems of linear equations
Week 1 discussion : Systems of linear equationsSkye Lucion
 
Case artifact2
Case artifact2Case artifact2
Case artifact2Cheng Xue
 
Finding slope
Finding slopeFinding slope
Finding slopemccallr
 
Graphing, Slope, And Special Lines
Graphing, Slope, And Special LinesGraphing, Slope, And Special Lines
Graphing, Slope, And Special Lineskliegey524
 
8.3 Slope And Y Intercept
8.3 Slope And Y Intercept8.3 Slope And Y Intercept
8.3 Slope And Y InterceptJessca Lundin
 
Slope power point grade 8
Slope power point grade 8Slope power point grade 8
Slope power point grade 8ginacdl
 

Semelhante a Lines and Slopes (20)

Line and Slope
Line and SlopeLine and Slope
Line and Slope
 
Linear equations part i
Linear equations part iLinear equations part i
Linear equations part i
 
Linear equations part i
Linear equations part iLinear equations part i
Linear equations part i
 
2.2 linear equations and 2.3 Slope
2.2 linear equations and 2.3 Slope2.2 linear equations and 2.3 Slope
2.2 linear equations and 2.3 Slope
 
WRITING AND GRAPHING LINEAR EQUATIONS 1.pptx
WRITING AND GRAPHING LINEAR EQUATIONS 1.pptxWRITING AND GRAPHING LINEAR EQUATIONS 1.pptx
WRITING AND GRAPHING LINEAR EQUATIONS 1.pptx
 
2.2 linear equations
2.2 linear equations2.2 linear equations
2.2 linear equations
 
Coordinate Plane 2.ppt
Coordinate Plane 2.pptCoordinate Plane 2.ppt
Coordinate Plane 2.ppt
 
FindingSlope.ppt
FindingSlope.pptFindingSlope.ppt
FindingSlope.ppt
 
local_media5416891530663583326.ppt
local_media5416891530663583326.pptlocal_media5416891530663583326.ppt
local_media5416891530663583326.ppt
 
Slope and y intercept
Slope and y interceptSlope and y intercept
Slope and y intercept
 
Linear equations part i
Linear equations part iLinear equations part i
Linear equations part i
 
Week 1 discussion : Systems of linear equations
Week 1 discussion :  Systems of linear equationsWeek 1 discussion :  Systems of linear equations
Week 1 discussion : Systems of linear equations
 
58 slopes of lines
58 slopes of lines58 slopes of lines
58 slopes of lines
 
Case artifact2
Case artifact2Case artifact2
Case artifact2
 
Finding slope
Finding slopeFinding slope
Finding slope
 
1555 linear equations
1555 linear equations1555 linear equations
1555 linear equations
 
Graphing, Slope, And Special Lines
Graphing, Slope, And Special LinesGraphing, Slope, And Special Lines
Graphing, Slope, And Special Lines
 
8.3 Slope And Y Intercept
8.3 Slope And Y Intercept8.3 Slope And Y Intercept
8.3 Slope And Y Intercept
 
Slope power point grade 8
Slope power point grade 8Slope power point grade 8
Slope power point grade 8
 
Math project
Math projectMath project
Math project
 

Último

Gen AI in Business - Global Trends Report 2024.pdf
Gen AI in Business - Global Trends Report 2024.pdfGen AI in Business - Global Trends Report 2024.pdf
Gen AI in Business - Global Trends Report 2024.pdfAddepto
 
The Future of Software Development - Devin AI Innovative Approach.pdf
The Future of Software Development - Devin AI Innovative Approach.pdfThe Future of Software Development - Devin AI Innovative Approach.pdf
The Future of Software Development - Devin AI Innovative Approach.pdfSeasiaInfotech2
 
SIP trunking in Janus @ Kamailio World 2024
SIP trunking in Janus @ Kamailio World 2024SIP trunking in Janus @ Kamailio World 2024
SIP trunking in Janus @ Kamailio World 2024Lorenzo Miniero
 
Nell’iperspazio con Rocket: il Framework Web di Rust!
Nell’iperspazio con Rocket: il Framework Web di Rust!Nell’iperspazio con Rocket: il Framework Web di Rust!
Nell’iperspazio con Rocket: il Framework Web di Rust!Commit University
 
Bun (KitWorks Team Study 노별마루 발표 2024.4.22)
Bun (KitWorks Team Study 노별마루 발표 2024.4.22)Bun (KitWorks Team Study 노별마루 발표 2024.4.22)
Bun (KitWorks Team Study 노별마루 발표 2024.4.22)Wonjun Hwang
 
"Federated learning: out of reach no matter how close",Oleksandr Lapshyn
"Federated learning: out of reach no matter how close",Oleksandr Lapshyn"Federated learning: out of reach no matter how close",Oleksandr Lapshyn
"Federated learning: out of reach no matter how close",Oleksandr LapshynFwdays
 
"ML in Production",Oleksandr Bagan
"ML in Production",Oleksandr Bagan"ML in Production",Oleksandr Bagan
"ML in Production",Oleksandr BaganFwdays
 
Search Engine Optimization SEO PDF for 2024.pdf
Search Engine Optimization SEO PDF for 2024.pdfSearch Engine Optimization SEO PDF for 2024.pdf
Search Engine Optimization SEO PDF for 2024.pdfRankYa
 
Unraveling Multimodality with Large Language Models.pdf
Unraveling Multimodality with Large Language Models.pdfUnraveling Multimodality with Large Language Models.pdf
Unraveling Multimodality with Large Language Models.pdfAlex Barbosa Coqueiro
 
Training state-of-the-art general text embedding
Training state-of-the-art general text embeddingTraining state-of-the-art general text embedding
Training state-of-the-art general text embeddingZilliz
 
"LLMs for Python Engineers: Advanced Data Analysis and Semantic Kernel",Oleks...
"LLMs for Python Engineers: Advanced Data Analysis and Semantic Kernel",Oleks..."LLMs for Python Engineers: Advanced Data Analysis and Semantic Kernel",Oleks...
"LLMs for Python Engineers: Advanced Data Analysis and Semantic Kernel",Oleks...Fwdays
 
Advanced Test Driven-Development @ php[tek] 2024
Advanced Test Driven-Development @ php[tek] 2024Advanced Test Driven-Development @ php[tek] 2024
Advanced Test Driven-Development @ php[tek] 2024Scott Keck-Warren
 
Human Factors of XR: Using Human Factors to Design XR Systems
Human Factors of XR: Using Human Factors to Design XR SystemsHuman Factors of XR: Using Human Factors to Design XR Systems
Human Factors of XR: Using Human Factors to Design XR SystemsMark Billinghurst
 
Transcript: New from BookNet Canada for 2024: BNC CataList - Tech Forum 2024
Transcript: New from BookNet Canada for 2024: BNC CataList - Tech Forum 2024Transcript: New from BookNet Canada for 2024: BNC CataList - Tech Forum 2024
Transcript: New from BookNet Canada for 2024: BNC CataList - Tech Forum 2024BookNet Canada
 
DevEX - reference for building teams, processes, and platforms
DevEX - reference for building teams, processes, and platformsDevEX - reference for building teams, processes, and platforms
DevEX - reference for building teams, processes, and platformsSergiu Bodiu
 
"Debugging python applications inside k8s environment", Andrii Soldatenko
"Debugging python applications inside k8s environment", Andrii Soldatenko"Debugging python applications inside k8s environment", Andrii Soldatenko
"Debugging python applications inside k8s environment", Andrii SoldatenkoFwdays
 
What's New in Teams Calling, Meetings and Devices March 2024
What's New in Teams Calling, Meetings and Devices March 2024What's New in Teams Calling, Meetings and Devices March 2024
What's New in Teams Calling, Meetings and Devices March 2024Stephanie Beckett
 
Beyond Boundaries: Leveraging No-Code Solutions for Industry Innovation
Beyond Boundaries: Leveraging No-Code Solutions for Industry InnovationBeyond Boundaries: Leveraging No-Code Solutions for Industry Innovation
Beyond Boundaries: Leveraging No-Code Solutions for Industry InnovationSafe Software
 
Developer Data Modeling Mistakes: From Postgres to NoSQL
Developer Data Modeling Mistakes: From Postgres to NoSQLDeveloper Data Modeling Mistakes: From Postgres to NoSQL
Developer Data Modeling Mistakes: From Postgres to NoSQLScyllaDB
 

Último (20)

Gen AI in Business - Global Trends Report 2024.pdf
Gen AI in Business - Global Trends Report 2024.pdfGen AI in Business - Global Trends Report 2024.pdf
Gen AI in Business - Global Trends Report 2024.pdf
 
The Future of Software Development - Devin AI Innovative Approach.pdf
The Future of Software Development - Devin AI Innovative Approach.pdfThe Future of Software Development - Devin AI Innovative Approach.pdf
The Future of Software Development - Devin AI Innovative Approach.pdf
 
SIP trunking in Janus @ Kamailio World 2024
SIP trunking in Janus @ Kamailio World 2024SIP trunking in Janus @ Kamailio World 2024
SIP trunking in Janus @ Kamailio World 2024
 
Nell’iperspazio con Rocket: il Framework Web di Rust!
Nell’iperspazio con Rocket: il Framework Web di Rust!Nell’iperspazio con Rocket: il Framework Web di Rust!
Nell’iperspazio con Rocket: il Framework Web di Rust!
 
Bun (KitWorks Team Study 노별마루 발표 2024.4.22)
Bun (KitWorks Team Study 노별마루 발표 2024.4.22)Bun (KitWorks Team Study 노별마루 발표 2024.4.22)
Bun (KitWorks Team Study 노별마루 발표 2024.4.22)
 
"Federated learning: out of reach no matter how close",Oleksandr Lapshyn
"Federated learning: out of reach no matter how close",Oleksandr Lapshyn"Federated learning: out of reach no matter how close",Oleksandr Lapshyn
"Federated learning: out of reach no matter how close",Oleksandr Lapshyn
 
"ML in Production",Oleksandr Bagan
"ML in Production",Oleksandr Bagan"ML in Production",Oleksandr Bagan
"ML in Production",Oleksandr Bagan
 
Search Engine Optimization SEO PDF for 2024.pdf
Search Engine Optimization SEO PDF for 2024.pdfSearch Engine Optimization SEO PDF for 2024.pdf
Search Engine Optimization SEO PDF for 2024.pdf
 
Unraveling Multimodality with Large Language Models.pdf
Unraveling Multimodality with Large Language Models.pdfUnraveling Multimodality with Large Language Models.pdf
Unraveling Multimodality with Large Language Models.pdf
 
Training state-of-the-art general text embedding
Training state-of-the-art general text embeddingTraining state-of-the-art general text embedding
Training state-of-the-art general text embedding
 
"LLMs for Python Engineers: Advanced Data Analysis and Semantic Kernel",Oleks...
"LLMs for Python Engineers: Advanced Data Analysis and Semantic Kernel",Oleks..."LLMs for Python Engineers: Advanced Data Analysis and Semantic Kernel",Oleks...
"LLMs for Python Engineers: Advanced Data Analysis and Semantic Kernel",Oleks...
 
Advanced Test Driven-Development @ php[tek] 2024
Advanced Test Driven-Development @ php[tek] 2024Advanced Test Driven-Development @ php[tek] 2024
Advanced Test Driven-Development @ php[tek] 2024
 
Human Factors of XR: Using Human Factors to Design XR Systems
Human Factors of XR: Using Human Factors to Design XR SystemsHuman Factors of XR: Using Human Factors to Design XR Systems
Human Factors of XR: Using Human Factors to Design XR Systems
 
Transcript: New from BookNet Canada for 2024: BNC CataList - Tech Forum 2024
Transcript: New from BookNet Canada for 2024: BNC CataList - Tech Forum 2024Transcript: New from BookNet Canada for 2024: BNC CataList - Tech Forum 2024
Transcript: New from BookNet Canada for 2024: BNC CataList - Tech Forum 2024
 
DevEX - reference for building teams, processes, and platforms
DevEX - reference for building teams, processes, and platformsDevEX - reference for building teams, processes, and platforms
DevEX - reference for building teams, processes, and platforms
 
"Debugging python applications inside k8s environment", Andrii Soldatenko
"Debugging python applications inside k8s environment", Andrii Soldatenko"Debugging python applications inside k8s environment", Andrii Soldatenko
"Debugging python applications inside k8s environment", Andrii Soldatenko
 
DMCC Future of Trade Web3 - Special Edition
DMCC Future of Trade Web3 - Special EditionDMCC Future of Trade Web3 - Special Edition
DMCC Future of Trade Web3 - Special Edition
 
What's New in Teams Calling, Meetings and Devices March 2024
What's New in Teams Calling, Meetings and Devices March 2024What's New in Teams Calling, Meetings and Devices March 2024
What's New in Teams Calling, Meetings and Devices March 2024
 
Beyond Boundaries: Leveraging No-Code Solutions for Industry Innovation
Beyond Boundaries: Leveraging No-Code Solutions for Industry InnovationBeyond Boundaries: Leveraging No-Code Solutions for Industry Innovation
Beyond Boundaries: Leveraging No-Code Solutions for Industry Innovation
 
Developer Data Modeling Mistakes: From Postgres to NoSQL
Developer Data Modeling Mistakes: From Postgres to NoSQLDeveloper Data Modeling Mistakes: From Postgres to NoSQL
Developer Data Modeling Mistakes: From Postgres to NoSQL
 

Lines and Slopes

  • 1.
  • 2. Lines and Slopes Table of Contents • Introduction • Drawing a Line - Graphing Points First • Slope - Calculating Slope - Finding Those Slopes
  • 3. Introduction John and his friend wants to catch flies with their tongues. Their tongues are going to go straight just how a line would. John begins to use his knowledge about lines to catch flies.
  • 4. Drawing a Line When you are able to know two points on a line then you are able to find the rest of the line. John is going to draw a line through these points.
  • 5. John shifts his tongue to reach the two points and go right through them.
  • 6. John begins to draw arrows to show that the line goes on forever. *make sure you use a ruler or something with a straight edge to ensure that your line is straight.*
  • 7. Graphing Points First When graphing a line you must use an equation. Take for example when graphing the line: 3x + y = 9 John would have to find the values x and y to make the equation true.
  • 8. He choices to have x value equal 2. Once John has the value x, he has to find y by substituting the value x=2 into the equation. 3x + y = 9 3(2) + y = 9 6+y=9 -6 =-6 Y=3
  • 9. John realize that when x = 2, y = 3 which makes the equation true. Now he graphs the point ( 2, 3) (2, 3)
  • 10. John needs one more point before graphing the line. So he has to find another value for x and y. He makes y = 0. He substitutes the value of y = 0 into the original equation. (Shown below) 3x + y = 9 3x + 0 = 9 3x = 9 3 3 X=3
  • 11. Here John found that when y=0, x=3 that makes the equation true. Now graph the second point (3,0) (2, 3) (3, 0)
  • 12. Again John draws a line through the points and add the arrows. Then write the equation beside the line to label it. (2, 3) (3, 0) 3x + y = 9
  • 13. To be sure John understands how to graph a line. He graphs another equation: y = 2x - 4 Again he has to find two points to graph Y = 2x – 4 the equation. He has to find the values for x Y = 2(0) – 4 and y to make sure Y=0–4 the equation is true. For the first point he Y = -4 substitutes 0 for the variable x.
  • 14. When John value x = 0 then y = -4. He can now graph the point (0, -4). (0, -4)
  • 15. For the second point he substitutes 1 for the variable x. Y= 2x – 4 Y = 2(1) – 4 Y=2–4 Y = 2x - 4 (1, -2) Y = -2 (0, -4) John value x = 1 then y = -2. He draws the line through the Now he can graph the second points and add the arrows. He point (1, -2). then labels the line with the equation.
  • 16. Slope When using slope we use it to measure a line’s slant. Here is a picture with three different types of slopes. There can even be a negative slope line and that’s when the lines point down instead of up. Ex. Shown to the right The green line has the biggest slope and the red line has the smallest slope out of the three slopes.
  • 17. Calculating the Slope When calculating the slope John define the slope as the change in the y-coordinates divide by the change in the x- coordinates. Most people refer to it as the “rise over run”. *The change in y-coordinate is the “rise” and the change in the x-coordinate is the “run”.*
  • 18. Slope Formula Change in x-coordinate When identifying our and change in my y- points, our first point coordinate is put in a (x1, y1) and the second formula using the Greek point (x2, y2). John letter delta ∆. This is an substitute these points abbreviation for in for the delta ∆. change. Y2 –Y1 ∆Y M= X2 – Y1 M= ∆ X
  • 19. Finding the Slope John first have to locate the two points on the line. We notice that the line intersect at the y- axis. This is the first point (0, 4). When then find the second point on the line where the two gridlines cross. This is our second point (2, 1).
  • 20. Now that we have our points John plugs it into the slope equation to find the slope. M = (y2 – y1)/ (x2 – x1) M = (1 – 4) / (2 – 0) M = -3 / 2 The slope is negative.
  • 21. Overall John has taught us how to draw a line by graphing the points and calculating the slope. Know he and his friends can catch their flies.
  • 22. Cited This is the site where I found my lesson plan and some of my graphs. Drexel University. The Math Forum @ Drexel. 1994- 2007. 1 December 2009 http://mathforum.org/cgraph/cslope/drawline.html This is the site where I found some of my graphs. Niebuhr. Blog Spot. 17 October 2009. 1 December 2009 http://nghsapphysicsb.blogspot.com/2009/10/super- explanation-of-how-rolling.html