SlideShare uma empresa Scribd logo
1 de 2
Baixar para ler offline
LIBERTY MUTUAL RESEARCH INSTITUTE FOR SAFETY From Research to Reality ®


                     2011 Liberty Mutual
                     Workplace Safety Index


  According to the 2011                        The annual Workplace Safety Index
                                                                                                            Real Cost* of the Most Disabling Injuries 1998-2009
                                               identifies the top causes of serious
  Liberty Mutual Work-                         non-fatal workplace injuries based on                   48

  place Safety Index, the                      information from Liberty Mutual work-                   46                           45.6
                                               ers compensation insurance claims,
  most disabling workplace                     the U.S. Bureau of Labor Statistics                     44
                                                                                                                                              43.4
  injuries and illnesses in                    (BLS), and the National Academy
                                                                                                       42
                                                                                                                        42.8
                                               of Social Insurance. Using injury-
                                                                                          $ Billions


  2009 amounted to $50.1                       event definitions developed by the
                                                                                                                   41.5
                                                                                                       40
  billion in direct U.S.                       BLS, researchers collect data about                            40.0                                 40.0
                                                                                                                                                                 39.2
                                               injuries that cause the employee to
  workers compensation                         miss six or more days from work,
                                                                                                       38
                                                                                                                                                 38.5                      37.8

  costs. After adjusting for                   and rank those injuries by total work-                  36      37.1
                                                                                                                                                            37.2
                                               ers compensation costs. The latest
  inflation, this year’s costs                 Workplace Safety Index provides
                                                                                                       34                                                                 35.4

  decreased 6.5 percent                        statistics for injuries that occurred in                     1998	 1999	 2000	 2001	 2002	 2003	 2004	 2005	 2006	 2007	 2008	 2009
                                               2009, the most recent year for which
  from 2008.                                   data are available.
                                                                                                                                     *inflation adjusted


www.libertymutualgroup.com/researchinstitute
Overexertion1
                                                                                                                         Top Five Injury Causes
                                 Top 10 Causes of Disabling Injuries in 2009
        $12.75
                                                      ($ in Billions)                                                              The top five injury causes – overexer-
        25.4%
                                                                                                                                   tion, fall on same level, fall to lower
                 Fall on same                                                                                                      level, bodily reaction, and struck by
                      level                                                                                                        object – accounted for 71.7 percent of
                    $7.94                                                                                                          the total 2009 cost burden. Overexer-
                    15.8%          Fall to     Bodily                                                                              tion maintained its first-place rank. This
                                lower level Reaction Struck by
                                                       2

                                                            object3                                                                event category, which includes injuries
                                  $5.35       $5.28                                                                       Assault/ related to lifting, pushing, pulling, hold-
                                                            $4.64                    Caught in/      Struck
                                  10.7%       10.5%                                                                       Violent
                                                            9.3%
                                                                        Highway Compressed against Repetitive
                                                                                                                            act    ing, carrying, or throwing, cost busi-
                                                                        incident         by          object4     motion5
                                                                                                                          $0.59
                                                                                                                                   nesses $12.75 billion in direct costs
                                                                         $2.18         $2.04         $2.01       $1.97    1.2%     and accounted for more than a quarter
                                                                         4.3%          4.1%          4.0%        3.9%              of the overall national burden. Fall on
    1
     Overexertion – Injuries from excessive lifting, pushing, pulling, holding, carrying, throwing                                 same level ranked second as a leading
    2
     Bodily reaction – Injuries from bending, climbing, reaching, standing, sitting, slipping or tripping without falling
    3
     Struck by object – Such as a tool falling on a worker from above                                                              cause of disabling injury. With direct
    4
     Struck against object – Such as a worker walking into a door                                                                  costs of $7.94 billion, this category
    5
     Repetitive motion – Injuries due to repeated stress or strain
                                                                                                                                   accounted for 15.8 percent of the total
                                                                                                                                   injury burden. Fall to lower level ranked
   third at $5.35 billion in costs. Bodily reaction, which includes injuries resulting from free bodily motion such as bending, climbing,
   reaching, standing, sitting, and slipping or tripping without falling, ranked fourth at $5.28 billion. Struck by object took the fifth-
   place ranking at $4.64 billion.

   Remaining Injury Causes
   The remaining five injury causes in the top 10 each accounted for less than 5.0 percent of the direct cost of disabling injuries
   in 2009. Highway incident represented 4.3 percent of the total injury burden at $2.18 billion; caught in/compressed by (injuries
   resulting from workers being caught in or compressed by equipment or objects) accounted for 4.1 percent of the total injury bur-
   den at $2.04 billion; struck against object accounted for 4.0 percent at $2.01 billion;
   repetitive motion, with related injuries, accounted for 3.9 percent of the cost burden at
   $1.97 billion; and assault/violent act accounted for 1.2 percent at $0.59 billion.
                                                                                                    Real Growth Trends 1998-2009
                                                                                                                                   (Percent change by category)

   Overall, the top 10 cause categories comprised 89.3 percent of the entire cost burden                                                      34.2 Fall same level
   of disabling work-related injuries in 2009.
                                                                                                                                              10.2        Fall lower level

                                                                                                                                               9.4        Bodily reaction
   Real Growth Trends 1998 to 2009
                                                                                                                                               5.9     Struck by object
   The overall real (inflation-adjusted) direct costs of disabling workplace injuries                                                          3.4    Assault/Violent act
   decreased 4.6 percent between 1998 and 2009. However, fall on same level, fall to
                                                                                                                                              -1.1 Caught in/Compressed by
   lower level, bodily reaction, struck by object, and assault/violent act increased by
   34.2, 10.2, 9.4, 5.9, and 3.4 percent, respectively (see chart, right). During this same                                                   -9.9 Overexertion
   period, the real cost of disabling caught in/compressed by injuries decreased 1.1 per-                                                    -13.4 Struck against object
   cent; overexertion injuries decreased 9.9 percent; and struck against object, highway
   incident, and repetitive motion also showed cost declines, dropping 13.4, 19.8, and                                                       -19.8 Highway incident

   40.0 percent, respectively.                                                                                                               -40.0 Repetitive motion


         To learn more about the Liberty Mutual Research Institute for Safety and its programs, or to
         download Scientific Updates and our Annual Report of Scientific Activities, visit our website
         at www.libertymutual.com/researchinstitute.


Liberty Mutual Research Institute for Safety | 71 Frankland Road | Hopkinton, MA 01748 USA

Mais conteúdo relacionado

Mais de vtsiri

Combustible Dust 2015 nfpa 644
Combustible Dust 2015 nfpa 644Combustible Dust 2015 nfpa 644
Combustible Dust 2015 nfpa 644vtsiri
 
Understanding Legionnaires’ Disease A Fact Sheet For Workers And Unions
Understanding Legionnaires’ Disease A Fact Sheet For Workers And UnionsUnderstanding Legionnaires’ Disease A Fact Sheet For Workers And Unions
Understanding Legionnaires’ Disease A Fact Sheet For Workers And Unionsvtsiri
 
Tree trimming update mi 2015
Tree trimming update mi 2015Tree trimming update mi 2015
Tree trimming update mi 2015vtsiri
 
Gi forklift and mat handling 2015
Gi forklift and mat handling 2015Gi forklift and mat handling 2015
Gi forklift and mat handling 2015vtsiri
 
Capacitive app note
Capacitive app noteCapacitive app note
Capacitive app notevtsiri
 
Trenching 2014 year in review
Trenching 2014 year in reviewTrenching 2014 year in review
Trenching 2014 year in reviewvtsiri
 
Industrial electrical safety
Industrial electrical safetyIndustrial electrical safety
Industrial electrical safetyvtsiri
 
2015 industrial hygiene & respiratory care
2015 industrial hygiene & respiratory care2015 industrial hygiene & respiratory care
2015 industrial hygiene & respiratory carevtsiri
 
Fy2014 mfc construction_1.2015
Fy2014 mfc construction_1.2015Fy2014 mfc construction_1.2015
Fy2014 mfc construction_1.2015vtsiri
 
Fy2014 mfc general industry 1.2015
Fy2014 mfc general industry 1.2015Fy2014 mfc general industry 1.2015
Fy2014 mfc general industry 1.2015vtsiri
 
Construction issues for 2015
Construction issues for 2015Construction issues for 2015
Construction issues for 2015vtsiri
 
OSHA record keeping update
OSHA record keeping  updateOSHA record keeping  update
OSHA record keeping updatevtsiri
 
Gi 2014 fire siosh
Gi 2014 fire sioshGi 2014 fire siosh
Gi 2014 fire sioshvtsiri
 
General Industry 2014 ppe newsletter
General Industry 2014 ppe newsletterGeneral Industry 2014 ppe newsletter
General Industry 2014 ppe newslettervtsiri
 
OSHA regulations Fall protection
OSHA regulations Fall protection OSHA regulations Fall protection
OSHA regulations Fall protection vtsiri
 
Gi2013 introduction to safety
Gi2013 introduction to safetyGi2013 introduction to safety
Gi2013 introduction to safetyvtsiri
 
1926 power transmission fall issues 2014
1926 power transmission fall issues 20141926 power transmission fall issues 2014
1926 power transmission fall issues 2014vtsiri
 
Scaffold safety email
Scaffold safety emailScaffold safety email
Scaffold safety emailvtsiri
 
Welding Safety 2014
Welding Safety 2014Welding Safety 2014
Welding Safety 2014vtsiri
 
Ladder safety
Ladder safetyLadder safety
Ladder safetyvtsiri
 

Mais de vtsiri (20)

Combustible Dust 2015 nfpa 644
Combustible Dust 2015 nfpa 644Combustible Dust 2015 nfpa 644
Combustible Dust 2015 nfpa 644
 
Understanding Legionnaires’ Disease A Fact Sheet For Workers And Unions
Understanding Legionnaires’ Disease A Fact Sheet For Workers And UnionsUnderstanding Legionnaires’ Disease A Fact Sheet For Workers And Unions
Understanding Legionnaires’ Disease A Fact Sheet For Workers And Unions
 
Tree trimming update mi 2015
Tree trimming update mi 2015Tree trimming update mi 2015
Tree trimming update mi 2015
 
Gi forklift and mat handling 2015
Gi forklift and mat handling 2015Gi forklift and mat handling 2015
Gi forklift and mat handling 2015
 
Capacitive app note
Capacitive app noteCapacitive app note
Capacitive app note
 
Trenching 2014 year in review
Trenching 2014 year in reviewTrenching 2014 year in review
Trenching 2014 year in review
 
Industrial electrical safety
Industrial electrical safetyIndustrial electrical safety
Industrial electrical safety
 
2015 industrial hygiene & respiratory care
2015 industrial hygiene & respiratory care2015 industrial hygiene & respiratory care
2015 industrial hygiene & respiratory care
 
Fy2014 mfc construction_1.2015
Fy2014 mfc construction_1.2015Fy2014 mfc construction_1.2015
Fy2014 mfc construction_1.2015
 
Fy2014 mfc general industry 1.2015
Fy2014 mfc general industry 1.2015Fy2014 mfc general industry 1.2015
Fy2014 mfc general industry 1.2015
 
Construction issues for 2015
Construction issues for 2015Construction issues for 2015
Construction issues for 2015
 
OSHA record keeping update
OSHA record keeping  updateOSHA record keeping  update
OSHA record keeping update
 
Gi 2014 fire siosh
Gi 2014 fire sioshGi 2014 fire siosh
Gi 2014 fire siosh
 
General Industry 2014 ppe newsletter
General Industry 2014 ppe newsletterGeneral Industry 2014 ppe newsletter
General Industry 2014 ppe newsletter
 
OSHA regulations Fall protection
OSHA regulations Fall protection OSHA regulations Fall protection
OSHA regulations Fall protection
 
Gi2013 introduction to safety
Gi2013 introduction to safetyGi2013 introduction to safety
Gi2013 introduction to safety
 
1926 power transmission fall issues 2014
1926 power transmission fall issues 20141926 power transmission fall issues 2014
1926 power transmission fall issues 2014
 
Scaffold safety email
Scaffold safety emailScaffold safety email
Scaffold safety email
 
Welding Safety 2014
Welding Safety 2014Welding Safety 2014
Welding Safety 2014
 
Ladder safety
Ladder safetyLadder safety
Ladder safety
 

Liberty mutual insurance workplace safety index 2011

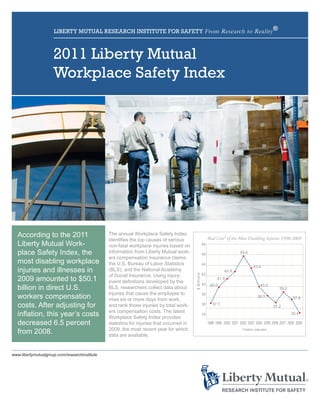
  • 1. LIBERTY MUTUAL RESEARCH INSTITUTE FOR SAFETY From Research to Reality ® 2011 Liberty Mutual Workplace Safety Index According to the 2011 The annual Workplace Safety Index Real Cost* of the Most Disabling Injuries 1998-2009 identifies the top causes of serious Liberty Mutual Work- non-fatal workplace injuries based on 48 place Safety Index, the information from Liberty Mutual work- 46 45.6 ers compensation insurance claims, most disabling workplace the U.S. Bureau of Labor Statistics 44 43.4 injuries and illnesses in (BLS), and the National Academy 42 42.8 of Social Insurance. Using injury- $ Billions 2009 amounted to $50.1 event definitions developed by the 41.5 40 billion in direct U.S. BLS, researchers collect data about 40.0 40.0 39.2 injuries that cause the employee to workers compensation miss six or more days from work, 38 38.5 37.8 costs. After adjusting for and rank those injuries by total work- 36 37.1 37.2 ers compensation costs. The latest inflation, this year’s costs Workplace Safety Index provides 34 35.4 decreased 6.5 percent statistics for injuries that occurred in 1998 1999 2000 2001 2002 2003 2004 2005 2006 2007 2008 2009 2009, the most recent year for which from 2008. data are available. *inflation adjusted www.libertymutualgroup.com/researchinstitute
  • 2. Overexertion1 Top Five Injury Causes Top 10 Causes of Disabling Injuries in 2009 $12.75 ($ in Billions) The top five injury causes – overexer- 25.4% tion, fall on same level, fall to lower Fall on same level, bodily reaction, and struck by level object – accounted for 71.7 percent of $7.94 the total 2009 cost burden. Overexer- 15.8% Fall to Bodily tion maintained its first-place rank. This lower level Reaction Struck by 2 object3 event category, which includes injuries $5.35 $5.28 Assault/ related to lifting, pushing, pulling, hold- $4.64 Caught in/ Struck 10.7% 10.5% Violent 9.3% Highway Compressed against Repetitive act ing, carrying, or throwing, cost busi- incident by object4 motion5 $0.59 nesses $12.75 billion in direct costs $2.18 $2.04 $2.01 $1.97 1.2% and accounted for more than a quarter 4.3% 4.1% 4.0% 3.9% of the overall national burden. Fall on 1 Overexertion – Injuries from excessive lifting, pushing, pulling, holding, carrying, throwing same level ranked second as a leading 2 Bodily reaction – Injuries from bending, climbing, reaching, standing, sitting, slipping or tripping without falling 3 Struck by object – Such as a tool falling on a worker from above cause of disabling injury. With direct 4 Struck against object – Such as a worker walking into a door costs of $7.94 billion, this category 5 Repetitive motion – Injuries due to repeated stress or strain accounted for 15.8 percent of the total injury burden. Fall to lower level ranked third at $5.35 billion in costs. Bodily reaction, which includes injuries resulting from free bodily motion such as bending, climbing, reaching, standing, sitting, and slipping or tripping without falling, ranked fourth at $5.28 billion. Struck by object took the fifth- place ranking at $4.64 billion. Remaining Injury Causes The remaining five injury causes in the top 10 each accounted for less than 5.0 percent of the direct cost of disabling injuries in 2009. Highway incident represented 4.3 percent of the total injury burden at $2.18 billion; caught in/compressed by (injuries resulting from workers being caught in or compressed by equipment or objects) accounted for 4.1 percent of the total injury bur- den at $2.04 billion; struck against object accounted for 4.0 percent at $2.01 billion; repetitive motion, with related injuries, accounted for 3.9 percent of the cost burden at $1.97 billion; and assault/violent act accounted for 1.2 percent at $0.59 billion. Real Growth Trends 1998-2009 (Percent change by category) Overall, the top 10 cause categories comprised 89.3 percent of the entire cost burden 34.2 Fall same level of disabling work-related injuries in 2009. 10.2 Fall lower level 9.4 Bodily reaction Real Growth Trends 1998 to 2009 5.9 Struck by object The overall real (inflation-adjusted) direct costs of disabling workplace injuries 3.4 Assault/Violent act decreased 4.6 percent between 1998 and 2009. However, fall on same level, fall to -1.1 Caught in/Compressed by lower level, bodily reaction, struck by object, and assault/violent act increased by 34.2, 10.2, 9.4, 5.9, and 3.4 percent, respectively (see chart, right). During this same -9.9 Overexertion period, the real cost of disabling caught in/compressed by injuries decreased 1.1 per- -13.4 Struck against object cent; overexertion injuries decreased 9.9 percent; and struck against object, highway incident, and repetitive motion also showed cost declines, dropping 13.4, 19.8, and -19.8 Highway incident 40.0 percent, respectively. -40.0 Repetitive motion To learn more about the Liberty Mutual Research Institute for Safety and its programs, or to download Scientific Updates and our Annual Report of Scientific Activities, visit our website at www.libertymutual.com/researchinstitute. Liberty Mutual Research Institute for Safety | 71 Frankland Road | Hopkinton, MA 01748 USA