pharma report 2020 vipul patil
•
0 likes•305 views

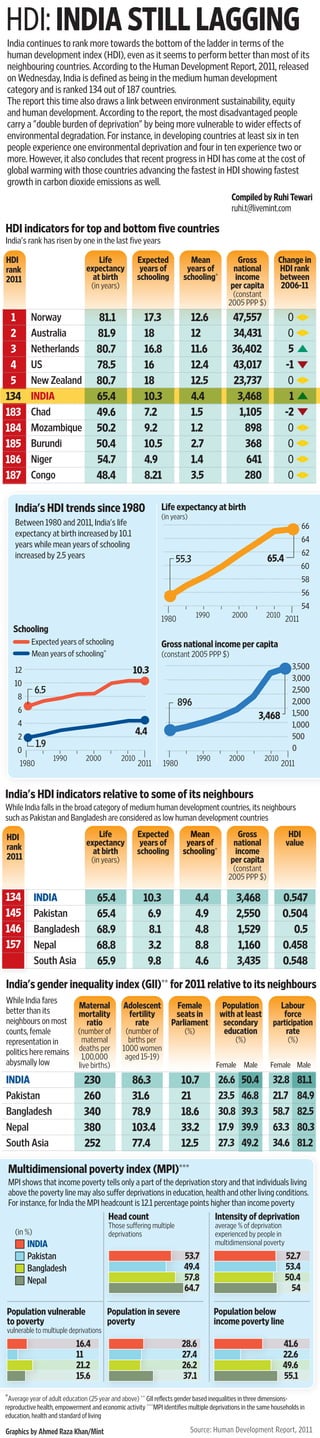
India continues to rank relatively low in terms of human development, placing 134th out of 187 countries according to the 2011 Human Development Report. While India has made progress increasing life expectancy and years of schooling, it still lags behind many of its neighbors. Female representation in Indian politics remains very low at just 10.7% in parliament, and India has a higher rate of multidimensional poverty than indices of income poverty alone would suggest.

Recommended
More Related Content
What's hot
What's hot (20)
Viewers also liked
Similar to pharma report 2020 vipul patil
Similar to pharma report 2020 vipul patil (20)
pharma report 2020 vipul patil
- 1. HDI: INDIA STILL LAGGING India continues to rank more towards the bottom of the ladder in terms of the human development index (HDI), even as it seems to perform better than most of its neighbouring countries. According to the Human Development Report, 2011, released on Wednesday, India is defined as being in the medium human development category and is ranked 134 out of 187 countries. The report this time also draws a link between environment sustainability, equity and human development. According to the report, the most disadvantaged people carry a "double burden of deprivation" by being more vulnerable to wider effects of environmental degradation. For instance, in developing countries at least six in ten people experience one environmental deprivation and four in ten experience two or more. However, it also concludes that recent progress in HDI has come at the cost of global warming with those countries advancing the fastest in HDI showing fastest growth in carbon dioxide emissions as well. Compiled by Ruhi Tewari ruhi.t@livemint.com HDI indicators for top and bottom five countries India's rank has risen by one in the last five years HDI Life Expected Mean Gross Change in rank expectancy years of years of national HDI rank 2011 at birth schooling schooling* income between (in years) per capita 2006-11 (constant 2005 PPP $) 1 Norway 81.1 17.3 12.6 47,557 0 2 Australia 81.9 18 12 34,431 0 3 Netherlands 80.7 16.8 11.6 36,402 5 4 US 78.5 16 12.4 43,017 -1 5 New Zealand 80.7 18 12.5 23,737 0 134 INDIA 65.4 10.3 4.4 3,468 1 183 Chad 49.6 7.2 1.5 1,105 -2 184 Mozambique 50.2 9.2 1.2 898 0 185 Burundi 50.4 10.5 2.7 368 0 186 Niger 54.7 4.9 1.4 641 0 187 Congo 48.4 8.21 3.5 280 0 India's HDI trends since 1980 Life expectancy at birth (in years) Between 1980 and 2011, India's life 66 expectancy at birth increased by 10.1 64 years while mean years of schooling increased by 2.5 years 62 55.3 65.4 60 58 56 54 1990 2000 2010 1980 2011 Schooling Expected years of schooling Gross national income per capita Mean years of schooling* (constant 2005 PPP $) 3,500 12 10.3 3,000 10 6.5 2,500 8 896 2,000 6 1,500 3,468 4 1,000 2 4.4 500 1.9 0 0 1990 2000 2010 1990 2000 2010 1980 2011 1980 2011 India's HDI indicators relative to some of its neighbours While India falls in the broad category of medium human development countries, its neighbours such as Pakistan and Bangladesh are considered as low human development countries HDI Life Expected Mean Gross HDI rank expectancy years of years of national value at birth schooling schooling* income 2011 (in years) per capita (constant 2005 PPP $) 134 INDIA 65.4 10.3 4.4 3,468 0.547 145 Pakistan 65.4 6.9 4.9 2,550 0.504 146 Bangladesh 68.9 8.1 4.8 1,529 0.5 157 Nepal 68.8 3.2 8.8 1,160 0.458 South Asia 65.9 9.8 4.6 3,435 0.548 India's gender inequality index (GII)** for 2011 relative to its neighbours While India fares Maternal Adolescent Female Population Labour better than its mortality fertility seats in with at least force neighbours on most ratio rate Parliament secondary participation counts, female (number of (number of (%) education rate representation in maternal births per (%) (%) politics here remains deaths per 1,00,000 1000 women aged 15-19) abysmally low live births) Female Male Female Male INDIA 230 86.3 10.7 26.6 50.4 32.8 81.1 Pakistan 260 31.6 21 23.5 46.8 21.7 84.9 Bangladesh 340 78.9 18.6 30.8 39.3 58.7 82.5 Nepal 380 103.4 33.2 17.9 39.9 63.3 80.3 South Asia 252 77.4 12.5 27.3 49.2 34.6 81.2 Multidimensional poverty index (MPI)*** MPI shows that income poverty tells only a part of the deprivation story and that individuals living above the poverty line may also suffer deprivations in education, health and other living conditions. For instance, for India the MPI headcount is 12.1 percentage points higher than income poverty Head count Intensity of deprivation Those suffering multiple average % of deprivation (in %) deprivations experienced by people in INDIA multidimensional poverty Pakistan 53.7 52.7 Bangladesh 49.4 53.4 Nepal 57.8 50.4 64.7 54 Population vulnerable Population in severe Population below to poverty poverty income poverty line vulnerable to multiuple deprivations 16.4 28.6 41.6 11 27.4 22.6 21.2 26.2 49.6 15.6 37.1 55.1 *Average year of adult education (25 year and above) ** GII reflects gender based inequalities in three dimensions- reproductive health, empowerment and economic activity ***MPI identifies multiple deprivations in the same households in education, health and standard of living Graphics by Ahmed Raza Khan/Mint Source: Human Development Report, 2011