Vikas Kedia Introduces Real Time Internet Usage Data Graph
•Transferir como PPT, PDF•
0 gostou•458 visualizações

Vikas Kedia Introduces Real Time Internet Usage Data Graph which will help the system admins to share internet connections effectively.

Recomendados
Recomendados
Mais conteúdo relacionado
Último
Último (20)
Destaque
Destaque (20)
Vikas Kedia Introduces Real Time Internet Usage Data Graph
- 1. Introducing Real Time Internet Usage Data Graph
- 2. To effectively run a large web based company we need a proper internet sharing system. It is more important when you are getting connections from different providers.
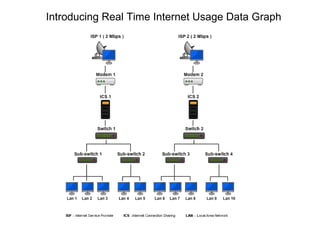
- 3. Here is an ideal internet connection distribution flow chart that one may follow:
- 4. However, the situation becomes a bit critical for the system admin when he or she needs to distribute internet connection depending on the importance of the different zones. For example - The developers may need better internet speed and stable connection than an internal facility manager. The situation is more critical when you need to maintain this within a budget or for optimum usage of the available resources.
- 5. So, here we introduce real time internet usage data graph. It will help a system admin (or a privileged user) to monitor internet connection in real time and to make necessary changes.
- 7. Let me explain The header section gives an overview of a specific ICS (ISS) that you are using. Green = Current Upload Speed in KB/s Blue = Current Download Speed in KB/s Pink = Upload Speed limit in KB/s Yellow = Download speed limit in KB/s Red = Current Ping time in ms The X axis shows you the time. You can track the internet connectivity for last 300 seconds.
- 8. Depending on this graph you can easily switch one user or a group of users to another ICS in one click.
- 9. We have open sourced this software at SourceForge.net for further development. Hope you will enjoy using and developing it further.
- 10. Thank You! Vikas Kedia http://www.vikaskedia.com