1. COFFEE SHOP EXPERIENCE IN INDIA
(Business Research with statistical model)
Introduction
India has always been predominantly a tea drinking nation. Coffee had been only moderately popular
in some southern states. However, there has been a sudden change in this trend with coffee becoming
more and more popular in recent times especially among the youth. Thanks to the new entrants in the
segment including Barista, Café Coffee Day (CCD) and others.
Cafés are increasingly becoming more than places to sip coffee. A lot many things in life and work
happen over a cup these days. India has now become one of the fastest growing coffee markets in the
world. It is taking great strides on both counts; making its presence in the world market as well as in the
domestic retail arena as more and more Indians prefer the drink.
A single visit to a shopping mall, high street or a neighborhood market, school, college, hospital or
any public place makes us realize the growing popularity of coffee shops in India. The brands available
are not just the local brands, rather lot of international brands have also managed to grab the share of
coffee market in India. Whether it is a school or a college friends meet, an official interview/meeting or
even sharing some moments of happiness with loved ones, the best place to meet is over a cup of
aromatic coffee. Coffee shops have become the most popular places to relax after a grilling day at work.
Not only are café shops pleasurable for working class, but it is heaven for shoppers who can rest their
feet in a café after a hectic day of shopping. All these benefits have led a large number of national as
well as international café chains to expand their network via the franchise route. Let us find out the
factors that have encouraged the growth of café brands before reading about these brands and their
success journey.
Encouraging factors
· Dominance of youth segment: Beverages like coffee is especially preferred by youth. About 50 per cent
of the county’s population is 25 years or younger. This amounts to the growing popularity of cafes. This
trend is sure to pick up in future because researches show that the youth population is expected to
reach 55 per cent by 2015.
· Increase in disposable income: Students get a higher pocket money to spend on cafes with their
friends. Earning class also does not mind to spend a few extra bucks on having a delicious cup of coffee
in comfortable ambience of a café.
· Café’s as a social hub: With coffee culture brewing up pan India, it has become a great social hub for all
kind of people to chat and relax over a cup of coffee.
· Increase in private offices: The increasing MNC culture has also helped in the popularity of café chains.
Working professionals usually prefer to hang out at these places during their free time.
· Low cost kiosks: The foremost factor for growth of coffee culture is its low cost benefits. Any interested
entrepreneur can take a coffee kiosk due to low investment needed.
· Availability factor: Café outlets or kiosks are available at mostly all places. Customers can also opt for
‘take-away coffee’ if they are running out of time due to its easy availability.
· Franchisees pan India. It popularly operates through its kiosks which require 50-100 sq.ft area and a
location that has high footfalls.
· International players ready for foray. These are few of the brands which have become popular in café
industry via the franchise route. Costa Coffee, Gloria Jean’s Coffee is some international brands which
have made their mark in India.
2. With the purpose to investigate these precise factors that affect attitude and buying behavior of
type of consumers mainly the ones who prefer homemade coffee or branded coffee shops in India
Literature review
Evolution of a Coffee Café
It all began around 1000 A.D. when Arab traders began to cultivate coffee beans
In large plantations. They began to boil the beans creating a drink they called ‘qahwa’
This translates to ‘that which prevents sleep’. The drink became widely popular, and the
Need for coffee beans grew.
The Coffee Café Industry
The Coffee Café industry is currently one of the biggest and fastest growing
Sectors in business. The industry consists of a mix of individual cafés, hotel cafés and
Retail café chains.
The main bulk of revenue is earned by small, individual cafés, run mostly by
families and friends. It is a relatively unorganized sector. There are millions of such cafés
around the world, and they provide customers with a homely, casual experience.
The bulk of these cafés are mainly in Europe, where every little town or village has local
cafés, where people gather together for a conversation over coffee, or
just to be alone with their thoughts.
Individual Cafés
These cafés have been the birthplace and sanctuary for various creative
minds, revolutionaries and thinkers of our time. The most recent example
is the author J.K. Rowling, who has written most of the Harry Potter series of books,
sitting at her local café.
These cafés set themselves apart from retail chain cafés and hotel cafés because they
provide customers with a homely, classic appeal, which cannot be emulated.
Hotel Cafés:
Ever since the popularization of coffee, hotels all over the world started opening
24-hour coffee shops where visitors to the hotel could walk in for a cup of coffee and
some food at any time.
These coffeehouses are extremely important, because they provide international visitors
to the hotel with a universal drink- coffee. Any customer can walk into any major hotel in
the world, and enter the coffeehouse, and know what to expect. These cafés are not really
major players in the coffee café industry, but rather provide supplementary services to the
hotel industry.
Retail Café Chains:
The last, and the most organized sector in the coffee café industry, is the retail
café chain. Off late, these chains have become extremely popular and are growing at an
Ever-increasing pace. These retail chains have work with an organized structure of man,
material and money. The work on developing a recognized brand consistent to all their
outlets, which customers can easily relate to, wherever they go. They provide customers
3. with a standardized level of service and quality at each of their outlets.
India’s Growing Coffee Cafe’ Culture
Although tea is the main drink of choice in India, now hundreds of trendy western-influenced coffee
bars have emerged across India in Tier I and Tier II cities. The bean has become big business, so large
that it now competes against the once dominant tea on menus everywhere. For coffee fans, India offers
a few notable coffee bar chains. The significant growth in the number of coffee retail chains in India is
due to the changing lifestyle patterns of Indian middle class families and an increase in their disposable
income. Although the coffee bars’ contribution to India’s total coffee consumption may not be
significant, these coffee cafes have added more visibility to coffee and opened up an outlet for various
value added food items.
Barista Lavazza
One of India's largest franchised chains of coffee bars, the Barista Lavazza coffee company operates
around 205 outlets across India – 15 crème lounges and the rest espresso coffee bars. It plans to open
300 new stores over the next three years and has begun aggressively marketing its products outside
Indian borders into neighboring countries. Considered the Starbucks of the East, Barista offers many of
the same menu items like espresso, lattes, cappuccino and various pastries, in addition to basic coffee.
Despite being Indian, Barista sticks closely to its Italian roots by serving Italian coffees exclusively.
(www.barista.co.in),
Café Coffee Day
A later entrant than Barista, Café Coffee Day (CCD) offers nearly everything coffee-related, from take-
home products and equipment to fully operational stores. Since the grand opening of the first store in
Bangalore in 1996, Café Coffee Day has grown to become India's largest coffee retailer, with exports into
Europe and the Middle East. Like Barista Lavazza, CCD tends to be in every major Indian metro area.
Café Coffee Day currently has 810 outlets in over 100 cities. (www.coffeeday.com).
Costa Coffee
The British influence isn't entirely missing from Indian cities, as the UK's largest coffee retailer has been
setting up shops alongside other coffee competitors. The London-based Costa Coffee Company
specializes in imported Italian coffees and made-to-order coffee concoctions like risteretto (a coffee
stronger than espresso) and "Flat Whites" that feature custom barista designs in the froth.
Qwiky’s Coffee Pub
The coffee house offers about 101 varieties of coffee, serving drinks such as espressos, lattes,
cappuccinos, mochas, Americans and friazzos. It also offers grilled sandwiches, pastries and ice creams.
Qwiky's clothing brand, greeting cards, magazines, books and coffee
4. Café Pascucci
Italian coffee brand Café Pascucci has entered India with the launch of its outlet in Bangalore.
Madhura Beverages India Pvt. Ltd., the exclusive master franchisee for this brand in India, plans to set
up 60 outlets across the country.
Estimated Domestic Coffee Consumption (From 1995)
Calendar Year Quantity (in MT)
1995 50000
1996 50000
1997 50000
1998 50000
1999 55000
2000 60000
2001 64000
2002 68000
2003 70000
2004 75000
2005 80200
2006 85000
2007 90000
2008 94,400
2009 102,000
2010 (prov.) 108,000
Objectives
· To compare famous Coffee brands in relation to the factors that affect consumer buying
behavior. The main investigation is to find out what the most important factor of different
consumers when buying coffee.
· To find the reasons of Indian consumers for visit to a coffee shop ( such as ambience ,
social purpose, relaxing , or coffee itself )
5. · To develop a comparative analysis of consumer preferences towards the various coffee
shop brands available in Hyderabad.
· To analyze consumer preference of other food and merchandise items in addition to
coffee.
Research design
Type of research design
The types of basic research methodologies this unit will introduce you to are:
- Quantitative research
- Qualitative research
- Participatory research
Within this context, this unit also looks at:
- Conducting surveys
- Conducting interviews
- Conducting focus groups
Each of these methodologies helped us find out different things in different ways. We have used these
different methods
Quantitative research
Overview
Quantitative research (the word ‘quantitative’ comes from the word ‘quantity’) involves information or
data in the form of numbers. This allows us to measure or to quantify a whole range of things. For
example: the number of people who live below the poverty line; the number of children between
specific ages who attend school; the average spending power in a community; or the number of adults
who have access to computers in a village or town.
A common way of conducting quantitative research is using a survey. Surveys usually involve filling in a
questionnaire. The usefulness of a survey is that the information you get is standardized because each
respondent – the person who fills out the questionnaire – is answering the exact same questions. Once
you have enough responses to your questionnaire, you can then put the data together and analyze it in
a way that answers your research question – or what it is you want to know.
How these varied responses become numbers is in the way they are analyzed. From the example
questions above, one might be able to say: 20 out of the 30 (66%) respondents use a particular brand of
computer, while 5 (16%) use another. The remaining five respondents all used different brands of
computers which you would list. You might then want to provide some examples of how the computers
are used.
Surveys
Surveys can be conducted in a number of ways. The most important thing is to think clearly through the
kind of questions you want to ask, and to make sure that the responses will answer your research
question.
6. Besides being very careful about the kinds of questions we ask, and what the answers are telling us, it is
often helpful to limit the kinds of answers respondents can give. You may want to phrase the questions
in such a way that tick boxes can be used, so ‘yes’ or ‘no’ answers are possible, or the respondent fills in
numbers instead of descriptions.
Using the Internet for surveys
A good way to conduct a survey is through an online questionnaire. The Internet is useful for giving your
survey geographic reach. Using the Internet, you can survey many different people from all sorts of
countries – something that would not have been possible before or else too expensive. To do this, you
can either distribute a questionnaire via e-mail or create a simple online form. An easy way is to use
SurveyMonkey.com (http://www.surveymonkey.com). Survey Monkey is an excellent online tool that
helps you create and manage your own online survey easily.
With the online form, the responses will be e-mailed straight back to you. Many people don’t have a lot
of time to answer surveys, and online forms are often quicker for them to complete. However, keep in
mind who you want to reach. Do they have reasonably fast access to the Internet? Do they have access
to the Internet? You may want to provide a fax number for faxed responses, an e-mail address for e-mail
responses and an online form to cover all of your bases.
Don’t forget that you can even post a survey questionnaire using snail mail – although this is likely to be
quite costly, and you may not get that many responses (this often depends on how persistent you are,
how well the people you are surveying know you, or if you are offering them prizes or money for
completing the survey).
Using the Internet to conduct a survey may not be useful when surveying a specific community. Here
you may want to send a team of researchers into the street to collect responses or conduct a focus
group (see Research tip: Focus groups below).
Advantages of surveys[1]
- Good for comparative analysis.
- Can get lots of data in a relatively short space of time.
- Can be cost-effective (if you use the Internet, for example).
- Can take less time for respondents to complete (compared to an interview or focus group).
Disadvantages of surveys
- Responses may not be specific.
- Questions may be misinterpreted.
- May not get as many responses as you need.
- Don’t get full story.
Qualitative research
Overview
The aim of qualitative research is to deepen our understanding about something, and usually this means
going beyond the numbers and the statistics. Qualitative research helps us to give reasons why the
7. numbers tell us what they do. It is often contrasted to quantitative research – and they are very often
used together to get the ‘bigger picture’ of what we are trying to find out. Qualitative research helps us
‘flesh out the story’.
Face-to-face interviews and focus groups
The most common forms of qualitative research are face-to-face interviews and focus groups. Face-to-
face interviews are just that: Meeting someone in person and discussing various issues. The informant –
or person you are interviewing – may be an expert in a particular field (e.g. the editor of a newspaper) or
they may be someone who is affected by the issues you are researching (e.g. someone who is HIV
positive or who reads the media).
Although it is very important to develop a list of questions you want to ask someone, face-to-face
interviews usually involve more than ‘yes’ or ‘no’ answers. The point is to try to understand the
complexity of the issues you are researching. The nature of face-to-face interviews is that they are
usually quite discursive.
Focus groups involve discussions with two or more participants. While questions for focus groups need
to be prepared to guide and focus the discussions, the responses are often free-ranging, as the
participants are encouraged to explore the issues at hand in an in-depth way.
While focus groups and interviews will help you develop explanations for quantitative data, sometimes
they can provide you with quantitative data themselves. For example, you might find that 20% of the
participants in a focus group discussion did not like the way HIV/AIDS positive people were portrayed in
the media (quantitative data). Then you might find that the reasons (qualitative information) they gave
were that:
- They found it demeaning;
- They thought that it was insensitive;
- They thought that HIV/AIDS positive people were treated as ‘others’.
With focus groups and interviews, it is usual to write up the responses to your questions, to arrange and
analyse the responses in a careful and meaningful way, and to include the most relevant ones in your
research report.
Research Result Analysis:
Scaling techniques
Likert scale – the Likert scale used here is seven point Likert scale with the two poles as HIGHLY AGREE
to HIGHLY DISAGREE
Likert scaling is a bipolar scaling method, measuring either positive or negative response to a statement.
Sometimes an even-point scale is used, where the middle option of "Neither agree nor disagree" is not
8. available. This is sometimes called a "forced choice" method, since the neutral option is removed. The
neutral option can be seen as an easy option to take when a respondent is unsure, and so whether it is a
true neutral option is questionable. It has been shown that when comparing between a 4-point and a 5-
point Likert scale, where the former has the neutral option unavailable, the overall difference in the
response is negligible.
Likert scales may be subject to distortion from several causes. Respondents may avoid using extreme
response categories (central tendency bias); agree with statements as presented (acquiescence bias); or
try to portray themselves or their organization in a more favorable light (social desirability bias).
Designing a scale with balanced keying (an equal number of positive and negative statements) can
obviate the problem of acquiescence bias, since acquiescence on positively keyed items will balance
acquiescence on negatively keyed items, but central tendency and social desirability are somewhat
more problematic.
Sampling
Population and Sample Size
The population of this research constitutes a total of 200 respondents. Such respondents are randomly
selected of IBS Students and General Consumers in coffee shops in Hyderabad.
Survey Instrument
A structured attitude questionnaire is applied in the research.
Informal interviews are also facilitated, if possible.
Data Collection
Primary Data is gathered through survey method. This will serve as the primary source of data
collection. Meanwhile, secondary data include related literature about the subject of the research. Since
this is a combination of quantitative and qualitative research approaches, we opted to access all
potential sources and means of data collection so as to have variety and extensiveness.
Questionnaire Design
1. We will start by using dichotomous filter questions so that we consider only coffee drinkers as our
sample units
2. There are six identified factors that affect consumer buying behavior, identified through secondary
data from various research papers and articles .
3. Below are the attitude variables that we analyzed =
· QUALITY
· PRICE
· SITUATIONAL FACTORS
· COFFEE PRESENTATION
· LOCATION
· VARIETY
9. · AMBIENCE
Direct Interviews (Survey) with people in Coffee shops (Branded and Unbranded):
1. We randomize the interview process by selecting different customers from different coffee shops and
ask about coffee experience and their preferences.
2. We considered views of Coffee shop owners and servers for reference check, having error free
responses from customers.
From which 5 are measured on attitude rating scales (using numerical scale) and situational factors
(such as social purpose, relaxing or coffee itself) will be asked as a separate question
Sampling size
The sample size taken for the project is 200 respondents .It includes people from IBS Hyderabad and
those visiting coffee shops in Hyderabad city
Field work
The survey was conducted by visiting various coffee shops in the city ,such as Barista , CCD etc as well
as taking responses from the students in IBS campus .
Analysis method
Editing
Fully completed, consistent and reliable filled in questionnaires would only be considered for data
analysis. Responses would be adjusted if necessary for partially unfilled with due consideration of
previous responses within sample size. Deviations from objectives of problem statement are sorted out
and completely taken out of research analysis.
Coding:
The data that had been obtained has been coded into numerical data.
Since the replies obtained for variables were of the text format, they had been coded and had been
converted. For example, the Likert scale of strongly agree to strongly disagree has been coded as:
Strongly Agree – 5
Agree – 4
10. Neither agree nor disagree – 3
Disagree – 2
Strongly Disagree – 1
Analysis:
Factor Analysis:
Factor analysis has been done on variables such as preference, frequency, premium, reason, knick
knacks and beverages. The analysis has been performed to analyze the importance of these variables on
the consumer preference towards coffee shop. And the most influencing factor has been found out at
the end of analysis.
Discriminant Analysis:
Discriminant Analysis has been with independent variables like price, quantity, location, ambience, taste
and variety and the dependent variable was the different coffee shops. There were totally six categories
as per the coffee shop names. The discriminant equation has been formed at the end based on the
results obtained after analysis. Using this equation, the respondents can be easily classified into the
available six categories.
Factor Analysis:
Factor Analysis is done to basically identify the important factors or variables that influence the
measuring variable.
In this project, Factor Analysis is done to identify the important factors that influence the consumer
preference towards the coffee shop.
The variables that have been chosen for analysis are as follows:
Preference (Preference of Coffee shop over Home-made coffee)
Frequency (How frequently people drink coffee in a coffee shop)
Reason (Reason as to why do people go to coffee shop)
Beverages (Beverages other than coffee that people like to have in a coffee shop)
Knick Knacks (Food items that people like to eat along with coffee)
Premium Amount (Do people prefer to pay a premium amount in a branded coffee shop)
The Factor analysis has been done using SAS Enterprise Guide 4.2 and the analysis of the tables and
results obtained are as follows:
11. KMO value:
KMO value is a measure of adequacy. It is a measure that tells whether the number of samples taken for
analysis is sufficient or not. If the KMO value is greater than 0.5, the number of samples is sufficient. Else
the analysis has to be repeated by increasing the number of samples.
Kaiser's Measure of Sampling Adequacy: Overall MSA = 0.59658972
Preference Frequency Reason Premium Amount Knick Knacks Beverages
0.63089608 0.59348846 0.56644823 0.60319500 0.67119815 0.46908893
Table no. 1
The above mentioned table indicates the KMO factor obtained after the analysis with 200 samples.
Since the KMO value obtained (0.59658972) is greater than 0.5, the number of samples taken for the
analysis is sufficient.
Eigen Values:
Eigen value is a measure of sum of variances of the variables present in a factor. If the Eigen value for a
factor is greater than 1, it means that the factor is significant else it can be ignored.
Eigen values of the Correlation Matrix: Total
= 6 Average = 1
Eigen value Difference Proportion Cumulative
1 1.62876265 0.46635549 0.2715 0.2715
2 1.16240716 0.23130315 0.1937 0.4652
3 0.93110401 0.03803337 0.1552 0.6204
4 0.89307064 0.17436043 0.1488 0.7692
5 0.71871021 0.05276489 0.1198 0.8890
6 0.66594533 0.1110 1.0000
Table no. 2
The above mentioned table shows that the Eigen values for two factors are greater than one. Hence
only two factors will be retained by the MINEIGEN criterion and the rest would be ignored.
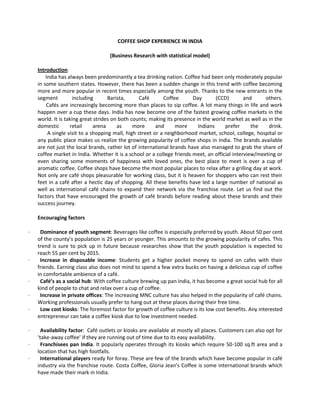
Scree Plot:
Scree plot shows the number of factors that are significant.
12. Graph 1
Factor Pattern:
Factor Pattern is a matrix showing the factor loadings i.e. the variances between the variables and the
factors.
Factor Pattern
Factor1 Factor2
Preference 0.71016 -0.02296
Frequency 0.53154 0.37027
Reason -0.29179 -0.58213
Premium Amount 0.69153 -0.12074
Knick Knacks -0.47445 0.17219
Beverages -0.23117 0.80105
Table no. 3
The above mentioned table shows the factor loadings between all the six variables and the two factors.
Rotated Factor Pattern:
The rotated factor pattern is obtained by rotating the factor pattern along the 90 degree axis. This is
done to remove the effect of unwanted variable i.e. the variables with least correlation.
The rotated factor pattern can be used to assign the variables to the suitable factors.
Rotated Factor Pattern
Factor1 Factor2
Preference 0.69585 0.14369
Frequency 0.43024 0.48427
Reason -0.14762 -0.63421
Premium Amount 0.70059 0.04427
Knick Knacks -0.50156 0.05650
Beverages -0.41203 0.72481
Table no. 4
In the above mentioned table, we can see the factor loadings of the six variables with the two factors.
Hence the variables can be assigned to the suitable factors in the following manner:
13. Factor1 Factor2
Preference Frequency
Premium Amount Reason
Knick Knacks Beverages
The above mentioned factors can be named based on the characteristics of the variables lying
underneath.
Factor 1 can be named as fondness related variables since the variables are related to what does a
consumer like or prefer in a coffee shop.
Factor 2 can be named as intellection related variables since the variables are related to when do a
consumer go to a coffee shop.
Factor Scoring Coefficients:
This is a measure of the importance of each variable i.e. how much does a variable influence the
measuring factor.
This can be calculated by the sum-product of each standardized scoring coefficient with its factor
pattern.
Standardized Scoring Coefficients
Factor1 Factor2
Preference 0.42855 0.08272
Frequency 0.24283 0.38601
Reason -0.05711 -0.52880
Premium Amount 0.43709 -0.00173
Knick Knacks -0.31786 0.07592
Beverages
-0.29910 0.63685
Table no. 5
Factor Pattern
Factor1 Factor2
Preference 0.71016 -0.02296
Frequency 0.53154 0.37027
Reason -0.29179 -0.58213
Premium Amount 0.69153 -0.12074
Knick Knacks -0.47445 0.17219
14. Factor Pattern
Factor1 Factor2
Beverages -0.23117 0.80105
Table no. 6
Preference 0.3043
Frequency 0.1291
Reason 0.0167
Premium 0.3023
Knick Knacks 0.1508
Beverages 0.0691
Hence from the values mentioned above it is clear that the Preference of whether people prefer coffee
shop or home-made coffee influences the consumer behavior most towards coffee shop.
Hence the factor analysis was helpful in identifying the factors that influence the consumers’ preference
towards the coffee shop.
Discriminant analysis
1. This table simply gives information about the sample size, number of independent variables and
categories or groups of dependent variable.
Total Sample Size 200 DF Total 199
Variables 6 DF Within Classes 194
Classes 6 DF Between Classes 5
2. This table indicates missing values if any. Since no. of observations = no. of observations used there
are no cases of missing values here.
Number of Observations Read 200
Number of Observations Used 200
15. 3. This table gives information about the dependent variable in particular. Since it was assumed that
number of observations is equal in all the categories hence prior probability = 0.166667. Prior
probability by default is set to 0.5 when we do not have information on the possible proportional
division of categories of the sample in hand. If we have prior information then SAS have options to set it
proportionately as per sample characteristics.
Class Level Information
Among the following, my
fav_0001
Variable
Name
Frequency Weight Proportion Prior
Probability
BARISTA BARISTA 41 41.0000 0.205000 0.166667
CCD CCD 82 82.0000 0.410000 0.166667
COSTA COFFEE COSTA COFFEE 42 42.0000 0.210000 0.166667
FIESTA FIESTA 7 7.0000 0.035000 0.166667
MINERVA COFFEE SHOP MINERVA COFFEE SHOP 7 7.0000 0.035000 0.166667
TESTA ROSSA CAFFÈ TESTA ROSSA CAFFÈ 21 21.0000 0.105000 0.166667
Table no. 7
4. The table below is equivalent to the “log determinants” table of SPSS. The difference being in SPSS
there are three rows of data whereas SAS gives data only on the last row of that table. “There are NO
BOX’s M Test results in SAS EG output”.
Pooled Covariance Matrix
Information
Covariance
Matrix Rank
Natural Log of the
Determinant of the
Covariance Matrix
6 3.93903
Table no. 8
5. The table below is similar to “Tests of equality of group means” of SPSS. Ignore the Total SD, Pooled
SD and Between SD columns. They are not of much use here. Concentrate on the last column of Pr>F. It
is same as Sig column of SPSS. This column actually indicates p values. As it is seen price, taste, quantity,
ambience, variety and location all are significant. This table provides strong statistical evidence of
significant differences between means of six categories of the dependent variable for all the
independent variables. That means all of them are assisting discriminating the dependent variable
categories. Next, the values of the R – Square column are taken into consideration. (If one subtracts “R-
Square value from 1 you get Wilks’ Lambda” values for individual variables.) R – Square value indicates
how much a single independent variable explains the proportion discrimination among dependent
variables categories. For e.g. Ambience explains 5.98% of discrimination in the dependent variable (it is
also the strongest discriminating independent variable
Univariate Test Statistics
F Statistics, Num DF=5, Den DF=194
Variable Total
Standard
Deviation
Pooled
Standard
Deviation
Between
Standard
Deviation
R-Square R-Square
/ (1-RSq)
F Value Pr > F
16. price 1.6265 1.6189 0.3288 0.0342 0.0354 1.37 0.2354
taste 1.2194 1.2226 0.1886 0.0200 0.0205 0.79 0.5555
quantity 1.6134 1.6250 0.1853 0.0110 0.0112 0.43 0.8250
ambience 1.4240 1.4009 0.3696 0.0564 0.0598 2.32 0.0448
variety 1.4886 1.4876 0.2647 0.0265 0.0272 1.06 0.3867
location 1.6289 1.6390 0.2023 0.0129 0.0131 0.51 0.7702
Table no. 9
6. The below table is similar to the “Eigen values table” of SPSS. The first column of canonical
correlation needs to be analyzed, the square value of 0.292793 = 0.085728 indicates the squared
canonical correlation column. This value indicates that the proposed discriminant function model
explains 8.57% of the discrimination that exists between the categories of the dependent variable.
Another way of saying (more technical and appropriate) is: approximately 8.57% of variance in the
Discriminant scores is explained by the differences among the groups.
Cano
nical
Corr
elati
on
Adju
sted
Cano
nical
Corr
elati
on
Appr
oxim
ate
Stand
ard
Error
Squa
red
Cano
nical
Corr
elati
on
Eigen values of Inv(E)*H
= CanRsq/(1-CanRsq)
Test of H0: The canonical correlations in th
e current row and all that follow are zero
Eig
en
val
ue
Diff
eren
ce
Prop
ortio
n
Cum
ulati
ve
Likeliho
od
Ratio
Approxi
mate
F Value
Num
DF
Den
DF
Pr >
F
1 0.29
2793
0.18
6753
0.064
811
0.08
5728
0.
09
38
0.03
47
0.47
88
0.47
88
0.82730
832
1.23 30 758 0.18
96
2 0.23
6103
0.17
6764
0.066
936
0.05
5745
0.
05
90
0.03
26
0.30
14
0.78
02
0.90488
171
0.97 20 631.
11
0.50
31
3 0.16
0412
. 0.069
064
0.02
5732
0.
02
64
0.01
13
0.13
49
0.91
50
0.95830
193
0.68 12 505.
63
0.76
77
4 0.12
2056
. 0.069
832
0.01
4898
0.
01
51
0.01
36
0.07
72
0.99
23
0.98361
234
0.53 6 384 0.78
48
5 0.03
8891
. 0.070
781
0.00
1513
0.
00
15
0.00
77
1.00
00
0.99848
748
0.15 2 193 0.86
41
Table no. 10
7. The below table is called Discriminant loadings matrix similar to interpretation as factor loadings. It
represents the correlation of each predictor variable with the Discriminant function. It is preferable to
comment on the strength of the predictors to discriminate among groups based on structure matrix
table as it is considered to be more accurate and free from multicollinearity issues that may be there
17. among variables. The naming of discriminating factor is done depending on the variables which load
highly on to the discriminating function.
This table is seen in combination with the Univariate Test Statistics table. First the significant
discriminating variables are determined then the discriminant loadings are checked to comment on the
strength of the individual variable’s discriminating power.
Pooled Within Canonical Structure
Variable Can1 Can2 Can3 Can4 Can5
price 0.199888 0.688744 0.055365 0.459585 0.516915
taste -0.139108 -0.218914 -0.743423 -0.247219 0.435684
quantity 0.041338 0.319034 -0.366515 0.269634 -0.481089
ambience -0.782018 -0.201699 0.022977 0.008311 0.163086
variety 0.119532 -0.633160 -0.205030 0.259332 0.199497
location 0.183970 0.151962 0.346928 -0.592870 0.192306
8. The Standardized coefficients allow comparing variables measured on different scales. The
coefficients with large absolute values correspond to variables with greater discriminating ability.
Pooled Within-Class Standardized Canonical Coefficients
Variable Can1 Can2 Can3 Can4 Can5
price 0.085171068 0.519161498 0.103813766 0.545930743 0.702351598
taste -0.047678641 0.136660609 -0.997160810 -0.526994939 0.423073841
quantity 0.048332853 0.439269152 -0.408407886 0.149549382 -0.750017915
ambience -1.081197585 0.052523964 0.320821120 0.173011118 0.130047778
variety 0.558835378 -0.811436501 0.251745336 0.628704704 0.229370505
location 0.337174077 0.191037661 0.425150885 -0.698316135 0.129086861
9. This table shows Group Centroids, the group means of predictor variables. If Discriminant scores are
used to for classification then they are useful in calculation of optimal cut off scores.
Class Means on Canonical Variables
Among the following, my
fav_0001
Can1 Can2 Can3 Can4 Can5
BARISTA -0.033780254 0.135037103 -0.022885540 -0.055598468 0.069801548
CCD 0.081639110 -0.225347494 0.092505485 0.044394331 -0.003944585
COSTA COFFEE 0.003206959 0.382693089 0.058677253 0.066406709 -0.033620752
FIESTA -0.118319509 -0.028275201 0.166074582 -0.587293723 -0.064305976
MINERVA COFFEE SHOP -1.504012439 -0.195732556 -0.189713147 0.068696815 -0.021179645
TESTA ROSSA CAFFÈ 0.281534033 -0.074432482 -0.426005586 -0.024747683 -0.025139838
18. 10. In this table the rows are the observed categories of the dependent and the columns are the
predicted categories. When prediction is perfect all cases will lie on the diagonal. The percentage of
cases on the diagonal is the percentage of correct classifications. The cross validated set of data is a
more honest presentation of the power of the discriminant function than that provided by the original
classifications and often produces a poorer outcome.
Linear Discriminant Function for Among the following, my fav_0001
Variable BARISTA CCD COSTA
COFFEE
FIESTA MINERVA COFFEE
SHOP
TESTA ROSSA
CAFFÈ
Constant -6.93204 -6.56254 -7.10828 -6.32001 -7.63554 -6.84312
price 1.46664 1.36627 1.54951 1.18446 1.27497 1.35942
taste 0.42324 0.21572 0.29458 0.43694 0.49461 0.67016
quantity 0.42296 0.34321 0.52947 0.34177 0.38518 0.52369
ambience 0.70110 0.63043 0.70598 0.72538 1.79210 0.35256
variety 0.77950 1.06985 0.70773 0.62342 0.41789 0.94239
location 0.83828 0.80154 0.83578 1.06683 0.39388 0.75354
11. The following two tables are classification matrix. The first one is for analysis sample. The second
one is for validation of the proposed model.
Diagonal values should be checked upon here for improvement in predictions. Using the diagonal values
the hit ratio is calculated. It measures how correctly the model has predicted the number of
respondents would go to a specified coffee shop.
Hit Ratio = (2+15+16+2+4+6)/200 = 27.5%
Number of Observations and Percent Classified into Among the following, my fav_0001
From Among the
following, my
fav_0001
BARISTA CCD COSTA
COFFEE
FIESTA MINERVA
COFFEE
SHOP
TESTA
ROSSA
CAFFÈ
Total
Barista 2
4.88
8
19.51
10
24.39
8
19.51
5
12.20
8
19.51
41
100.00
Ccd 4
4.88
25
30.49
17
20.73
13
15.85
9
10.98
14
17.07
82
100.00
20. TESTA ROSSA CAFFÈ 1
4.76
5
23.81
5
23.81
3
14.29
2
9.52
5
23.81
21
100.00
Total 7
3.50
41
20.50
50
25.00
34
17.00
26
13.00
42
21.00
200
100.00
Priors 0.16667 0.16667 0.16667 0.16667 0.16667 0.16667
Focus Group Interviews Analysis:
Focus Group Discussion:
No of Focus Group sessions: 2
No .of people per session: 7
Participant’s Age group/ education: 20-28/Min Bachelors Degree
Total No. of people: 14
Time and Dates: January 28 2012 12:30 to 2:00PM and January 29th
2012 1:30PM to 3:00PM
Places: IBS Hyderabad, Chandanagar hall
Purpose of conducting Focus group:
• To collect qualitative data about coffee shop experience.
• To determine feelings, perceptions and manner of thinking of participants regarding coffee
shop products, services, programs or opportunities ( Coffee shops included were CCD, BARISTA,
COSTA COFFEE, FIESTA, MINERVA COFFEE SHOP, TESTA ROSSA CAFFÈ)
• Attitudes and perceptions are developed in part by interaction with other people
• To promote self-disclosure among participants towards branded coffee shops.
• Participant responses were taken for research purpose only.
Methods used for selecting people for focus group interviews:
1. Nominations
2. Random phone screening
21. Incentives for Participants
CCD, barista Coffee shop coupons given
Moderator Skills:
• Is mentally prepared
• Selected appropriate location(IBS Hyderabad, Chandanagar hall road no 2)
• Records the discussion (Time 2:30 PM 24-1-2012, Time 1:00 26-1-2012)
• Used purposeful small talk
• Had a smooth & snappy introduction
• Used pauses and probes
• Used subtle group control
• Controls reactions to participants
• Selected the right moderator
• Used an assistant moderator
• Used appropriate conclusion
Questions Asked in Focus group Discussion
• Used open-ended questions with respect to coffee shop and its products
• Avoided dichotomous questions
• "Why?" is rarely asked
• Used "think back" questions. Analysis type of questions were asked to know perceptions
• Carefully prepared focus questions
• Asked uncued(random) questions first, cued(standard) questions second
• Mostly considered standardized questions (Well prepared questionnaire) with respect to
analysis.
Discussion:
22. Started with formal introduction of every one. Moderator started with general questions about coffee
and people interest on visiting branded coffee shops and homemade coffee. People were asked likes
and dislikes about coffee and further made them to identify certain coffee flavors. People responses
with respect to open ended questions about branded coffee shops were recorded. People perceptions
of coffee shop snacks, ambience, and service were individually asked and perceptions are noted. Audio
and video have been recorded for later research analysis part. At the end of interviews people who
made active participations were given CCD and barista coupons.
Direct Interviews for randomized responses:
Total no of people interviewed: 35
Places interview: CCD, Barista costa, Minerva, fiesta, testa coffee
Purpose:
Thematizing, designing the study so it addresses the research questions, the interview itself,
transcribing, analyzing, verification and reporting. The research interview is characterized by a
methodological awareness of question forms, a focus on the dynamics of interaction between
interviewer and interviewee, and also a critical attention to what is said and their behavior towards
coffee shops.
Conclusion:
Factor Analysis
From the factor analysis report, it is known that the Preference of whether people prefer coffee shop or
home-made coffee influences the consumer behavior most, towards coffee shop. It was helpful in
identifying the factors that influence the consumers’ preference towards the coffee shop. The factors
that were identified are fondness related variables and intellection related factors.
Discriminant Analysis
With the results form SAS and manually calculated discriminant scores, it can be concluded that the data
is categorized into six groups CCD, BARISTA, COSTA COFFEE, FIESTA, MINERVA COFFEE SHOP, TESTA
ROSSA CAFFÈ. Any new entry in the respondent sheet can be guessed that which coffee shop the new
entrant would prefer.
For example: A new entrant X defines his preference as price and quantity, the results would give out
the inference that he refers to CCD.
Thus, the discriminant equation obtained is:
D = -7.63554 + (1.18446*price) + (0.67016*taste) + (0.52947*quantity) + (1.7921*ambience) +
(1.06985*variety) + (1.06683*location)
23. Hence, discriminate analysis has helped to determine the choice of coffee shop based on the preference
of the consumers for variables like price, quantity, location, ambience, variety, taste.
Focus Group interview analysis
All the results are compiled and made into percentage format according to the two focus group
interviews taken.
70% of the respondents feel they visit branded coffee shops only for meetings and get together.
30% of respondents feel Branded coffee shops were costly. Feels that more coffee variants need to be
introduced to attract people to coffee shops.
80% of the participants feel that location of branded coffee shops matters while choosing coffee shops
to visit.
50% of the participants feel taste matters most when choosing branded coffee shops. All of them prefer
salted snacks when consuming coffee.
70% feel visiting coffee shops are for just relaxing and time pass. Participants are inclined mostly of job
relaxing and just another shop for time pass.
80% of the people feel branded coffee shops needs improvement on service part.
70% of the people feel visiting a branded coffee shop is a status symbol, they were proud of visiting
branded coffee shop.
Direct interview responses:
70 % feel branded coffee shops are costlier.
50 % feel that snacks provided were not at par with standard of their coffee products.
80% of the people feel visiting coffee shops is for relaxing and meeting.
70% people didn’t prefer to visit coffee shop which are far from their working places and homes
60% people drink coffee just for fun.
Recommendation:
Branded coffee shops should prefer locations nearer to big corporate companies so that employees
feel visiting for relaxing from job tensions and meetings.
Branded coffee shops need to reduce their cost overall and have many alternative variants of coffees
and snacks.
Branded coffee shops should never loose their core competency on taste while serving hot coffee for
customers.
We use inferential statistics (through SPSS) in order to draw a concrete conclusion. Inferential statistics
is use to be able to know a population’s attribution through a direct observation of the chosen
population or simply the sample. This is because it is easier to observe a portion or a part than observe
the whole population. However using a sample has also its own disadvantages; hence, there is a need to
choose the most suitable sample from any population.
24. Result of the study will be put in tables and graphs for easy understanding of the findings of the
research.
References
http://indiacoffee.org/indiacoffee.php?page=CoffeeData
http://www.hawaiifruit.net/E09MXMAKAI_Appendix4_CoffeeAnnual2010.pdf
http://coffeetea.about.com/od/reviews/Coffee_and_Tea_Drink_Equipment_and_Media_Reviews.htm