
Recomendados
Mais conteúdo relacionado
Semelhante a Aba Deansworksp Feb2008
Semelhante a Aba Deansworksp Feb2008 (20)
Último
Último (20)
Aba Deansworksp Feb2008
- 3. Tests Administered, Applicants and First Year Students ABA-Approved Law Schools 1966-67 - 2006-07 Admission Year Tests Administered ABA Applicants First Year Law Students Tests, Applicants, Students Note: Due to changes in data collection methods, ABA applicant data beginning in 1999-2000 is not directly comparable to prior applicant data.
- 4. Where Are Law School Applicants Coming From? % Change Fall 2006 to Fall 2007 As of: Preliminary End-of-Year (8/8/07) NORTHWEST 2,413 -7.1% MOUNTAIN WEST 4,213 -5.0% SOUTH CENTRAL 8,109 -4.3% SOUTHEAST 11,485 -3.0% MIDSOUTH 10,305 -4.8% NORTHEAST 14,041 -3.9% NEW ENGLAND 4,377 -2.8% GREAT LAKES 12,905 -5.9% MIDWEST 3,192 -4.3% FAR WEST 10,293 -5.5% National Volume & % Change: 81,333/-4.6% Total Volume & % Change: 83,481/-4.3% Applicant counts based on region of state of permanent residence
- 5. Where Are Law School Applications Going To? % Change Fall 2006 to Fall 2007 As of: Preliminary End-of-Year (8/8/07) NORTHWEST 13,277 +3.0% FAR WEST 75,022 -3.3% MOUNTAIN WEST 16,374 -4.4% SOUTH CENTRAL 34,927 -3.8% SOUTHEAST 51,756 +3.4% MIDSOUTH 92,613 -1.2% NORTHEAST 90,711 -2.6% NEW ENGLAND 43,480 -1.5% GREAT LAKES 80,912 -7.0% MIDWEST 15,946 +0.5% Total Volume & % Change: 515,018/-2.4% Application counts based on region of each law school
- 6. Where Are Law School Applicants Coming From? % Change Fall 2007 to Fall 2008 As of: 02/01/08 NORTHWEST 1,705 -6.1% MOUNTAIN WEST 2,934 +3.0% SOUTH CENTRAL 5,148 -0.5% SOUTHEAST 6,601 -0.6% MIDSOUTH 6,842 -1.6% NORTHEAST 8,678 -3.1% NEW ENGLAND 2,607 -6.4% GREAT LAKES 7,999 -5.2% MIDWEST 1,917 -6.0% FAR WEST 7,588 +2.5% National Volume & % Change: 52,019/-2.0% Total Volume & % Change: 53,476/-1.7% Applicant counts based on region of state of permanent residence
- 7. Where Are Law School Applications Going To? % Change Fall 2007 to Fall 2008 As of: 02/01/08 NORTHWEST 9,170 -2.8% FAR WEST 58,992 +6.9% MOUNTAIN WEST 11,606 +6.4% SOUTH CENTRAL 21,853 +3.7% SOUTHEAST 29,362 -0.2% MIDSOUTH 66,083 -1.6% NORTHEAST 61,769 -0.4% NEW ENGLAND 30,639 -2.4% GREAT LAKES 56,616 +2.3% MIDWEST 9,722 -4.4% Total Volume & % Change: 355,862/+1.0% Application counts based on region of each law school
- 8. All and White Applicants/Matriculants 1987-1988 through 2006-2007 Based on Applicants Who Provided Their Ethnicity Note: Due to changes in data collection methods, ABA-applicant data beginning in 1999-2000 is not directly comparable to prior applicant data. All Applicants All Matriculants White Applicants White Matriculants
- 9. Applicants/Matriculants Who Were Minorities 1987-1988 through 2006-2007 Based on Applicants Who Provided Their Ethnicity Note: Due to changes in data collection methods, ABA-applicant data beginning in 1999-2000 is not directly comparable to prior applicant data. Black/African American Asian/Pacific Islander Hispanic/Latino American Indian/Alaskan Native
- 10. Percentage Change in Applicants and Matriculants from Fall 2003 to Fall 2007 Percentage Change
- 14. Percentages of Various Populations
Notas do Editor
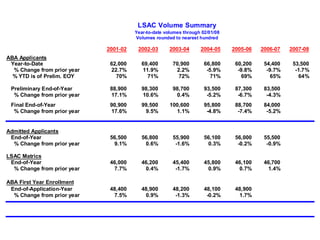
- Source: sources for Usual volume slide shows.xls “lsac volume summary”