Recomendados

Recomendados
Mais conteúdo relacionado
Mais de uaocs
Mais de uaocs (14)
Sust4103 capstone project poster bednar
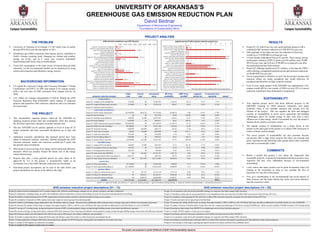
- 1. UNIVERSITY OF ARKANSAS’S GREENHOUSE GAS EMISSION REDUCTION PLAN David Bednar Department of Mechanical Engineering Foundations of Sustainability Minor PROJECT ANALYSIS GHG emissions avoided per year (MT CO2e/yr) payback period of GHG emission reduction projects (yr) THE PROBLEM 0 2 4 6 8 10 12 14 16 18 RESULTS 0 5,000 10,000 15,000 20,000 25,000 30,000 35,000 40,000 project 01: computer power management 0.374 University of Arkansas (UA) emitted 171,585 metric tons of carbon project 01: computer power management 2,328.43 project 02: campus building energy use… 0.918 Project 01, 02, and 05 are low cost, quick payback projects with a project 02: campus building energy use policy 949.63 dioxide (MTCO2e) into the atmosphere in 2011. project 03: district energy cogeneration 20,684.18 project 03: district energy cogeneration 13.819 combined GHG emission reduction of 4,700 MTCO2e per year. project 04: trayless dining 0.000 project 04: trayless dining 69.89 After payback, in less than one year, the reduction in electricity Greenhouse gas (GHG) emissions from human activity contribute to project 05: building energy dashboard 1,424.45 project 05: building energy dashboard 0.326 project 06: bicycle parking project 06: bicycle parking N/A would save UA $390,000 on average per year. Earth’s climatic warming trend, changing our climate and weather, 46.67 project 07: ESPCs (educational & general… 16.019 project 07: ESPCs (educational & general buildings) 23,503.15 project 08: ESPCs (auxiliary buildings) 15.959 UA has already undertaken Projects 07 and 08. These energy saving raising sea levels, and as a worst case scenario, potentially project 08: ESPCs (auxiliary buildings) 5,454.08 project 09: increased recycling project 09: increased recycling 207.64 N/A performance contracts (ESPCs) which cost $52 million, save 29,000 transforming Earth from a host to hostile planet. project 10: food waste to compost 3.00 project 10: food waste to compost N/A project 11: campus WVO to biodiesel 32.72 project 11: campus WVO to biodiesel 2.333 MTCO2e per year, and will save $740,000 on average per year after Fossil fuel consumption is the main source of human derived GHG project 12: on-campus wind power generation 26.50 project 12: on-campus wind power… project 13: on-campus photovoltaic array 8.780 9.868 the payback period has been realized. project 13: on-campus photovoltaic array emissions, yet the environmental burden can be minimized by using project 14: forest sequestration 27.65 3,660.00 project 14: forest sequestration 12.044 Project 03, although significant at $13 million, is less than the ESPCs project 15: offsets for commercial air travel N/A conservation practices and alternative energy sources. project 15: offsets for commercial air travel 9,157.29 project 16: offsets for commuter travel N/A while offering a comparable payback period and emission reductions project 16: offsets for commuter travel 18,081.06 project 17: waste oil to space heat -6.18 project 17: waste oil to space heat 3.827 of 20,600 MTCO2e per year. project 18: bicycle parking (phase 2) 46.67 project 18: bicycle parking (phase 2) project 19: convert buses to run CNG N/A 12.393 Forest sequestration is attractive as well, but this project assumes that project 19: convert buses to run CNG 141.55 project 20: clean energy from SWEPCO 8,027.56 project 20: clean energy from SWEPCO N/A emission offsets are being considered and would otherwise be BACKGROUND INFORMATION project 21: on-campus photovoltaic array (phase 2) project 22: clean energy from area wind farms 276.55 18,992.69 project 21: on-campus photovoltaic array… project 22: clean energy from area wind… N/A 14.235 purchased and therefore savings would be realized. project 23: forest sequestration (phase 2) 36,600.00 project 23: forest sequestration (phase 2) 12.044 UA signed the American College and University Presidents’ Climate project 24: renewable energy certificates 14,244.51 project 24: renewable energy certificates N/A Even if every single project in the GHGERP was implemented, UA’s project 25: parking & carpool incentives - Commitment (ACUPCC) in 2007 and intends to be climate neutral, project 25: parking & carpool incentives - *N/A: project does not realize a payback period in 30 year project lifetime. campus would still be a net emitter of GHGs as only 93% of current with a net zero sum of GHG emissions from campus activity, by emissions would have been eliminated or sequestered. 2040. initial annual net present MT CO2e $/MT CO2e payback % towards CO2e emission reduction project cost cost value avoided/yr avoided period (yr) neutrality status** UA’s Office for Campus Sustainability (UAOCS) drafted the GHG campus policies: - - - - - - - - SUSTAINABILITY Emission Reduction Plan (GHGERP) which outlines 25 proposed project 01: computer power management $75,000 $0 $5,881,026 2,328.43 -84.19 0.374 1.33% c projects and quantifies GHG emission reductions and cost estimates project 02: campus building energy use policy $75,000 $0 $2,354,125 949.63 -82.63 0.918 0.54% c This capstone project shows that these different projects in the for each project. project 25: parking & carpool incentives - - - - - - - d GHGERP, focusing on GHG emission reductions, also make conservation and efficiency: - - - - - - - - economic sense if you consider expenses and savings over the lifetime of the project. This ties together the built and managed project 03: district energy cogeneration $12,828,000 $450,732 $3,724,858 20,684.18 -6.00 13.819 11.78% c THE PROJECT project 04: tray less dining $0 $0 $421,393 69.89 -200.98 0.000 0.04% a systems of sustainability as newer power generation and building technologies allow for cleaner energy to start with, then a more This sustainability capstone project improved the GHGERP by project 05: building energy dashboard $40,000 $4,000 $3,483,687 1,424.45 -81.52 0.326 0.81% c efficient use of that energy, which if accounted for over the project’s updating proposed project data and assumptions while also turning project 06: bicycle parking $150,000 $0 $699,431 46.67 -499.56 N/A 0.03% c lifetime shows positive economic returns. the old static report into a dynamic economic analysis tool. project 07: ESPCs (educational & general buildings) $42,000,000 $0 $18,120,074 23,503.15 -25.70 16.019 13.39% a project 08: ESPCs (auxiliary buildings) $9,700,000 $0 $4,251,309 5,454.08 -25.98 15.959 3.11% a The natural systems of sustainability are a major factor in this The new GHGERP can be quickly updated in Excel to keep all 25 project 09: increased recycling $100,000 $28,000 -$482,151 207.64 77.40 #N/A 0.12% a project as the main goal of the project is to reduce GHG emissions to project proposals and their associated calculations up to date and project 10: food waste to compost $8,000 $10,000 -$209,890 3.00 2332.11 #N/A 0.00% b create a climate neutral campus. valid. project 17: waste oil to space heat $12,500 $0 $126,020 -6.18 N/A 3.827 0.00% a The social systems of sustainability are also pertinent because Additional economic calculations like payback period have been project 18: bicycle parking (phase 2) $250,000 $0 $599,431 46.67 -428.14 N/A 0.03% c universities offer a stage where projects like these can resonate and added to determine projects’ economic viability alongside the GHG project 19: convert buses to run CNG $1,850,000 $27,500 $3,651,433 141.55 -859.85 12.393 0.08% c grow, reaching out and informing other groups about what is possible emission reduction, initial cost, emissions avoided per $ spent, and renewable energy: - - - - - - - - and what is economically viable. net present value calculations. project 11: campus WVO to biodiesel $20,000 $3,000 $452,945 32.72 -461.44 2.333 0.02% a project 12: on-campus wind power generation $26,164 $0 $41,611 26.50 -52.35 9.868 0.02% c Most projects accrue savings from energy conservation and efficiency measures which can actually finance the initial cost of the energy project 13: on-campus photovoltaic array $23,845 $0 $46,895 27.65 -56.52 8.780 0.02% c COMMENTS project 20: clean energy from SWEPCO $0 $62,845 -$1,931,341 8,027.56 8.02 #N/A 4.57% e conservation project. project 21: on-campus photovoltaic array (phase 2) $425,477 $0 $281,926 276.55 -33.98 14.235 0.16% c Before I started this project I was under the impression that Projects that offer a short payback period are more likely to be project 22: clean energy from area wind farms $0 $377,070 -$11,312,087 18,992.69 19.85 #N/A 10.82% c sustainable projects, or green/environmental/restoration projects were approved by UA as the project is economically viable as an sequestration: - - - - - - - - expensive but they were undertaken because of environmental investment even if the GHG emission reductions are discounted. project 14: forest sequestration $1,110,000 $0 $1,001,566 3,660.00 -9.12 12.044 2.08% c stewardship. Individual project descriptions can be seen in the table below and project 23: forest sequestration (phase 2) $11,100,000 $0 $10,015,659 36,600.00 -9.12 12.044 20.84% c I now realize that many projects can be good investments when just purchase offsets: - - - - - - - - looking at the economics as long as you consider the flux of project calculations are shown in the tables to the right. project 15: offsets for commercial air travel $0 $91,573 -$2,747,188 9,157.29 10.00 #N/A 5.22% c payments over the life of the project. project 16: offsets for commuter travel $0 $180,811 -$5,424,317 18,081.06 10.00 #N/A 10.30% c project 24: renewable energy certificates $0 $188,535 -$5,656,043 14,244.51 13.24 #N/A 8.11% c Now give consideration to the environmental and social aspects of totals: $79,793,986 $1,424,065 $27,390,371 163,979.70 93% these projects and the triple bottom line looks even more attractive status**: a - approved, funded, and underway; b - approved, funding pending; c - approval pending, funding pending; d - proposed, detailed research pending; e - external decision process than the economics alone. GHG emission reduction project descriptions (01 – 13) GHG emission reduction project descriptions (14 – 25) Project 01 improves power management for IT systems campus wide. Software would manage computer servers, printers, monitors, and other components. Project 14 is to purchase a pine forest and sustainably manage it to sequester and offset campus GHG emissions. Project 02 implements a building energy use policy that establishes uniform temperature set points and building use times for all general and educational use buildings. Project 15 introduces a direct pay-as-you-go payment by every department in the university that will offset GHG emissions for about $10 per MT CO2e. Project 03 installs a combined heat & power (CHP) cogeneration system to produce electricity and heat for district energy use on campus. Project 16 introduces a direct payment for the university to offset GHG emissions caused by commuter travel for about $10 per MT CO2e. Project 04, initiated by Chartwells in 2008, reduces food waste simply by removing trays from the dining halls. Project 17 burns used motor oil for space heat in the Bus Barn. Project 05 installs Lucid building energy dashboards in the 20 residence halls on campus. Research shows dashboards make residents aware of energy usage and is effective in promoting conservation. Project 18 increases the number of bike loops on campus from approximately 1,500 to 2,000 at a cost of $100 per bike loop, and adds an additional covered bike shelter at a cost of $200,000. Project 06 increases the number of bike loops on campus from approximately 1,000 to 1,500 at a cost of $100 per bike loop, and adds an additional covered bike shelter at a cost of $100,000. Project 19 replaces 10 buses of the Razorback Transit fleet with new compressed natural gas (CNG) buses costing $110,000 each. Initial cost also includes $750,000 towards a CNG fueling station. Project 07 consists of 3 existing energy savings performance contracts (ESPCs) which guarantee energy savings through building energy conservation and efficiency measures. Project 20 purchases clean energy from SWEPCO at an additional cost over fossil fuel derived power. Project 08 consists of energy savings performance contracts (ESPCs)for Arkansas Union, Housing, and Athletics which guarantee energy savings through building energy conservation and efficiency measures. Project 21 installs 250 kW capacity of solar power on campus. Project 09 increases campus recycled material from 430 tons per year to 500 tons per year. (Paper, cardboard, cans, & bottles) Project 22 purchases electricity from area wind farms at $.015/kWh more than electricity from SWEPCO. Project 10 installs a composting tub for dining hall food waste and allocates a part time worker to collect food waste and maintain the tub. Project 23 is to purchase a pine forest and sustainably manage it to sequester and offset campus GHG emissions. Project 11 began production in January 2009 and is processing waste vegetable oil (WVO) from the 4 dining halls into biodiesel to be used by university. Project 24 purchases renewable energy certificates (RECs) to offset GHG emissions and support regional projects that implement clean energy production. Project 12 installs 25 kW capacity of wind power on campus. Project 25 will consider a wide range of parking and carpool incentives to reduce emissions from commuter travel. Project 13 installs 25 kW capacity of solar power on campus. This poster was prepared in partial fulfillment of SUST 4103 Sustainability Capstone