
Recomendados
Mais conteúdo relacionado
Destaque
Semelhante a 會訊2012 08-31
Semelhante a 會訊2012 08-31 (20)
會訊2012 08-31
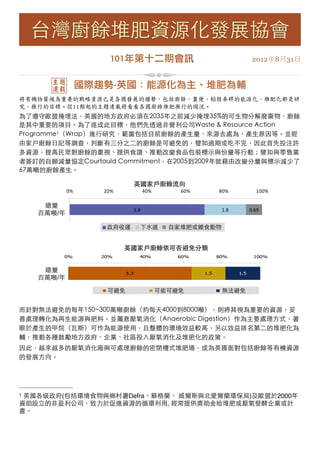
- 1. 台灣廚餘堆肥資源化發展協會 101年第十二期會訊 2012年8月31日 主題 國際趨勢-英國:能源化為主、堆肥為輔 連載 將有機物質視為重要的戰略資源已是各國發展的趨勢,包括廚餘、糞便、稻殼麥稈的能源化,堆肥化都是研 究、推行的目標。從11期起的主題連載將看看各國廚餘堆肥推行的現況。 為了遵守歐盟掩埋法,英國的地方政府必須在2035年之前減少掩埋35%的可生物分解廢棄物,廚餘 是其中重要的項目。為了達成此目標,他們先透過非營利公司Waste & Resource Action Programme1(Wrap)進行研究,範圍包括目前廚餘的產生量、來源去處為、產生原因等。並經 由家戶廚餘日記等調查,判斷有三分之二的廚餘是可避免的,譬如過期或吃不完,因此首先投注許 OfOf this, 5.8 million tonnes per year(70%) is collected by Local Authorities (Figure C) ––mainly in the residual this, 5.8 million tonnes per year (70%) is collected by Local Authorities (Figure C) mainly in the residual waste stream (general bin) and food-waste kerbside collections. A further 1.8 million tonnes per year is disposed 多資源,提高民眾對廚餘的重視、提供食譜、推動改變食品包裝標示與份量等行動;譬如與零售業 waste stream (general bin) and food-waste kerbside collections. A further 1.8 million tonnes per year is disposed of via the sewer . 2 of via the sewer 2. 者簽訂的自願減量協定Courtauld Commitment,在2005到2009年就藉由改變分量與標示減少了 Figure C: Weight of food and drink waste generated in the UK, split by disposal route 67萬噸的廚餘產生。 Figure C: Weight of food and drink waste generated in the UK, split by disposal route 0% 20% 40% 60% 80% 100% 英國家戶廚餘流向 0% 20% 40% 60% 80% 100% Total 5.8 1.8 0.69 總量 Total LA col l ected 5.8 Sewer 1.8 Home composti ng / fed to ani mal s 0.69 百萬噸/年 Figures within bar state waste in millions of tonnes per year 政府收運 下水道 two-thirds of the / fed to animals 自家堆肥或餵食動物 5.3 million tonnes per year is avoidable – approximately Home composting 8.3 million tonnes (Figure D). The LA collected Sewer remaining 3 million tonnes per year is split equally between unavoidable and possibly avoidable waste. Figures within bar state waste in millions of tonnes per year Figure D: Weight of food and drink waste generated in the UK, split by avoidability 英國家戶廚餘依可否避免分類 5.3 million tonnes per year is avoidable – approximately two-thirds of the 8.3 million tonnes (Figure D). The 0% 20% 40% 60% 80% 100% remaining 3 million tonnes per year is split equally between unavoidable and possibly avoidable waste. 總量 5.3 1.5 1.5 Figure D: Weight of food and drink waste generated in the UK, split by avoidability 百萬噸/年 0% 20% 40% 60% 80% 100% 可避免 Avoidable 可能可避免 Possibly Avoidable 無法避免 Unavoidable Figures within bar state waste in millions of tonnes per year 5.3 1.5 1.5 Of the avoidable food and drink waste, 2.2 million tonnes is leftover after cooking, preparing or serving and 2.9 而針對無法避免的每年150~300萬噸廚餘(約每天4000到8000噸),則將其視為重要的資源,妥 million tonnes is not used in time (Figure E). 善處理轉化為再生能源與肥料。並屬意厭氧消化(Anaerobic Digestion)作為主要處理方式,著 Figure E: Weight of avoidable food and drink waste generated in the UK, split by reason for disposal 眼於產生的甲烷(瓦斯)可作為能源使用,且整體的環境效益較高,另以效益排名第二的堆肥化為 Avoidable Possibly Avoidable Unavoidable 0% 20% 40% 60% 80% 100% 輔,推動各種鼓勵地方政府、企業、社區投入厭氧消化及堆肥化的政策。 Figures within bar state waste in millions of tonnes per year 因此,越來越多的厭氧消化廠與可處理廚餘的密閉槽式堆肥場,成為英國面對包括廚餘等有機資源 2.2 2.9 0.24 Of the avoidable food and drink waste, 2.2 million tonnes is leftover after cooking, preparing or serving and 2.9 的發展方向。 million tonnes is not used in time (Figure E). Cooked, prepared or served t oo much Not used in t ime Ot her Figure E: Weight of avoidable food and drink state waste in millions of tonnes per year Figures within bar waste generated in the UK, split by reason for disposal 0% 20% 40% 60% 80% The food and drink waste generated comprises many different groups of food and drink (Figure F). The most 100% prominent by weight are fresh vegetables and salad, which make up almost a quarter of arisings, drink (16%), 1英國各級政府(包括環境食物與鄉村署Defra、蘇格蘭、 威爾斯與北愛爾蘭環保局)及歐盟於2000年 fresh fruit (13%) and bakery (10%). 資助設立的非盈利公司,致力於促進資源的循環利用, 經常提供獎助金給堆肥或厭氧發酵企業或計 2.2 2.9 0.24 The updated figures relating to the sewer have an influence on the estimate of the proportion of purchases that 畫。 are wasted. This is largely due to a lower proportion of liquid foods and drinks being wasted, compared to solid foods. There is also a large variation in the proportion of purchases that are wasted between different types of food and drink. For instance, 7% of or served too much wasted, 36% of used in time over 50% of lettuce and Cooked, prepared milk purchases are Not bakery, and Other leafy salads (by weight). Figures within bar state waste in millions of tonnes per year 2 Excluding tap water added in the home to constitute foods such as tea, coffee and gravy
- 2. 英國的堆肥與厭氧消化場成長趨勢 2008年 2008年 2009年 2009 2011 2012 資源場類型 家數 處理量(噸/年) 家數 處理量(噸/年) 家數 家數 開放堆置式 166 3,816,000 116 3,117,000 無資料 無資料 堆肥場 密閉槽式 28 852,000 62 2,078,000 無資料 無資料 堆肥場 厭氧消化廠 1 113,000 17 105,000 54 78 參考資料: 1. Friends of the Earth, Briefing Food waste collection, 2007 2. Hogg et al., Dealing with Food Waste in the UK, 2007, 3. Wrap, Understanding Food Waste, 2007 4. Wrap, Household Food and Drink Waste in the UK,2009 5. Love Food Hate Waste 網站: http://www.lovefoodhatewaste.com 6. Defra, Government Review of Waste Policy in England, 2011 7. Wrap, A study of the UK organics recycling industry, 2009