Population Dynamics of Small Mammals in Virginia Forests: Testing the Impacts of Weather, Deer, Acorns, and Shrub Cover.
Researchers:
T. Bernheim, M. Fu, S. Rowland, and A. Tsai
Jonathan D.majer, Ants pass the bioindicator score board
Population Dynamics Of Small Mammals In Virginia Forests
1. Population Dynamics of Small Mammals in Virginia Forests: Testing the Impacts of
Weather, Deer, Acorns, and Shrub Cover
By: Taylor Bernheim, Menghan Fu, Sebastian Rowland, and Andrew Tsai
Abstract
Small rodent communities play an important role in forest ecosystems as consumers of
vegetation and as prey for birds and larger mammals. Several biotic factors have been found to
influence population size. The presence of deer, production of food such as acorns, seasonal
temperature and precipitation, and shrub cover all play a role in controlling the size of small
mammal populations. We analyzed small mammal trappings in forests surrounding Fort Royal,
Virginia in order to test for relationships with these variables. Peromyscus leucopus and
Microtus pennsylvanicus were the most frequently trapped species. Acorn density was positively
correlated with small mammal populations. Winter precipitation, the presence of deer, and shrub
cover were negatively correlated with small mammal populations. Greater acorn density likely
provided small mammals with more nutrition. Deer may have forced greater competition for
shrub space or competed for acorns. Winter precipitation was primarily snow, which likely
reduced access to vegetation. The negative impact of shrub was most likely due to the small
sample size of the shrub data. Our data suggests that these environmental factors are important
for small mammals. However, there are other untested variables that may help explain the
variation found.
1
2. Introduction
Small mammal populations have been the subject of intense study for several reasons. On
an ecological level, they are crucial contributors to forest ecosystems across North America
because they consume vegetation and seeds, and serve as prey for larger animals such as owls,
weasels, and snakes (Hansson 1987). Woodland rodents have also been noted to negatively
influence the survival of fledglings (Schmidt 2008). Small mammal populations are also of
human concern. Knowing which factors influence small mammal populations and how are
important academic questions that ecologists have struggled with for many years (Wang 2007).
This class of animals, particularly M. pennsylvanicus are carriers of the human lung pathogen
hantavirus (Mills 2009). One of the more common species, P. leucopus, is a known host for
Ixodes scapularis, the black legged tick that can carry Lyme disease (Ostfeld 1996). Thus
understanding small mammal populations is of epidemiological importance as well.
Vegetation
Several studies performed in the field have observed a positive correlation between low-
lying vegetation and small mammal populations. Navigation studies have shown that rocks,
shrubs, and other navigable landmarks encourage colonization, especially by P. leucopus, among
others (Barry and Francq 1980). Comparison studies of different habitats, including introduced
artificial cover, have indicated that increased food and cover levels are preferred in habitat
selection (Wirtz and Pearson 1960), though each small mammal species has its own preferences.
A study on the reclamation of a Kentucky mine (Larkin 2008) revealed that low-level, diverse
vegetative growth under 2 cm diameter at breast height (DBH) coupled with high litter, rock, and
2
3. forb levels is directly associated with re-colonization by small mammal populations. Finally,
specific vegetation comparisons between habitats in Ontario, Canada have indicated that more
than three-fourths of total population variation is explained by low-level vegetation growth
(M’Closkey and Lajoie 1975).
Climate
Studies have demonstrated that climatic variables have an effect on small mammal
populations, although which relationship is observed is dependent on the time span of the study.
A 20-year study carried out by Deitloff, et al. in Minnesota indicated that the population of M.
pennsylvanicus is positively correlated to summer precipitation. The study, while acknowledging
different conclusions drawn from shorter-term analyses, assumed that long-term results were
preferable to short-term results. The positive correlation of small mammal populations with
summer precipitation was also found in a study based in Ohio focusing on P. leucopus by
Lewellen and Vessey. Among other things, the study found a 2-3 month lag of the effect of
extreme summer temperatures on population size and a 3-month lag of extreme winter
temperatures. This lag was more firmly established in their 1998 study (Lewellen and Vessey)
that emphasized the usefulness of short-term analysis in explaining population variation as
compared to long-term analysis, which was cited as an “inappropriate time scale” for this type of
study. Accordingly, an 11-year study conducted in Alberta focusing on Peromyscus maniculatus
found little relation between weather conditions and annual population growth (Kalcounis-
Reuppell 2002). It was found that P. maniculatus has adapted compensatory responses to
extreme temperatures, though climate still limited their seasonal breeding.
3
4. Food
Populations of small mammals have also been correlated to mast crops and factors
affecting their production. A study in Maine focusing on P. leucopus population fluctuations as
related to acorn mast found an oscillatory period of four years (Elias 2004). Allowing for
predation and intrinsic competition within the small mammal population, large acorn (Quercus
sp.) crops were generally associated with a rise in P. leucopus population. This result was
likewise observed by a study conducted in Virginia, where populations of P. leucopus and other
small mammals were significantly correlated with acorn mast production (McShea 2000). A
control for interspecific interactions found a relative increase in small mammal populations in
areas of lower competition. Nixon also identified that lower competition for resources led to an
increase in survival of gray and fox squirrels (Sciurus carolinensis and Sciurus niger,
respectively) suggesting that the trend is not unique to P. leucopus (1975). Also observed were
lower emigration rates and increased female fecundity. In addition to these, a study in Illinois
found that increased food supplies anticipated unusually early breeding for P. leucopus (Hansen
1979) and, when provided during periods of normally low food supplies (e.g. overwintering), led
to an increase in population in following years. A conflicting trend was observed by Vessey
(1987) in Ohio, where populations of P. leucopus declined in summer despite a plethora of food,
suggesting that complex interactions between food sources and animal behavior, such as nest and
mate guarding, contribute to population fluctuations.
The objective of this study was to identify the influence of food availability, severity of
the seasonality, and impact of shrubs and low-lying vegetation on small mammal populations. In
order to test these relationships we analyzed trapping and environmental data from twelve sites
in Eastern Virginia forests.
4
5. Methods and Materials
Study sites (McShea 1992,McShea 2000)
Twelve study sites total were investigated within the context of this study. Three study
sites were located near Front Royal, Virginia, USA (38°54’ N, 78°09’ W) on the premises of the
Conservation and Research Center (CRC), five study sites were located within Shenandoah
National Park (SNP), and four sites were located in the George Washington National Forest. The
CRC is a 1,200-ha research facility located 2 km SE of the town of Front Royal. SNP is a
component of the national park system that stretches along the Appalachian Mountain chain
from Front Royal south almost to Waynesboro, Virginia, a distance of approximately 160 km.
All sites were composed primarily of mature oak, hickory (Carya sp.), white ash (Fraxinus
americana), and yellow poplar (Liriodendron tulipifera) with understory shrubs of Cornus
florida, Lindera benzoin, and Cercis canadensis (Eyre 1980).
All sites were 4ha, either 200 x 200 m, or 160 x 250 m in shape, and separated by at least
1 km. Deer exclusion fences were erected in 1991 around the Posey site within the CRC. The 3-
m tall fence, composed of farm fencing and high tensile wire, did not exclude medium and small
vertebrates (Leimgruber et al. 1994). Five other deer exclosures were similarly erected and
placed at the Keyser, Dump, and Hillstop sites within Shenandoah National Park and at the
Forest 1 and Forest 2 sites within the George Washington National Forest. The six remaining
sites, North and Bear within the CRC and Forest 3, Forest 4, Forest 5, and Forest 6 sites within
the George Washington National Forest, were open to deer and served as controls.
Small mammal data were collected from 1992 to 1998. Acorn data were collected at two
sites since 1986, eight sites since 1990, all sites from 1992-1998. DBH data was measured at 8
5
6. sites (3 CRC sites and 5 SNP sites) in 1990. Shrub cover data was collected in 1990, 1992, 1994,
1996, and 1997 at four sites. In addition, several environmental measures were taken at each
sampling unit. Slope and elevation were determined using a clinometer. Aspect was determined
with a compass by estimating the direction water would flow from the center of the unit.
Small mammal trapping
Small mammal data were collected from 1992 to 1998. Trapping occurred during late
March/early April and during August. The spring trapping coincided with the emergence of
green vegetation, while the August trapping concluded before the maturation of the annual mast
crop (McShea and Schwede 1993). At each 4 ha site, 100 trap stations were evenly placed at 20
m intervals and permanently marked with stakes. 2 Sherman traps (Sherman Trap Company,
Tallahassee, Florida, 23cm) were placed at each station, for a total of 200 traps at each site.
Sherman live traps were baited with sunflower seeds. Live traps were pre-baited for two days
and then opened for 3-4 consecutive days. All traps were checked every 12 hours, and all
captured animals were uniquely marked with a No. 1 monel eartag (National Band and Tag
Company, Lexington, Kentucky, USA). Species, sex, age, weight, and evaluation of reproductive
condition were recorded before release.
Although nine species were captured at least 10 times during the study, the only
granivorous mammals with sufficient sample size for analysis were P. leucopus, Tamias striatus,
and S. carolinensis.
6
7. Measuring Shrub Surface Area
Shrub data was collected twice at each site over the period of our study. Shrub surface
area was measured using a cover board. The cover board was divided into 25 squares and shrub
surface area was recorded as the number of squares occupied by vegetation when observed from
a distance of 16 meters.
Quantifying Weather Data
Weather data was collected from a local weather station. Following the methods of
Merritt et al. (2003), annual maximum and minimum mean temperatures in the year pre-trapping
(i.e. the year leading up to March for minimum mean temperature and leading up to August for
maximum mean temperature) were used in analysis. The annual maximum mean temperature in
the year leading up to August was used for analysis in lieu of extreme summer temperatures. It is
expected that this will yield a clearer measure of the response of populations to temperature
effects. Precipitation was measured as the accumulated precipitation during the winter prior to
March trapping, and during the growing season prior to August trapping.
Measuring Acorn Production
Acorn counts were collected annually from all sites from 1992 to 1998. Mast production
(kg/ha) was estimated by establishing a grid of mast collectors in each of two oak-history stands
(Posey Hollow and Bear Hollow) that were 2 km apart. Each grid was composed of 100
collectors in a 10 by 10 configuration at 20 m intervals. Mast collectors were wire funnels
(collecting surface = 2,910 cm2) attached to tin cans and fastened to 1 m stakes, making collected
7
8. acorns inaccessible to foraging animals. The cumulative count of acorn density per site per year
for was used for analysis, though mast production in 1986 was obtained from only 18 of these
collectors at each of the two sites. All species were pooled for analyses because no significant
difference in response was observed of deer to acorns of the three common oak species. Hickory
(Carya sp.) nuts were excluded from analyses because deer do not consume them.
Medium-sized mammals captured at the nearby Posey Hollow grid include gray and
fox squirrels (S. carolinensis, S. niger), southern flying squirrels (Glaucomys volans), eastern
chipmunks (T. striatus), raccoons (Procyon lotor), and eastern woodrats (Netotoma floridana).
White-footed mice (P. leucopus) were the only mast-consuming small mammals captured in the
Posey Hollow grid.
Statistical Analysis
A cumulative count of untagged small mammals during March trapping was compared
against acorn count, minimum winter temperature, and accumulated winter precipitation, in
accordance with the observed 3-month lag of the effect of winter temperatures on populations
(Lewellen and Vessey 1997). A cumulative count of untagged small mammals during August
trapping was compared against shrub density, max precipitation, and accumulated summer
precipitation. While the August trapping would not reflect the 2-month lag of the effect of
extreme summer temperatures on populations (Lewellen and Vessey 1997), it measures the
effect of other summer factors on the population sans effects from acorns, which are typically
harvested in the fall. In particular, the effect of summer precipitation on breeding will be
represented in these data, as August is toward the end of the P. leucopus breeding season
(Cornish and Bradshaw 1978).
8
9. Statistical analysis was performed using JMP®(SAS Software). Small mammals, acorn
density, and shrub density variables were log transformed to reduce heterogeneity of variances.
The presence of deer was defined as a nominal binary variable. Analysis for shrub and deer were
first run as analysis of variance (ANOVA) with deer and the variable in question. When
interaction was not significant, then analysis of covariance (ANCOVA) was run. Linear
regression was utilized to measure the response of populations to deer after ANCOVA showed
deer was not significant. Stepwise regression using the Akaike's Information Criterion (AIC)
stepping rule was utilized on population and weather variables to determine which variables
produced a significant response in populations. In particular, stepwise regression was run with
multiple variables for August trapping, including maximum and minimum temperatures, winter
and growing season precipitation, and acorn density. August trapping did not respond
significantly to any of these variables, which were discounted as per AIC.
9
10. Results
Shrub and deer
Figure 1: ANCOVA of response of ln summer small
mammal population to total shrub cover and deer/no
deer plots.
ANOVA revealed no significance in the interaction between shrub and deer (t=.01;
df=1,18; p=.9935). ANCOVA tested for the effect of deer exclusive correcting for the
differences in shrub density. Analysis revealed that deer negatively impacts summer small
mammal populations (t=-2.19; df=1,19; p=.0408). Plots with deer tended to have 13% less small
mammals than plots where deer were excluded. Contrary to expectations, the ANCOVA also
revealed summer small mammal population significantly decreases with increasing shrub cover
(t=-3.20; df=1,19; p=.0047).
Therefore, the effect of deer on small mammal population size is often masked since
plots with deer also tend to have lower shrub cover. However it is possible the limited shrub data
set can potentially impact the relationships noted by the analysis.
10
11. Acorn Density and Deer
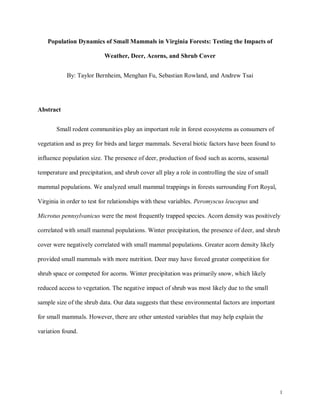
Figure 2: Linear Response of ln winter small
mammal population ln Acorn density from the
previous year.
ANCOVA of deer and acorn density revealed that deer had no significance alone on
small mammal population (t=0.24; df=1,76; p=.8106). Linear regression revealed that winter
small mammal populations responded positively to acorn the previous year (t=6.61; df=1,78;
p<.0001; Figure 2). Small mammal populations increased by .2404 with every unit increase in
acorn density from the previous year, despite the variability in acorn density from year to year
(Figure 3). Additionally ANCOVA analysis revealed no significant impact of deer enclosure on
acorn density (t=-0.67; df=1,82; p=.5052; Figure 4).
11
12. 4000
3500
3000
Total Acorns
2500
2000 Figure 3: Total acorn density
1500 in no deer and deer plots.
1000
500
0
1991 1992 1993 1994 1995 1996 1997 1998
160
140
120
100 Figure 4: Response of acorn
Total Acorns
density to the presence of deer.
80
60
40
20
0
Type of Plot
12
13. Climate variables on small mammal population
Figure 5: Response of March small mammal
population to accumulated winter precipitation.
Stepwise regression analysis revealed no significant impact on summer small mammal
populations from climate variables. Winter populations can be explained by both acorn density
as well as winter precipitation. Regression revealed the following result: ln (TSM) = 5.3495
+ .00067973(acorn) -.0979612(winter precip). Accumulated winter precipitation had a negative
effect on populations (t=-6.60; df=1,82; p<.0001, figure 5). Winter precipitation was able to
explain 48.2% of the response in March population size.
Additionally ANCOVA showed no significant effect of weather variables on acorn count (t=0.13;
df=1,82; p=.8966, figure 6).
13
14. Figure 6: Lack of response of acorn density to winter
precipitation.
Discussion
The results indicate that the presence of a deer population negatively impacted the
autumn small mammal populations. One possible mechanism for this relationship is interspecific
competition between small mammals and deer for acorns. McShea (2000) observed this
relationship, though the competition only had a noticeable impact during seasons of low mast.
The deer may have also eaten shrub and thus reduced an important habitat for the rodents
(Flowerdew 2001). While our data does not support such a relationship between deer and shrub
surface area, the shrub dataset was small and may have been insufficient to reveal a relationship.
Deer may have influenced how small mammals used the shrub. Muñoz (Muñoz2007) observed
that the environmental disturbances cause by deer presence would cause mice to spend more
time in the shrub. This behavioral change in turn reduced the use of shrubs as caching sites
because the risk of discovery was greater. In this way the presence of deer may limit a critical
overwintering survival strategy. Although our limited dataset did not show it, deer may have
14
15. reduced vegetative understory that would have provided rodents with a habitat in which to hoard,
as deer have been found to decrease acorn predation (Bokdam 2001). It is also possible that the
differences between exclosure and non-exclosure plots may be due to other biotic or abiotic
differences.
The negative correlation between shrub surface area and small mammal data is
contradictory to many findings that found a positive correlation (M’Closkey and Lajoie 1975,
Larkin 2006). One possible mechanism is that M. pensylvanicus would outcompete P. leucopus
in the shrub space (Wirtz 1960) and thus P. leucopus, which was the most populous species, was
not able to inhabit much of the plot, which was covered in shrubbery. The metric of shrub
surface area may have been insufficient to account for all preferred microhabitats of rodents.
Logs and stumps also encourage small mammal populations. In one study they had a greater
impact on rodents than shrubs because they offered more isolation (Barry and Francq 1980). The
mice and voles may have spent more time in the shrubs if they cover more of the plot – since few
of the traps were set in shrubs this would bias the findings against shrub density. Although these
mechanistic explanations are possible, the most probable cause of the negative correlation is that
the sample size of shrub data was too small to reveal an accurate relationship.
Our analysis found that acorns had a highly significant positive relationship with small
mammal populations. Consumption of acorns by small mammals has been well documented
(Whitaker 1966); thus in our plots the mice and voles likely took advantage of acorn dispersal as
an additional food source. Acorns only had a significant effect on spring populations. They
provided nutrients necessary for small mammals to overwinter (Wolff 1996), but did not persist
long enough to influence the summer population.
15
16. Summer weather and winter precipitation did not explain any of the variety in the small
mammal populations. It is unsurprising that summer temperature had little effect because
summer temperatures did not vary significantly. Similar results in other studies suggest that
behavioral and physiological responses to the weather mitigated their influence (Deitloff 2010).
The amount of winter precipitation, snow, was found to have a negative impact on small
mammal populations. While snow cover may protect rodents from predation by some predator
species, weasels have specially adapted to hunt small mammals in the subnivean space (Hansson
1987). Thus, greater snow cover may encourage predation by weasels. Winter precipitation may
also limit access to food by covering it in ice (Korslund 2006). Therefore, the greater
precipitation may have limited nutrient availability for rodents, which could have led to
emigration or death. The snow cover may have impacted the trapping if it persisted until the
March trapping session.
Conclusion
Our analysis revealed some influences that are consistent with the literature in reference
to winter precipitation and acorns. The observed negative influence of shrub surface area may be
confounded by a small dataset.
It is likely that the duration of our study influenced the relationships and impacts we
found. The relative influence of each variable may change over time and depends on the state of
the system (McMilan 2005). Analysis may be strengthened by considering points at which the
conditions are most variable in order to ignore times when that factor does not have a large
influence. During the period of the experiment other variables may have been more important
than those we studied (McMilan 2005). Factors such as predation, parasites, other food sources,
16
17. and logs may have played a larger role in controlling the population. The weather data could
have been more precise in order to develop different metrics of weather and seasonality. It is
possible that rodent populations respond more strongly to other measurements of weather such as
cloud cover at night or average minimum temperature, or a metric that combines temperature and
precipitation. Other measurements of the small mammal population, such as reproduction and
survival, could be analyzed to identify other influences of the environment.
This research will be strengthened by further studying the intrinsic features of small
mammal populations. The importance of abiotic and biotic factors may depend on the density of
the small mammal populations, as has been observed in other studies (Lewellen and Vessey 1998,
Wang et al. 2009). Some rodent species including P. leucopus (Wang et al. 2008) express multi-
annual population cycles not considered in the study. The context of such intrinsic factors should
be considered in further questions on how extrinsic factors affect population size.
Acknowledgements
We would like to thank Bill McShea for the use of his data and his useful criticisms.
Many thanks go to Vinayak Mathur and Erin Wiley for their advice in the analysis. We would
also like to thank Luke, Jenny, and Lorien for their help and for hosting us during the course.
17
18. Work Cited
Barry RE and Francq EN. 1980. Orientation to Landmarks within the Preferred Habitat by
Peromyscusleucopus. Journal of Mammalog.y 61, 292-303.
Bokdam SR, den Ouden J Olff H, Schot-Opschoor H and Schrijvers M. 2001. Effects of
introduction and exclusion of large herbivores on small rodent communities. Plant
Ecology. 155, 119-127.
Cornish LM, and Bradshaw WM. 1978. Patterns in Twelve Reproductive Parameters for the
White-Footed Mouse (PeromyscusLeucopus). Journal of Mammology. 59, 731-739.
Deitloff, J, Falcy, M, Krenz, JD and McMillan, BR. 2010. Correlating Small Mammal
Abundance to Climatic Variation over Twenty Years. Journal of Mammalogy. 91, 193-
1999.
Elias SP, Witham, JW, and Hunter ML. 2004. PeromysucleucopusAbundance and Acorn Mast:
Population Fluctuation Patterns Over 20 years. Journal of Mammalogy. 85, 743-747.
Flowerdew, J. R. and Ellwood, S. A. 2001. Impacts of Woodland Deer on Small Mammal
Ecology.Forestry. 74, 277-287.
Hansen LP and Batzli GO. 1979. Influence of Supplemental Food on Local Populations of
Peromyscusleucopus. Journal of Mammalogy. 60, 335-342.
Hansson, L. 1987. An Interpretation of Rodent Dynamics as due to Trophic Interaction. Oikos.
50:308–318.
Kalcounis-Rueppell MC, Millar JS and Herdman EJ. 2002. Beating the Odds – Effects of
Weather on a Short-Season Population of Deer Mice. Canadian Journal of Zoology. 80,
1594-1601.
18
19. Korslund L and Steen H. 2006. Small Rodent Survival: Snow Conditions Limit Access to Food
Resources. Journal of Animal Ecology. 75, 156-166.
Larkin JL, Maehr DS, Krupa JJ, Cox JJ, Alxy K, Unger DE, and Barton C. 2008. Small Mammal
Response to Vegetation and Spoil Conditions on a Reclaimed Surface Mine in Easter
Kentucky. Southeastern Naturalist. 7, 401-412.
Lewellen RH and Vessey SH. 1998. Modeling Biotic and Abiotic Influences in Small Mammals.
Oecologia. 113, 210-218.
McMillan, B. R., G. A. Kaufman, and D. W. Kaufman. 2005. Factors influencing persistence of
white-footed mice (Peromyscusleucopus). Prairie Naturalist. 37, 29–40.
M’CloskeyRt and Lajoie DT. 1975. Determinants of Local Distribution and Abundance in
White-Footed Mice. Ecology. 56, 467-472.
McShea WJ. 2000. The Influence of Acorn Crops on Annual Variation in Rodent and Bird
Populations. Ecology. 81, 228-238.
McShea WJ and Gilles AB. 1992. A Comparison of Traps and Fluorescent Powder to Describe
Foraging for Mast by Peromyscus-leucopus. Journal of Mammalogy. 73, 218-222.
McShea WK and Schwede G. 1993. Variable Acorn Crops – Responses of White-Tailed Deer
and Other Mast Consumers.Journal of Mammalogy. 74, 999-1006.
Merritt, JF, Lima, M and Bozinovic, F. 2001. Seasonal Regulation in Fluctuating Small Mammal
Populations: Feedback Structure and Climate. Oikos. 94, 505–514.
Mills JN, Anman BR, and Glass, GE. 2009. Ecology of Hantavirus and Their Hosts in North
America. Vector-Borne and Zoonotic Disease.s 9, 563-574.
Muñoz, A and Bonal R. 2007.Rodents Change Acorn Dispersal Behavior in Response to
Ungulate Presence. Oikos. 116, 1631-1638.
19
20. Ostfeld RS, Jones CG, Wolff JO. 1996. Of Mice and Mast. Bioscience. 46, 323–330.
Ostfeld, R. S. Canham, C. D., Oggenfuss, K., Winchcombe, R. J. and Keesing, F. 2006. Climate,
Deer, Rodents, and Acorns as Determinants of Variation in Lyme-Disease Risk.PLoS
Biology. 4, 145.
Schmidt KA, Rush SA, and Ostfeld RS. Wood Thrush Nest Success and Post-Fledging Survival
Across a Temporal Pulse of Small Mammal Abundance in an Oak Forest. Journal of
Animal Ecology. 77, 830-837.
Wang, G, Wolff JO, Vessey SH, Slade NA, Witham JW, Merritt JF, Hunter ML, and Elias SP.
2008. Comparative Population Dynamics of PeromyscusLeucopus North America:
Influences of Climate, Food, and Density Dependence. Population Ecology. 51, 133-142.
Whitaker J0, JR. 1966. Food of Musmusculus, Peromyscusmaniculatusbairdi, and P. leucopus
in Vigo County, Indiana. Journal of Mammalogy. 47, 473-486.
Wirtz WO and Pearson PG. 1960. A Preliminary Analysis of Habitat Orientation in Microtus and
Peromyscus. American Midland Naturalist. 63, 131-142.
Wolff JO. 1996. Population Fluctuations of Mast-Eating Rodents are Correlated with Production
of Acorns. Journal of Mammalogy. 77 850-856.
20