Currency At Crisis
•
3 gostaram•1,025 visualizações

This paper explores reasons for recent crisis of Indian currency.
![114
Indian Rupee lost 5.53% in 2011-12 as compared
to 2010-11, 12.84% in 2012-13 over 2011-12,
19.72% up to August 2013 over 2012-13, and
by 6.70% within 10 days in black August.
There is a down turn in the economy but the
latest downfall may squarely be blamed on
sentiment driven market behaviour.
Frequently cited internal and external factors
for current depreciation of rupee are:
(1) Widening Current Account Deficit (CAD);
(2) Rising retail inflation in India;
(3) Apprehension of widening fiscal deficit;
(4) Policy paralysis to push reforms;
(5) Economic slow-down;
(6) FED tapering view; and
(7) Capital outflows.
In this context, the 1990-91 Balance of Payment
(BoP) crisis and consequential INR depreciation
is not an unfair comparison sans the so-called
better state of foreign currency reserve this
time. The BoP crisis of 1990-91 was culmination
of (i) fiscal deficit and gradually increasing
overvaluation of currency, (ii) external political
environments like break-up of the Soviet Union
and the unification of Germany, (iii) oil shock
arising out of First Gulf war, and (iv)three
changes of Government domestically and
unprecedented socio-political upheaval [1]. On
the other hand, conditions today mostly arise
out of global slow-down, widening CAD and
apprehension of failure to maintain fiscal
discipline on the domestic front.
We shall briefly highlight these issues, review
the policy measures adopted to arrest fall in
Rupee, REER signals, and future of the Indian
currency.
WIDENING CAD
Exchange rate of Indian currency is principally
dependent on the forces of demand and supply,
which in turn are determined by the flows of
the current and capital accounts. Fundamentally,
CAD reflects imports and exports of goods
and supplies, while the capital account reflects
the money that has been invested by foreigners
in India and the monetary investments that
Indians have made abroad. India historically
has had CAD, and never a trade surplus –
September 1 to 15, 2013 u Taxmann’s Corporate Professionals Today u Vol. 28 u 118
ECONOMY](data:image/gif;base64,R0lGODlhAQABAIAAAAAAAP///yH5BAEAAAAALAAAAAABAAEAAAIBRAA7)
Recomendados
Mais conteúdo relacionado
Mais procurados
Mais procurados (20)
Destaque
Destaque (13)
Semelhante a Currency At Crisis
Semelhante a Currency At Crisis (20)
Mais de Tarapada Ghosh
Último
Último (20)
Currency At Crisis
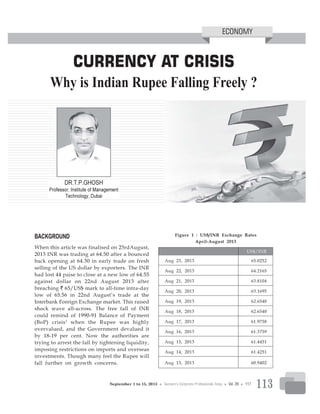
- 1. 113 CURRENCY AT CRISIS Why is Indian Rupee Falling Freely ? BACKGROUND When this article was finalised on 23rdAugust, 2013 INR was trading at 64.50 after a bounced back opening at 64.30 in early trade on fresh selling of the US dollar by exporters. The INR had lost 44 paise to close at a new low of 64.55 against dollar on 22nd August 2013 after breaching ` 65/US$ mark to all-time intra-day low of 65.56 in 22nd August’s trade at the Interbank Foreign Exchange market. This raised shock wave all-across. The free fall of INR could remind of 1990-91 Balance of Payment (BoP) crisis1 when the Rupee was highly overvalued, and the Government devalued it by 18-19 per cent. Now the authorities are trying to arrest the fall by tightening liquidity, imposing restrictions on imports and overseas investments. Though many feel the Rupee will fall further on growth concerns. Figure 1 : US$/INR Exchange Rates April-August 2013 US$/INR Aug 23, 2013 65.0252 Aug 22, 2013 64.2165 Aug 21, 2013 63.8104 Aug 20, 2013 63.1695 Aug 19, 2013 62.6540 Aug 18, 2013 62.6540 Aug 17, 2013 61.9758 Aug 16, 2013 61.3759 Aug 15, 2013 61.4451 Aug 14, 2013 61.4251 Aug 13, 2013 60.9402 DR.T.P.GHOSH Professor, Institute of Management Technology, Dubai ECONOMY September 1 to 15, 2013 u Taxmann’s Corporate Professionals Today u Vol. 28 u 117
- 2. 114 Indian Rupee lost 5.53% in 2011-12 as compared to 2010-11, 12.84% in 2012-13 over 2011-12, 19.72% up to August 2013 over 2012-13, and by 6.70% within 10 days in black August. There is a down turn in the economy but the latest downfall may squarely be blamed on sentiment driven market behaviour. Frequently cited internal and external factors for current depreciation of rupee are: (1) Widening Current Account Deficit (CAD); (2) Rising retail inflation in India; (3) Apprehension of widening fiscal deficit; (4) Policy paralysis to push reforms; (5) Economic slow-down; (6) FED tapering view; and (7) Capital outflows. In this context, the 1990-91 Balance of Payment (BoP) crisis and consequential INR depreciation is not an unfair comparison sans the so-called better state of foreign currency reserve this time. The BoP crisis of 1990-91 was culmination of (i) fiscal deficit and gradually increasing overvaluation of currency, (ii) external political environments like break-up of the Soviet Union and the unification of Germany, (iii) oil shock arising out of First Gulf war, and (iv)three changes of Government domestically and unprecedented socio-political upheaval [1]. On the other hand, conditions today mostly arise out of global slow-down, widening CAD and apprehension of failure to maintain fiscal discipline on the domestic front. We shall briefly highlight these issues, review the policy measures adopted to arrest fall in Rupee, REER signals, and future of the Indian currency. WIDENING CAD Exchange rate of Indian currency is principally dependent on the forces of demand and supply, which in turn are determined by the flows of the current and capital accounts. Fundamentally, CAD reflects imports and exports of goods and supplies, while the capital account reflects the money that has been invested by foreigners in India and the monetary investments that Indians have made abroad. India historically has had CAD, and never a trade surplus – September 1 to 15, 2013 u Taxmann’s Corporate Professionals Today u Vol. 28 u 118 ECONOMY
- 3. 115 India’s total exports have never exceeded imports, leading to a trade deficit. India is primarily an import driven economy and its trade deficit2 has been met by foreign investments in the form of Foreign Direct Investment (FDI) and Foreign Institutional Investors (FII) inflows. Widening trade deficit of India over the years (Refer to Figure 2) would become a cause for concern if produced by chronic structural deficiencies. For developing countries structural trade deficits can be difficult to finance, making them unsustainable after a point in time. This is because the chronic nature of the problems leaves little scope for policy intervention. The situation worsens if the deficiencies are accentuated by adverse circumstances. [2] Figure 2 : Declining CAD/GDP Ratio Source: Reserve Bank of India HIGH INFLATION Inflation pressures eased in Advanced Economies (AEs) and some Emerging Market and Developing Economies (EMDEs) during Q2 of 2013. In India, average headline inflation during Q1 of 2013-14 at 4.8 per cent is significantly lower than the average inflation of 7.5 per cent during Q1 of 2012-13 and 7.4 per cent during the year 2012-13. The headline inflation exhibited a softening bias during Q1 of 2013- 143 , driven by all three major sub-groups, viz., primary articles, fuel and power and manufactured products with major contributions from the non-food manufactured products group. This is of course because of lower global commodity prices. u The revisions in administered prices, par- ticularly of diesel and electricity, led to a pick-up in inflation for administered price items during April-May 2013. First Quarter Review 2013-14 by the Reserve Bank of India sent a strong signal to the market participants: “Even though the current account deficit (CAD) to GDP ratio moderated to 3.8 per cent in Q4 of 2012-13 from its historic high of 6.5 per cent in Q3 of 2012-13, indications are that it may have widened again in Q1 of 2013-14. Going forward, the current account is expected to show improvement with likelihood that gold imports may fall. However, risks to CAD financing have increased due to capital outflows from EMDEs. This has put rupee under pressure. Vulnerability indicators of the external sector have deteriorated. In this milieu, concerted policy reforms are needed to reduce CAD and to improve financing by attracting more stable capital flows to the Indian economy.” [3] Apart from import of crude oil, gold and coal have also contributed to widening CAD that has reached 4.8% of GDP. September 1 to 15, 2013 u Taxmann’s Corporate Professionals Today u Vol. 28 u 119
- 4. 116 u Food price inflation has been a major driver of headline inflation in recent years. High input costs, rising wages and inelastic supply responses to demand led to higher food price inflation. u The depreciation of the Rupee and in- crease in global crude prices following the political uncertainties in the Middle East led to some increase in the prices of freely priced fuel products in June–July 2013. u Upward price revision of coal prices by Coal India from May 28, 2013 led to an increase in input cost pressures for coal consuming industries. u Several State Electricity Boards (SEBs) re- vised their prices upwards in May 2013, which led to a 13 per cent increase in the electricity price index in the WPI. However, there has been a divergent trend in the movement of retail price index (Refer to Figure 3). Figure 3 : Comparative Movement of CPI and WPI It has been explained that this divergent movement of WPI and CPI is so pervasive that the RBI REER index failed to provide a danger signal of INR depreciation. The RBI observed that [3]: “In the case of market integration the price pressures should reflect identically in the wholesale and retail markets as movements in wholesale prices should translate to the retail market with some lag. However, supply-demand gap at the regional level, could lead to greater pressures on retail prices than in the wholesale market. This requires improving the current state of supply chain management to provide better market access to farmers, storage facilities and transportation.” However, policy paralysis caused continued bottleneck in the supply chain management. Fiscal deficit Fiscal deficit is the difference between the government’s expenditures and its revenues excluding borrowings. Fiscal deficit is usually communicated as a percentage of GDP. Main causes fiscal deficit are - Government spending, inflation and lower revenue. The pernicious nature of fiscal deficit does not only jeopardize the growth of the country but also the government’s economic management abilities. The unprecedented global financial crisis of 2007, which coincided with a domestic economic slowdown, necessitated an expansionary fiscal policy in an exceptional year. Serious deviations of the revenue and fiscal deficits from the budget estimates continued. However, helped 2012-13 worked out to be at 4.89 per cent of September 1 to 15, 2013 u Taxmann’s Corporate Professionals Today u Vol. 28 u 120 ECONOMY
- 5. 117 GDP which was lower than the revised estimate of 5.2 per cent. Moving forward in 2013-14, fiscal deficit has been targeted to be contained below 4.8 per cent of the GDP. On the contrary, the impact of the Food Security Bill, which guaranteed quality food grains at subsidized rates, on fiscal deficit is estimated at 0.5 per cent by experts. And then earlier in July 2013, the reassurance of the Government of India that execution of the Food Security Bill would not affect the fiscal deficit target went unheard. Fiscal deficit has been a key concern for credit rating agencies as well. The Government promulgated an ordinance to implement the Food Security Bill, giving over two-thirds of the population the right to 5 kg. of food grain each month at the subsidised rates of one to three rupees per kg. Government spending on the programme is estimated at `. 1,25,000 crore annually for supplying about 62 million tonnes of rice, wheat and coarse cereals. Federation of Indian Chambers of Commerce and Industry’s Economic Outlook Survey observed that it will impose an additional pressure on the fiscal situation and would make fiscal sustainability plan of the country difficult to achieve. As a result, the expected fiscal deficit to GDP ratio may move up to 5 per cent for 2013-14, which is slightly above the budgeted 4.8 per cent. The fear of higher fiscal deficit has been aggravated by the statistics that total expenditure as a percentage of the budget estimate in the first two months (April-May) of 2013-14 was higher than a year ago. This was mainly due to higher plan and capital expenditure, which registered growth rates of 52.6 per cent and 48.9 per cent, respectively, over April-May 2012. In case the Government’s revenues fall short of the target due to slowdown in growth, there is in fact a need for expenditure cut to achieve the budgeted fiscal deficit. It is, therefore, important to contain subsidies and re-prioritise expenditure towards plan and capital expenditures, thereby enhancing the growth prospects of the economy, whereas the Government has been found to be enhancing the subsidies. POLICY PARALYSIS TO PUSH REFORM “Policy paralysis” has become a pet phrase of the critics. Although this is not an unfounded hypothesis, there are delayed reform efforts on the part of the Government : u The Union cabinet decided to raise the FDI cap in the telecom sector from the earlier 74 per cent, even overruling secu- rity concerns expressed by the home ministry, to 100 per cent to meet the demand of the fund starved sector. u The cabinet eased norms for FDI in multi- brand retail, a controversial decision taken last year that allowed a foreign retailer to open stores in 53 cities with more than one million population. There is a pro- posal to allow them to penetrate smaller markets too. Easing norms, the Govern- ment diluted the mandatory 30 per cent local sourcing of goods for these foreign retailers while noting that new guidelines would bring in more clarity and more space for investors. u The Government also liberalised rules for overseas companies looking to invest in manufacture of defence goods. Investment norms for various other sectors too were eased. u The Companies Bill has been passed that aims at transparency and globally com- patible regulations. u The Government is talking to other po- litical parties to push the Land Acquisi- tion Bill to provide for rehabilitation and resettlement of people displaced due to acquisition; the Goods and Services Tax, a value added tax which will replace indirect taxes; the direct taxes code, to replace the Income-tax Act. September 1 to 15, 2013 u Taxmann’s Corporate Professionals Today u Vol. 28 u 121
- 6. 118 Other reformist legislations are the Real Estate (Regulation and Development) Bill which seeks to establish the Real Estate Regulatory Authority, the Forward Contracts (Regulation) Amendment Bill, the Civil Aviation Authority Bill, Drugs and Cosmetics (Amendment) Bill. But there is a crisis of confidence arising out of undue delay, political conflicts and compounding corruption charges against the Government. ECONOMIC SLOW DOWN This is probably the major cause of unprecedented rupee turmoil. Some important facts [3] are presented below: u Manufacturing sector growth remained al- most stagnant during April-May 2013. Important industries such as machinery and equipment, basic metals, fabricated metal products, computing machinery, food products and motor vehicles registered contraction in output during the period. u Core industries continued to be adversely affected by supply bottlenecks and infra- structure constraints, thereby growing only at 2.4 per cent during April-May 2013-14, which is much lower than in the corre- sponding period of the previous year. While the output of coal, natural gas, fertilisers and crude oil contracted during the pe- riod, there was deceleration in the pro- duction of electricity, petroleum refinery products and cement. u The services sector recorded the lowest growth in 11 years at 6.8 per cent during 2012-13. Activity in the ‘financing, insur- ance, real estate & business services’ and ‘trade, hotels, restaurant, transport & com- munication’ sectors decelerated. The de- cline in lead indicators, such as automo- bile sales, cargo handled at major ports and civil aviation sector, during April- June 2013 signal a further slowdown in the services sector. The Reserve Bank of India Commented [3] that ‘as per the use-based classification of industries, with the exception of intermediate goods and consumer non-durables, the growth of all other categories declined during April- May 2013 [See Table 1]. Persistent power shortages affected the capacity utilisation of the manufacturing sector. As a result, backlogs of work accumulated in the sector. But the growth of power generation has remained at 5.3 per cent during April-May 2013. The shadow of economic slow down has been looming large. When viewed through the prism of ‘policy paralysis’, political uncertainty, enlarged CAD, enhanced subsidies, the sharp fall of the INR is explained. Table 1 : Index of Industrial Production: Sectoral and Use-Based Classification of Industries (Per cent) Growth Rate Industry Group Weight in Apr-Mar April-May 2013-14P the IIP 2012-13 2012-13 1 2 3 4 5 Mining 14.2 -2.4 -1.7 -4.5 Manufacturing 75.5 1.2 0.4 0.1 Electricity 10.3 4 5.2 5.3 User-Based Basic Goods 45.7 2.4 3.2 0.7 September 1 to 15, 2013 u Taxmann’s Corporate Professionals Today u Vol. 28 u 122 ECONOMY
- 7. 119 Capital Goods 8.8 -6.1 -15.2 -1.5 Intermediate Goods 15.7 1.6 0.8 2.1 Consumer Goods (a+b) 29.8 2.4 4 -1 a) Consumer Durables 8.5 2 7.5 -9.6 b) Consumer Non-durables 21.3 2.7 1.1 6.7 General 100 1.1 0.6 0.1 (Per cent) Growth Rate Industry Group Weight in Apr-Mar April-May 2013-14P the IIP 2012-13 2012-13 Note: P: Provisional Source: Central Statistics Office begin to perform more in line with economic fundamentals which means weaker performance. However, tapering is not an immediate, dramatic event. Instead, it is likely to take place over an extended period of time so as to create minimal market disruption. CAPITAL OUTFLOW Capital outflow is rather an outcome of various causes deliberated above rather than a cause in itself. However, in times of widening CAD, it causes panic and further disruption. The Reserve Bank of India in its report [3] remarked that: u Trends to date in 2013-14 suggest an uptrend in capital flows in the form of FDI and NRI deposits, while ECBs showed a de- cline as compared with previous quarter. u Net FII flows were substantial until the third week of May 2013, followed by a significant outflow in the subsequent period. Since the last week of May 2013, there was a net outflow of US$ 12.1 billion on account of FIIs (till July 18). The reversal of FII flows from the domestic market was mainly evident in the debt segment. u The outflows of FIIs from the domestic debt market was led by the global bond sell-offs on Fed signals that raised the FED TAPERING VIEW Tapering is a term that exploded into the financial lexicon on May 22, when U.S. Federal Reserve Chairman Ben Bernanke stated in a testimony before Congress that Fed may taper the bond- buying program known as Quantitative Easing (QE) in the coming months. Currently, expectations are that the Fed will bring its current pace of $85 billion per month in bond purchases to $60 or $65 billion within its next three meetings, which will take place on September 17-18, October 31, and December 17-18. Since the Fed Chairman’s May 22, 2013, testimony the Rupee depreciated significantly (by 7.5 per cent) till July 15 as global investors began unwinding their risky positions in emerging markets. The dollar strengthened against major currencies. However, Rupee fell sharply as compared to other currencies (Refer to Table 2).In the year to date US dollar index strengthened by 1.91 per cent. The strengthening of dollar is beyond Government’s control which is ultimately hammering the Indian currency. In the recovery that has followed the 2008 financial crisis, both stocks and bonds have produced outstanding returns despite economic growth that is well below historical norms. The general consensus is that Fed policy is the reason for this disconnect. Once the Fed begins to pull back on it stimulus, the markets may September 1 to 15, 2013 u Taxmann’s Corporate Professionals Today u Vol. 28 u 123
- 8. 120 prospects of global interest rates harden- ing, shifts in yield spreads and the el- evated cost of hedging a volatile Rupee. As per the market report: u Withdrawal by overseas investors amounts to `. 18,500 crore (about USD 3 billion) from the Indian capital markets in July 2013. u In June 2013 a record `. 44,162 crore (over USD 7.5 billion) was withdrawn. The continuing FIIs outflows have put a continuous pressure on rupee not allowing it to come out of the slump. Meanwhile, leading global bank Goldman Sachs has downgraded Indian stocks to underweight and recommended investors to stay selective on concerns of economic growth recovery. REAL EFFECTIVE EXCHANGED RATE Real Effective Exchange Rate (REER) Indices measure how nominal exchange rates, adjusted for price differentials between a country and its trade partners, have moved over a period of time. One way to gauge the fundamental value of a currency is to look at the REER. It means in accounting for inflation differences with its trading partners, how does a currency stack up. Taking 2004-05 as the base year with a value of 100, the average REER of the Rupee in 2012-13 against 36 currencies was 97.42 as compared to 104.06 in 2011-12 and 106.08 in 2010-11. It means that the Rupee has, since 2004-05, appreciated by 6.08 per cent in real effective terms against its major trade partners in 2010-11, and with a marginal decline in 2011-12, it lost 2.58 per cent in 2012-13. It is also used as an indicator of a country’s overall international competitiveness. A decrease in the REER would normally lead ceteris paribus to an improvement in the country’s real trade balance over time. A REER index basically has three components – range of foreign countries covered, their relative weights and the price indices to be compared. The main focus of the REER is on the trade balance, particularly on the exchange rate induced changes in trade flows. A trend appreciation of the REER is considered unfavourable for the growth of exports and as it favours imports from competing countries. In this context, presented below are the REER and NEER indices of India over 2004-05 to 2012-13: Table 2 : REER and NEER Indices of India 36 Currency bilateral weights (Base 2004-05) Year Export Based Weights Trade Based Weights REER NEER REER NEER 2004-05 99.86 99.72 99.82 99.67 2005-06 102.74 102.21 103.10 102.24 2006-07 101.05 98.00 101.29 97.63 2007-08 108.57 105.61 108.52 104.75 2008-09 97.77 94.00 97.80 93.34 2009-10 96.67 91.42 95.67 90.94 2010-11 106.08 94.74 103.93 93.54 2011-12 104.06 89.13 101.38 87.38 2012-13 97.42 80.05 94.61 78.32 September 1 to 15, 2013 u Taxmann’s Corporate Professionals Today u Vol. 28 u 124 ECONOMY
- 9. 121 Notes : (1) Data for 2011-12 and 2012-13 are provisional. (2) REER indices are recalculated from 1993-94 onwards using the new Wholesale Price Index (WPI) series (Base : 1993-94 = 100). (3) The Base year has been changed from 1993-94 to 2004-05. (4) The 36-Country REER & NEER are revised as 36- Currency REER & NEER respectively and for “note on Methodology” on the indices, please see 2005 Issue of RBI Bulletin. Source : Reserve Bank of India From Table 2, it is evident that Indian REER indices failed to adequately signal fundamental weaknesses of the economy like much higher retail inflation, worsening trade deficit and current account deficit of the country. Although it was signalling INR depreciation but the sharp decline was not evident. It continues to give moderate depreciation signal (Refer to Table 3). Table 3: Indices of Real Effective Exchange Rate (REER) and Nominal Effective Exchange Rate (NEER) of the Indian Rupee Item 2011-12 2012-13 2012 2013 July June July 1 2 3 4 5 36-Currency Export and Trade Based Weights (Base: 2004-05=100) 1 Trade-Based Weights 1.1 NEER 87.38 78.32 77.56 73.77 72.54 1.2 REER 101.38 94.61 93.46 89.26 87.78 2 Export-Based Weights 2.1 NEER 89.13 80.05 79.30 75.47 74.22 2.2 REER 104.05 97.42 96.31 91.72 90.21 6-Currency Trade Based Weights 1 Base: 2004-05 (April-March) =100 1.1 NEER 84.86 76.11 75.95 70.51 69.20 1.2 REER 111.86 105.46 104.16 98.77 96.94 2 Base: 2010-11 (April-March) =100 2.1 NEER 92.41 82.87 82.71 76.78 75.36 2.2 REER 97.35 91.77 90.65 85.96 84.36 Source: RBI Bulletin August 12, 2013 Contrary to the moderate INR depreciation signal given by REER indices, the INR encountered sharp market reaction (Refer to Table 4). September 1 to 15, 2013 u Taxmann’s Corporate Professionals Today u Vol. 28 u 125
- 10. 122 Table 4 : INR Depreciation Rate Period average INR US$/ INR Depreciation Exchange Rate 2010-11 45.6096 2011-12 48.1335 5.53% 2012-13 54.3142 12.84% 23 Aug-13 65.0254 19.72% REER has lost all its practical relevance! Perhaps application of consumer price index would better capture the state of inflation in India. Refer to Comparative Chart of CPI and WPI in Figure 3. STEPS TAKEN TO ARREST RUPEE FALL The RBI Governor has explained that ‘the dilemma for RBI is the maintenance of a balance between growth and inflation. The three objectives of a monetary policy are to stimulate growth, contain inflation and ensure financial stability’. The RBI has adopted the following cash tightening measures to stabilize Rupee: u Reduced level of RBI funding: It has halved the daily funds available from it to banks. The funds RBI lends to individual banks under the Liquidity Adjustment Facility (LAF) have been reduced to 0.5% of the deposits of a bank, compared to 1%, or ` 75,000 crore available previously for the entire financial system. u Increase in CRR maintenance level: Banks were allowed to maintain their Cash Reserve Ratio (CRR) on an average daily basis during a reporting fortnight, with a mini- mum of 70 per cent of the required CRR on a daily basis. Effective from July 27, 2013, banks are required to maintain a minimum daily CRR balance of 99 per cent of the requirement. u Increased MSF rate: It has raised lending rates to commercial banks under the Marginal Standing Facility (MSF) by 2 per cent to 10.25 per cent making the loans costlier. u Restriction on NDF: The RBI has restricted the ability of foreign funds to play in the offshore Non-Deliverable Forward (NDF) market.Foreign institutional investors will have to secure mandates from clients for hedging the underlying securities of sub- account investors and holders of partici- patory notes. u Duty on gold import: Gold is India’s big- gest luxury import which is one of the major contributors to widening CAD. Gold contributes about 10% of the total im- ports of India. A series duty increases on gold has reduced the imports in June 2013 to $2.45 billion, which rose again in July 2013 to $2.9 billion. Import duty on refined gold bars has been increased to 10 per cent compared to 8 per cent previously, the third hike in eight months.The factory gate duty on gold bars will be 9 per cent against 7 per cent ear- lier. The import duty on silver increased to 10 per cent from 6 per cent. u Duty on non-essential luxury goods:The Rev- enue Department amended the rules so as to disallow import of flat panel (LCD/ LED/Plasma) television as part of free baggage allowance with effect from Au- gust 26, 2013. These items will attract customs duty at 35 per cent plus an education cess of three per cent, taking the total import duty to 36.05 per cent. This move will also help to boost demand for domestically produced sets, given that the local manufacturers have invested over `1,500 crore in setting up facilities for flat panel TVs. September 1 to 15, 2013 u Taxmann’s Corporate Professionals Today u Vol. 28 u 126 ECONOMY
- 11. 123 u Other measures: They include (i) allowing public sector financial institutions to raise quasi—sovereign bonds to finance long term infrastructure, (ii) liberalising ECB guidelines, (iii) permitting PSU oil com- panies to raise additional funds through ECBs and trade finance and (iv) liberalising NRE/FCNR deposit schemes. u Reduced limit of ODI: The RBI has reduced the limit for Overseas Direct Investment (ODI) by domestic companies, other than oil PSUs, under the automatic route from 400 per cent of net worth to 100 per cent. Oil India and ONGC Videsh are exempt from this limit. This reduced limit would also apply to remittances made under the ODI scheme by Indian companies for setting up un- incorporated entities outside India in the energy and natural resources sectors. u The RBI reduced the limit for remittances made by resident individuals under the liberalized remittances scheme (LRS) from $2 lakh to USD 75,000 a year. Resident individuals are, however, allowed to set up joint ventures or wholly owned sub- sidiaries outside under the ODI route within the revised LRS limit. u Banks are exempted from maintenance of statutory balance with the central bank on incremental non-resident deposits (FCNR and NRE) with a maturity of three years and above. This would encourage the banks to offer higher rate of interest to attract cash flows from NRIs. u The RBI has been selling dollars to arrest rupee fall through State-owned banks. However, tightening liquidity has increased bond yield, resulting in Bank Nifty to fall sharply. This has further weakened the sentiment of the stock market. Meanwhile, on 21st August 2013,Deutsche Bank warned that Rupee could crash to 70 per Dollar: We continue to believe that fundamentally the Rupee is undervalued and has overshot its equilibrium level substantially, but as numerous episodes of past currency crisis have amply demonstrated, under a scenario of deep pessimism, currencies can overshoot substantially and remain so for a long time. India we fear is entering such a zone. MARGIN OF ERROR A widely debated issue is that why is India singled out. The Economist [4] observed that: “India is not being singled out. Since May, when the Federal Reserve first said it might slow the pace of its asset purchases, investors have begun adjusting to a world without ultra-cheap money. There has been a great withdrawal of funds from emerging markets, where most currencies have fallen by 5-15% against the dollar in the past three months. Bond yields have risen from Brazil to Thailand. Some governments have intervened.” Presented below in Table 5 is Comparative Currency Depreciation statistics of AEs and EMDEs during April-August, 2013, which shows that Brazilian Real (currency of another BRICS nation) has depreciated more than the Indian currency. Table 5: Comparative Currency Depreciation Currency Code Country 1-Apr-13 22-Aug-13 Decrease % INR India 54.36 64.2165 18.14% BDT Bangladesh 76.592 76.3768 -0.28% September 1 to 15, 2013 u Taxmann’s Corporate Professionals Today u Vol. 28 u 127
- 12. 124 BRL Brazil 2.019 2.4051 19.12% EUR EU 0.78 0.7464 4.31% GBP UK 0.6595 0.638 3.26% IDR Indonesia 9.68 10.741 10.96% KRW South Korea 1.088 1.117 2.67% LKR Sri Lanka 126.675 131.782 4.03% MYR Malaysia 3.0335 3.2881 8.39% PKR Pakistan 98.35 102.262 3.98% RUB Russia 31.0186 32.9919 6.36% Yen Japan 94.16 97.5 3.55% ZAR South Africa 9.2251 10.2018 10.59% However, India asAsia’s third-biggest economy is more vulnerable than most because of its poor growth performance and high inflation. Although India’s external debts are just 21% of GDP, they are of short maturities. Total financing needs (defined as the current-account deficit plus debt that needs rolling over) are $250 billion over the next year. India’s foreign exchange reserves of $279 billion give a coverage ratio of only1.1 (Refer to Figure 4). This pushes India to higher risk trajectory.4 Moreover, tightening liquidity to arrest currency fall would lead to further economic slow down because of higher borrowing costs. Instead of arresting currency fall, this could end up causing further harm to the beleaguered currency. ••• Figure 4: Reserve Coverage 1. India’s 1990-91 Crisis: Reforms, Myths And Paradoxes, Arvind Virmani December 2001, Planning Commission, Working Paper 4/2001-PC. 2. India’s Trade Deficit: Increasing Fast but Still Manageable,AmitenduPalit, Institute of South Asian Studies in National University of Singapore. 3. Macro-economics and monetary developments = First Quarter Review 2013-14, Reserve Bank of India, July 29,2013. 4. India in trouble :The reckoning - Why India is particularly vulnerable to the turbulence rattling emerging markets, Aug. 24th 2013. Currency Code Country 1-Apr-13 22-Aug-13 Decrease % September 1 to 15, 2013 u Taxmann’s Corporate Professionals Today u Vol. 28 u 128 ECONOMY