From Local Laboratory to Standardisation and beyond Applying a common grading system
•
1 gostou•1,394 visualizações

Presentation at PhUSE 2007

Recomendados
Recomendados
Mais conteúdo relacionado
Destaque
Destaque (8)
Semelhante a From Local Laboratory to Standardisation and beyond Applying a common grading system
Semelhante a From Local Laboratory to Standardisation and beyond Applying a common grading system (20)
Mais de Angelo Tinazzi
Mais de Angelo Tinazzi (13)
From Local Laboratory to Standardisation and beyond Applying a common grading system
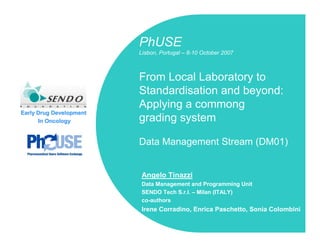
- 1. PhUSE Lisbon, Portugal – 8-10 October 2007 From Local Laboratory to Standardisation and beyond: Applying a commong Early Drug Development In Oncology grading system Data Management Stream (DM01) Angelo Tinazzi Data Management and Programming Unit SENDO Tech S.r.l. – Milan (ITALY) co-authors Irene Corradino, Enrica Paschetto, Sonia Colombini
- 2. SENDO (Southern Europe New Drug Organisation) Non profit Academic Research Organisation (ARO) Early Drug Development in Oncology Coordinating a Network of oncology-hospitals 5 phase I (2 in Italy, 3 in Switzerland) ~ 30 phase II (Italy, Switzerland, Spain) Pre-clinical Laboratory (PK, PD) Head Quarter based in Milan Clinical Development Clinical Operations Data-Management Biostatistics Medical Writing Tinazzi A Corradino I Paschetto E Colombini S: From Local Laboratory to Standardisation and beyond: Applying a common grading system PhUSE 2007, DM01 (Lisbon, Portugal – 8-10 October 2007) 2
- 3. SENDO (Southern Europe New Drug Organisation) - Partners HQ-Activities Clinical development Clinical Operation Data Center Regulatory INT, Milano Monitoring IOSI, Bellinzona, Luca Gianni Logistic Cristiana Sessa Core activities Trial design Selected Screening & MoA Clinical trials Pharmacokinetics Pharmacodynamics and also .... CHUV Lausanne, KSSG S Gallen, Istituto Mario Negri Milano Tinazzi A Corradino I Paschetto E Colombini S: From Local Laboratory to Standardisation and beyond: Applying a common grading system PhUSE 2007, DM01 (Lisbon, Portugal – 8-10 October 2007) 3
- 4. Previous Discuss at PhUSE about Lab Data Management Szilagyi B, Binder C. Complex Laboratory Data Management, Strategies and Tools for a Way out of the Maze. PhUSE 2005; DM05 Tinazzi A Corradino I Paschetto E Colombini S: From Local Laboratory to Standardisation and beyond: Applying a common grading system PhUSE 2007, DM01 (Lisbon, Portugal – 8-10 October 2007) 4
- 5. Laboratory Data Use of Laboratory Tests in Clinical Trials For safety Activity Categories Pharmacodynamic Pharmacokynetic Microbiology Immunology Cytology Pharmacogenomic They are also used to make immediate clinical decision for patient’s care and to define the drug profile….focus on Haematology Chemistry Urinalysis Tinazzi A Corradino I Paschetto E Colombini S: From Local Laboratory to Standardisation and beyond: Applying a common grading system PhUSE 2007, DM01 (Lisbon, Portugal – 8-10 October 2007) 5
- 6. Laboratory Data Characteristics Qualitative vs Quantitative vs Semi-Quantitative Quantitative Most chemistry/hematology They are expressed in a specific unit They refere to a range (minimum-maximum) Semi-Quantitative (i.e. trace) Qualitative (i.e. +/-) Clinical Interpretation Not clinically significant Clinically Significant (Adverse Event) Tinazzi A Corradino I Paschetto E Colombini S: From Local Laboratory to Standardisation and beyond: Applying a common grading system PhUSE 2007, DM01 (Lisbon, Portugal – 8-10 October 2007) 6
- 7. Laboratory Data Characteristics Focus on hematology data White Blood Count (WBC) Hemoglobin Neutrophils Monocytes Basophils Eosinophils Band Lymphocytes Platelets Red Blood Cells Hematocrit Hemoglobin Coagulation tests (i.e. PTT, PT) Tinazzi A Corradino I Paschetto E Colombini S: From Local Laboratory to Standardisation and beyond: Applying a common grading system PhUSE 2007, DM01 (Lisbon, Portugal – 8-10 October 2007) 7
- 8. Laboratory Data Characteristics Focus on chemistry data Electrolytes Sodium Potassium Chloride Bicarbonate Carbon Dioxide They maintain body fluid and blood pressure essential for the function of most body systems Tinazzi A Corradino I Paschetto E Colombini S: From Local Laboratory to Standardisation and beyond: Applying a common grading system PhUSE 2007, DM01 (Lisbon, Portugal – 8-10 October 2007) 8
- 9. Laboratory Data Characteristics Focus on chemistry data Enzymes Aspartate Aminotransferase (AST/SGOT) Alanine Aminotransferase (ALT/SGPT) Gamma Glutamyl Transferase (γGT) Alkaline Phosphatase Troponin I Creatine Phosphokinase (CPK) Lactate Dehydrogenase (LDH) They help diagnose liver and heart diseases Tinazzi A Corradino I Paschetto E Colombini S: From Local Laboratory to Standardisation and beyond: Applying a common grading system PhUSE 2007, DM01 (Lisbon, Portugal – 8-10 October 2007) 9
- 10. Laboratory Data Characteristics Focus on urinalysis data Protein Cells Hormone They tests the health of organ and body process Tinazzi A Corradino I Paschetto E Colombini S: From Local Laboratory to Standardisation and beyond: Applying a common grading system PhUSE 2007, DM01 (Lisbon, Portugal – 8-10 October 2007) 10
- 11. Laboratory Data Characteristics Normal Ranges Normal ranges, or reference ranges, are used to determine if a person’s value is “normal”. The ‘normal range’ for a given constituent of clinical interest is considered to be the concentrations of the constituent which are found in the body fluid or excretions of a group of clinically normal persons. by gender by age fasting / non-fasting analysis method / kit used by laboratory may change over time, and so the normal ranges Tinazzi A Corradino I Paschetto E Colombini S: From Local Laboratory to Standardisation and beyond: Applying a common grading system PhUSE 2007, DM01 (Lisbon, Portugal – 8-10 October 2007) 11
- 12. Local Laboratory vs Central Laboratories Central Labs Lab samples are analysed (and taken) in the same lab center Standard methods (and machine calibration) Unique normal ranges for each sample Electronic data transfer (no data-transcription errors) Local Labs Lab samples are analysed (and taken) in different lab centers Sample can be taken anywhere / anytime Multiple normal ranges, so different methods applied No transport issue, but data need to re-keyed Tinazzi A Corradino I Paschetto E Colombini S: From Local Laboratory to Standardisation and beyond: Applying a common grading system PhUSE 2007, DM01 (Lisbon, Portugal – 8-10 October 2007) 12
- 13. Local laboratory data-management Tinazzi A Corradino I Paschetto E Colombini S: From Local Laboratory to Standardisation and beyond: Applying a common grading system PhUSE 2007, DM01 (Lisbon, Portugal – 8-10 October 2007) 13
- 14. Laboratory CRF – Option 1 Normal Ranges and Unit Collected directly onto patient CRF Tinazzi A Corradino I Paschetto E Colombini S: From Local Laboratory to Standardisation and beyond: Applying a common grading system PhUSE 2007, DM01 (Lisbon, Portugal – 8-10 October 2007) 14
- 15. Laboratory CRF – Option 2 120 0 100 0 350 0 120 109/L (100-350) Tinazzi A Corradino I Paschetto E Colombini S: From Local Laboratory to Standardisation and beyond: Applying a common grading system PhUSE 2007, DM01 (Lisbon, Portugal – 8-10 October 2007) 15
- 16. The SENDO Experience with 4 Trials Study Nr Nr. of Nr. of samples Nr. of Average Nr. of Patients collected Different Local Labs Used (average nr by Local by each Patient, min-max) Labs Used patient (min-max) 1 (ph I) 34 37 (2-90) 44 3.0 (1-7) 2 (ph I) 32 27 (2-79) 33 2.7 (1-6) 3 (ph I) 20 24 (2-61) 31 2.8 (1-5) 4 (ph II) 38 14 (2-33) 11 1.4 (1-3) Overall in 97 SENDO Repository High heterogeneity in unit reported (the example is for Platelets count only) Tinazzi A Corradino I Paschetto E Colombini S: From Local Laboratory to Standardisation and beyond: Applying a common grading system PhUSE 2007, DM01 (Lisbon, Portugal – 8-10 October 2007) 16
- 17. Quality Control Missing data (unit, range, interpretation) Hand writing legibility Unit and value incosistencies Normal Range Validity Outliers detection Tinazzi A Corradino I Paschetto E Colombini S: From Local Laboratory to Standardisation and beyond: Applying a common grading system PhUSE 2007, DM01 (Lisbon, Portugal – 8-10 October 2007) 17
- 18. Statistical Analysis Process Main Analysis Univariate (mean, std, min, max, etc) Shift Tables / Change From Baseline (absolute, %, log) Correlations Time to Event (i.e. Time to lowest observation, or time to nadir) Worst toxic effect observed Data must be ‘manipulated’ so that results obtained from different labs can be summed, weighted and compared Tinazzi A Corradino I Paschetto E Colombini S: From Local Laboratory to Standardisation and beyond: Applying a common grading system PhUSE 2007, DM01 (Lisbon, Portugal – 8-10 October 2007) 18
- 19. Statistical Analysis Process Standardisation Ensures that all laboratory values are expressed in the same unit (Système International d’Unités - SI) It consists in the adoption of a standard unit by applying conversion factors Multiply 0.2558 Potassium 13.7 mg/dL SI unit is mmol/L 3.5 mmol/L Tinazzi A Corradino I Paschetto E Colombini S: From Local Laboratory to Standardisation and beyond: Applying a common grading system PhUSE 2007, DM01 (Lisbon, Portugal – 8-10 October 2007) 19
- 20. Statistical Analysis Process Normalisation 5-29 12-35 The application of a normalisation method to ensure 10-45 homogenization of results obtained from different local 15-40 labs 12-30 U s − Ls Reference/Standard Range s = Ls + ( x − L x ) 5 U x − Lx Local Labs Range 10 Observed Value 12 12 The standard reference can be taken from the literature or from a sample of 15 normal ranges by taking the 10°and the 90°percentiles 29 30 Assume an observed value of 10 measured in the lab with normal range 5-25, if 35 our standard range has been determined to be 10-35….. 40 35 − 10 45 s = 10 + (10 − 5) = 16.25 The normalised value −5 25 Normalization. Karvanen J. DIA, Vol. 37, pp. 101-107; 2004 The statistical basis of Laboratory Tinazzi A Corradino I Paschetto E Colombini S: From Local Laboratory to Standardisation and beyond: Applying a common grading system PhUSE 2007, DM01 (Lisbon, Portugal – 8-10 October 2007) 20
- 21. Applying a common grading system: the CTCAE NCI Common Terminology Criteria for Adverse Events – CTCAE (v3.0) A standard in oncology for classifying Adverse Events Severity A Grading system ranging from ‘0’ (no toxic effect) to ‘4’ (severe toxic effect), with the addition of ‘5’ (death) An event has unique representation Events are organised in categories Link with MedDRA Term CTCAE Event Categories Allergy / Immunology Gastrointestinal Ocular / Visual Auditor / Ear Growth and Development Pain Blood / Bone Marrow Hemorrhage / Bleeding Pulmonary / Upper Respiratory Cardiac Arrhythmia Hepatobiliary / Pancreas Renal / Genitourinary Coagulation Infection Secondary Malignancy Constitutional Symptoms Lymphatic Sexual / Reproductive Function Death Metabolic / Laboratory Surgery / Intra-Operative Injury Dermatology / Skin Musculoskeletal / Soft Tissue Syndromes Endocrine Neurology Vascular Tinazzi A Corradino I Paschetto E Colombini S: From Local Laboratory to Standardisation and beyond: Applying a common grading system PhUSE 2007, DM01 (Lisbon, Portugal – 8-10 October 2007) 21
- 22. Applying a common grading system: the CTCAE Qualitative Definition (Arthritis) a grade 1 is defined as “Mild pain with inflammation, erythema, or joint swelling, but not interfering with function” a grade 4, is defined as “Disabling” Quantitative Definition (Diarrhea) a grade 1, is defined as “Increase of <4 stools per day over baseline; mild increase in ostomy output compared to baseline” a grade 4, is defined…. Quantitative Definition based on Lab Data Results (Platelets Count) Grade 1 Grade 2 Grade 3 Grade 4 <LLN – 75,000/mm3 <75,000 – 50,000/mm3 <50,000 – 25,000/mm3 <25,000/mm3 <LLN – 75.0 x 10^9 /L <75.0 – 50.0 x 10^9 /L <50.0 – 25.0 x 10^9 /L <25.0 x 10^9 /L Tinazzi A Corradino I Paschetto E Colombini S: From Local Laboratory to Standardisation and beyond: Applying a common grading system PhUSE 2007, DM01 (Lisbon, Portugal – 8-10 October 2007) 22
- 23. Example of Platelets Count from Local Lab to CTCAE Calculation CTCAE Platelets Definition Grade 1 Grade 2 Grade 3 Grade 4 <LLN – 75,000/mm3 <75,000 – 50,000/mm3 <50,000 – 25,000/mm3 <25,000/mm3 <LLN – 75.0 x 10^9 /L <75.0 – 50.0 x 10^9 /L <50.0 – 25.0 x 10^9 /L <25.0 x 10^9 /L Tinazzi A Corradino I Paschetto E Colombini S: From Local Laboratory to Standardisation and beyond: Applying a common grading system PhUSE 2007, DM01 (Lisbon, Portugal – 8-10 October 2007) 23
- 24. Quality Control – Additional tips in identifying Invalid Values For each parameter, sort the converted SI value in ascending order Review the lowest and highest values when are different from the expected/normal values by a factor of 10,100,1000 Look for jumps in values Look for values that are substantially above or below typical normal ranges values Review grade 3-4 CTCAE Tinazzi A Corradino I Paschetto E Colombini S: From Local Laboratory to Standardisation and beyond: Applying a common grading system PhUSE 2007, DM01 (Lisbon, Portugal – 8-10 October 2007) 24
- 25. Conclusions – 1 In many studies, laboratory data represent 50-80% of the data to be collected Central laboratory are not always applicable, however electronical data-transfer from main individual laboratory used may help Tools (i.e. SAS macro routines), are required to manage and control the various steps of Local Laboratory Data collection and analysis Specialist in laboratory data-management Tinazzi A Corradino I Paschetto E Colombini S: From Local Laboratory to Standardisation and beyond: Applying a common grading system PhUSE 2007, DM01 (Lisbon, Portugal – 8-10 October 2007) 25
- 26. Conclusions – 2 Estabilish a central data-repository of local labs How small are the differences / abnormalities that need to be defined? Choice between a more or less sophisticated method of harmonization of laboratory results (e.g. Normalization vs SI Standardization) CDISC LAB Team Tinazzi A Corradino I Paschetto E Colombini S: From Local Laboratory to Standardisation and beyond: Applying a common grading system PhUSE 2007, DM01 (Lisbon, Portugal – 8-10 October 2007) 26
- 27. Questions Tinazzi A Corradino I Paschetto E Colombini S: From Local Laboratory to Standardisation and beyond: Applying a common grading system PhUSE 2007, DM01 (Lisbon, Portugal – 8-10 October 2007) 27