SlideShare uma empresa Scribd logo
1 de 8
Baixar para ler offline
The International Journal Of Engineering And Science (IJES)
||Volume|| 2 ||Issue|| 10 ||Pages|| 66-73 ||2013||
ISSN (e): 2319 – 1813 ISSN (p): 2319 – 1805

Remote Sensing for Mapping Land-Use/Cover Changes and
Urban Sprawl in Sekondi-Takoradi, Western Region of Ghana
M. S. Aduah, P. E. Baffoe
Department of Geomatics Engineering, University of Mines and Technology, P. O. Box 237, Tarkwa, Ghana

------------------------------------------------------ABSTRACT---------------------------------------------------Land use/land cover influences a variety of processes on the Earth surface which also generate
feedback effects on the natural environment, economic and social systems. Poorly managed changes in urban
areas have resulted in many catastrophic consequences such as floods, landslides, droughts etc. The Landsat
satellite system has long term data archives and can be used to assess the land cover changes in the landscape
to provide information to support future urban planning. In this paper Landsat images were used to map the
land use/land cover changes in the city of Sekondi-Takoradi in the Western region of Ghana from 1988 to 2011
through a change detection process. The post-classification method of change detection was used and the
accuracies achieved were high. The analysis showed that a large portion of the city and its surrounding areas
has been converted from natural surfaces to impervious surfaces. Also it was observed that precipitation has
reduced considerably during the period and high temperatures have been observed. A model developed between
land use change and time have showed that in the next 50 years if the trend of land use change continues, there
will be complete removal of natural surfaces. These could lead to increased incidence and severity of flash
floods and droughts. Therefore the data produced in this study can be used to guide effective urban planning to
mitigate the combined effects of land use changes due to urbanisation and climate change. This study
demonstrates the critical role remote sensing can play in the developing world in terms of providing data for
planning since many countries do not have the resources to map their territories regularly through conventional
means.

Key words: change detection, land use/land cover, Landsat, remote sensing, Sekondi-Takoradi
----------------------------------------------------------------------------------------------------------------------------- ---------Date of Submission: 01st, October, 2013
Date of Acceptance: 30th, October, 2013
-------------------------------------------------------------------------------------------------------------------------------- -------

I.

INTRODUCTION

Land use/land cover (LULC) influences a variety of processes on the Earth surface. These processes also generate
feedback effects on the natural environment, economic and social systems. LULC is pervasive in urbanised environments
worldwide and reflects a society’s interactions with the physical environment (Campbell, 2002). Hence poorly managed
changes in urban areas have the potential to result in many social, economic and environmental catastrophes such as floods,
landslides, droughts, lack of safe drinking water and loss of crop productivity etc. It is imperative therefore that urban land
use is planned properly to ensure that sustainable social, economic and environmental goals are achieved. To achieve these
objectives it is important to map the existing LULC of the urban areas. It is only then that it will be possible to analyse which
land use best suits a particular land cover considering all necessary variables. For example, it will not make economic sense
to build low cost estates on rich agricultural lands and it will not make environmental sense to construct certain industries in
riparian habitats. The overall objective of ensuring that the urban land use is not mixed is to ensure sustainable utilization of
the natural resources.
Urban LULC occurs mostly by the removal of vegetation through anthropogenic activities such as construction of
housing estates, road construction, agriculture and livestock raising, forest harvesting and mining etc. These causes are
influenced by population increase, government policy and economic development. In some places the occurrence of major
floods can also alter the land cover though the floods are also influenced by LULC. Other causes of LULC changes include
bushfires and climatic changes (Aduah et al., 2012). LULC changes in urban areas create impervious and non-evaporative
surfaces. The consequences include increases in storm run-off, river discharge rates and floods in low lying areas. Others
include increased soil erosion and alteration of the surface energy balance resulting in increased land surface temperatures
and urban heat islands (Aduah et al., 2012). These changes also cause high evaporation rates and decreased productivity of
soils and crops. Over long period of time urban land cover turning into impervious area will reduce the ground water
recharge and pollution of water bodies due to non-point source pollution and sedimentation. Pollution and sedimentation of
water bodies will reduce wetland habitats and affect the flora and fauna hence reducing biodiversity. Consequently water
treatment for the urban areas would be expensive and supplies would be limited.

www.theijes.com

The IJES

Page 66
Remote Sensing for Mapping Land-Use/Cover Changes and…
LULC and its changes have been mapped extensively in the past five decades through multiple
techniques. These include ground surveys, aerial photogrammetry and satellite remote sensing. However, the
use of ground surveys and aerial photogrammerty is expensive and time consuming and therefore normally
limited to small areas and low temporal domains. Satellite remote sensing with its long term data, wide spatial
and synoptic coverage and high temporal resolution has become the most important technology for mapping
LULC and its changes for the past three decades after the launch of the Landsat group of satellites. Today
LULC is one key area where satellite images are routinely used. This is mainly because satellite images provide
synoptic and spatial coverage over large areas for a long period of time and repeated views of the same location
can be obtained. The basis of remote sensing is that changes occurring in the land cover alter the reflected
radiation which is recorded in the images. Also the development of high spatial and spectral resolution sensor
technology (e.g. Ikonos, Orbview, GeoEye, QuickBird etc) has provided the opportunity to conduct detailed
inventory of LULC. Consequently, it is now possible to generate detailed and timely LULC inventories for
many Countries using a variety of optical and microwave satellite images. Until recently this was only possible
with aerial photography interpretation and ground surveys.
Change detection is the process of categorizing differences in the state of an object or phenomenon by
observing it at different times (Abiy, 2010). Remote sensing methods of mapping LULC change include multidate composites, change vector, image algebra (image differencing, image ratio), on-screen digitization, GIS
overlay and post-classification comparison (Zubair, 2006; Coppin et al., 2004; Lu et al., 2004, Lunetta and
Elvidge, 1999 and Campbell, 2000). These methods have been used extensively over the past four decades. For
examples of studies see Manonmani et al., 2010 for multi-date composites and Aduah and Aebayir, 2012;
Prabaharan et al., 2010; Boakye et al., 2008 for post classification comparison techniques.
The post classification method is the most widely used change detection algorithm. The approach
classifies and labels two images from different dates. The area of change is then calculated through direct
comparison of the classification results. Main advantages of post classification include: detailed “from – to”
information. Also the spectral complexities associated with the analysing images acquired at different times of
year or with different sensors is avoided. However, the accuracy of the analysis depends on the accuracy of the
image registration and classification of the individual images. This implies that the individual classification be
executed carefully so as to achieve the best accuracy as possible (Abiy, 2010). The extensive application of
these methods in the remote sensing community has ensured that LULC inventories are available for many
Countries.
The availability of LULC inventories serves as the baseline upon which effective monitoring and
management of the urban environment can be carried out. This enhances the ability to combat or adapt to the
negative effects LULC change and global climate change at the local scale. To be able to ascertain how the
LULC has changed and how it has affected many environmental parameters it is imperative to conduct effective
LULC inventory over a period of time. Since the LULC changes are speculated to affect the magnitudes of the
predicted effects of climate change, it is also relevant to predict the status of the LULC in the future. This study
is therefore conducted in the Sekondi-Takoradi Metropolitan area of Ghana to map LULC and its change using
the post classification comparison method. This is to provide data suitable for monitoring and managing the
local environment.
Materials and Methods
The material and methods used in this research are elaborated in the sections below.
Study Area
Sekondi-Takoradi metropolis (Figure 1) comprises of the cities of Sekondi and Takoradi. The
metropolis is located within latitude 050 55’ North and longitude 010 46’ West with a land area of about 49.78
km2. It is the capital of the Western Region of Ghana and it is Ghana's fourth largest city. It also serves as an
industrial and commercial center. The major industries are timber, plywood, shipbuilding and railroad repair and
recently, oil. The Metropolis is characterized by faulted shales and sandstone resting on a hard basement of
granite, gneiss and schist (Anon., 2011b). The faulting system has influenced the land form along the coastline.
It clearly follows the main fault direction of North East (Anon., 2011b).

www.theijes.com

The IJES

Page 67
Remote Sensing for Mapping Land-Use/Cover Changes and…

Figure 1: Map showing the location of the Study Area in Ghana
Generally, the Metropolis does not experience severe weather conditions. The climate of the metropolis
is equatorial, with an average annual temperature of about 22 0c. Rainfall is bi-modal, with the major season
occurring between March and July and the minor season occurring between August and November. The mean
annual rainfall is about 1,380 mm, covering an average of 122 rainy days (Anon., 2011b). The natural
vegetation has largely been degraded due to slash and burn farming practices and other human activities. The
existing vegetation in the north and central portions of the Metropolis is mainly woodland. However, along the
coastal areas there are thickets interspersed with tall grass species (Anon., 2011b). The Metropolis is of varied
landscape; the coast line has capes and bays, which have been largely eroded. The central portion of the
metropolis is low lying while the rest of the area is undulating with ridges and hills. The metropolis is drained
by two main rivers; the Whin and the Kansawora Rivers, while the lagoons are the Essei and the Butre (Anon.,
2011b). Major crops cultivated in the metropolis are cassava, maize, plantain, cocoyam, yam, sugarcane, oil
palm, citrus, sweet potato, vegetables and coconut. Livestock reared include sheep, goats, local and commercial
poultry, and to a lesser extent, cattle. Non-traditional commodities include grasscutter, beekeeping, mushroom,
snail and agro-forestry/woodlots. In the fisheries sub-sector, marine fishing and aquaculture are the major areas.
Data acquisition
The data used for the study included subset of two Landsat images of 30 meter spatial resolution captured in 1988
and 2008. One image was obtained from the enhanced thematic mapper plus satellite (ETM+) and the other was from the
thematic mapper (TM). The images were ordered and downloaded from the United States Geological Survey (USGS)
website. Landsat images were chosen because they covered the period of the intended study and they have high spatial
resolution suitable for the USGS Land cover classification system level 1 (Campbell, 2002; Jensen, 2000). The selection of
the images was restricted to similar season to avoid seasonal differences in reflected radiation due to vegetation senescence.
In addition, sample land cover information was collected with reference to the 2008 ETM+ image during field work in
January 2012. Therefore the land cover map accuracy assessment was executed for only this image. The field work was also
used to measure coordinates of known ground points for geo-referencing of the two images. The geo-referencing was
executed with the ArgGIS software from Environmental Systems Research Institute (ESRI). Also digital line maps were
obtained from the Survey Division of the Lands Commission, Ghana. In order to draw inferences with relevant
environmental variables, precipitation and temperature data was obtained from the Metrological Agency of Ghana. Also
discharges of two rivers (Whin and Kansawora) were obtained from the Hydrological Service Department of Ghana’s
Ministry of Water Resources Works and Housing. In figures … and …precipitation and temperature measured at the
Takoradi Airport from 2001 to 2011 is displayed.

Image Registration
Image registration is executed to assign real world coordinates to images. This is to correct for
geometric errors associated with the satellite images due a variety of reasons. These include instrumental errors,
attitude of the sensors with respect to the rotation of the Earth and swath width of the sensor etc. Also image
registration is executed to assign coordinates systems and projections to images. Image registration ensures that
the features and process found on the satellite image are allocated their correct dimensions and positions. This is
very important for change detection since we only compare the same geographic location at different times. The
image registration in this study was executed with the ArcGIS software from ESRI. The images were registered
to the 1984 World Geodetic System Universal Transverse Mercator (WGS ’84 UTM) Zone 30 North Projection.
Although the images were already geo-referenced to the UTM ‘84 zone 30 N, they were re-projected to ensure
that they are allocated their correct ground coordinates. This is normally referred to as geometric correction.

www.theijes.com

The IJES

Page 68
Remote Sensing for Mapping Land-Use/Cover Changes and…
Land Cover Classification
Image classification is performed to identify and assign real world thematic classes to the image pixels.
In this study image classification was done in two stages, first by performing an unsupervised classification to
assist in colleting additional training samples for the supervised classification. The maximum likelihood
classification algorithm was selected because it has the ability to incorporate the statistics of the training
samples before assigning the land covers to each pixel. The training samples obtained during fieldwork in
January 2012 were used together with those collected after unsupervised classification. The landsat image bands
used for the classification were the visible, near-infrared, middle and far-infrared. After image classification the
land cover maps generated were filtered with the majority filter to remove the “salt-and-pepper appearance”
(Lillesand and Kiefer, 2000) and to enhance the cartographic presentation. The landcover classes generated were
built-up, grassland/shrubs, forest/farm lands, rivers/lakes/lagoons and sea. See Table 1 for the display of the
nomenclature used for the land covers.
Table1: Land cover classes nomenclature
Code
1
2
3
4
5

LULC Classes
Built-up land
Grassland/shrubs
Forests/farm lands
Water
Sea

Description derived from USGS Level I
Urban residential, commercial, industrial, transportation and services
Grasses, shrubs,bushes
Forests, palm, rubber plantations,coacoa farms
Rivers, streams, lagoons, bays, estruaries, wetlands, lakes, dams
Sea water in the Atlantic Ocean

Urban LULC Change detection
Change detection is a process to record the changes that have occurred in the LULC over a period of
time. The change detection process to use depends on the phenomena or feature under investigation. If the
change being studied has high temporal resolution, the images and procedures must account for the time. The
change detection process adopted for this study is the post classification comparison. This is because the method
is simple to execute and it provides detailed “from to” statistics suitable for decision making. The method was
executed by using the two land cover maps generated for 1988 and 2008 in a raster GIS analysis. The 1988 land
cover map was reclassified and combined with that of 2008 using map algebra functions within the spatial
analyst of the ArcGIS software. The result was a land cover change map from 1988 to 2008. Also, the statistics
of the change was extracted and analyzed using tables and graphs.
Urban sprawl measurement and Analysis using Shannon’s Entropy
Urban sprawl is the ‘scatteredness” of an urban area (Quezada et al., 2009). Urban sprawl has been
measured in a variety of ways (Tewolde and Cabral, 2011; Besussi et al, 2006 ). However, the most common
form of measurement and analysis has been the use of the Shannon’s entropy index (Tewolde and Cabral, 2011).
It is computed by defining zones along major roads or by using buffers from the city centre(s) and calculating
the density of built-up areas in each zone. This means the “scaterrednes” of development is measured along
major roads or from the city centre. The index ranges from 0 to 1. An index of 0 means there is compactness in
the urban development and efficient utilization of land is implied while an index of 1 means there is scattered
development. In this paper the Shannon’s entropy, En, was calculated for the 1988 and 2008 land cover maps
using the formula in equation (1).
(1)
Where, pi=
and xi is the density of land development, equal to area of built-up divided by total land
th
area in i of n total zones, n is the number of zones from city centre.
Results and Discussion
Urban Land cover/Land use
Results of the study are shown in the figures and tables below. In Figure 2, land cover maps of 1988
and 2008 are displayed. Five land cover classes: built-up areas, grasslands, forest, rivers/lakes and sea were
identified in the study area. The classification accuracy estimate was executed for the 2008 image since ground
truth data was captured with respect to that image. The overall accuracy of the classification generated from the
confusion matrix was 88.88%.

www.theijes.com

The IJES

Page 69
Remote Sensing for Mapping Land-Use/Cover Changes and…
It can be observed from Figure 2 and Table 3 that in 1988 the built-up area was 14.14 km,2 only 3% of the study
area while the forests covered 332.66 km2, 70% of the study area. The land cover map of 2008 however shows that the builtup area was now 51.31 km2, 11% of the study area, an increase of 263 % (Table 4). In addition, the forested areas had
reduced to 293.56 km2, a reduction of 12% (Table 4). In Figure 3 and Table 5 the LULC change map and statistics are also
displayed. It can be observed from figure 4 that built-up areas in 2008 have mainly been taken from grasslands and forests.
Also a substantial part of the forested areas have been converted to grassland or shrubs. In addition, some grasslands in 1988
have been reforested by 2008. This is possible because there are commercial rubber and palm plantation farms in the
northern sections of the study area. The built-up areas have increased about 263% in the twenty year period while forested
areas have reduced by more than 11% and grasslands by almost 2%. The reduction of the forest and grasslands and increase
of urban built-up areas indicates a substantial increase in impervious surface areas. It is well noted that impervious surface
areas are a major contributing factor to urban floods and urban heat island effects (Aduah et al., 2011). Therefore it is
necessary that plans are made to convey run-off in the Takoradi-Sekondi Metropolis with a variety of objects. These could
include well designed drains, ponds and wetlands. In Table 5 it is also interesting to note that some of the urban areas (rivers
to urban: 0.68 km2) have encroached on the river banks most of which are wetlands. It is not surprising that many of the
residences in these areas experience floods the most.

Figure 2: A map showing land cover/land use for 1988 and 2008
Table 3: land cover statistics
1988
Class
Built-up
Grassland
Forest
Water
Sea
Total

Area(km2)
14.148
72.958
332.658
2.957
51.472
474.193

2008
% of Area
2.98
15.39
70.15
0.62
10.86
100.00

Area(km2)
51.314
74.304
293.561
5.986
49.028
474.193

% of Area
10.82
15.67
61.91
1.26
10.34
100.00

Table 4: Land cover change statistics from 1988 to 2008

Land cover
Built-up
Grasslands
Forest
Water
Sea
Total

1988
14.148
72.958
332.658
2.957
51.472
474.193

Area (Km2)
2008
51.314
74.304
293.561
5.986
49.028
474.193

change
37.166
1.346
-39.097
3.029
-2.444

% change
262.691
1.845
-11.753
102.404
-4.747

The urban land cover change detected in Sekondi-Takoradi Metropolis shows that the city have experienced
massive growth in the urban space and therefore problems associated with such changes are expected. These include high
urban temperatures, high vulnerability to floods and reduction in rich agricultural areas. Some of the causes of these massive
urban changes in the study area include high growth rate of population (Ghana statistical Service, 2000) and high population
density. Also an increase in the Gross Domestic Product (GDP) of the city accounts partly for the high rate of urbanization.
Many people are able to buy land and construct their own homes. Also many firms have established their regional or subregional offices and factories in the city within the period and many of them have constructed staff accommodation. The
high rate of urbanization could also be negative for the communities living at the city fringes. This is because many of the
peasant farmers have lost their lands to real estate developers, individuals and companies over the years. For many of these
farmers they have no other source of income and therefore could become poorer as a result of losing their farm lands.

www.theijes.com

The IJES

Page 70
Remote Sensing for Mapping Land-Use/Cover Changes and…
The urban change therefore has both negative and positive effects on the community. However, until
detailed and timely inventory is done, it is not possible to make any assessment. Land cover land use map is
therefore one of the first statistic required to manage the urban space efficiently to generate opportunities for all
sectors of the economy. Without these maps it will be difficult to assess the success of any urban planning
strategy.

Figure 3: Land cover changed map from 1988 to 2008
Classes: 11-urban unchanged, 12: urban to grassland, 13: urban to forest, 14: urban to water bodies, 15: urban to
sea, 21: grassland to urban, 22: grassland unchanged, 23: grassland to forest,
Table 5: Land cover changed statistics
Area(Km2)
12.196
0.655
0.743
0.333
0.221
19.997
20.005
32.103
0.850
0.003
17.842
53.473
260.677
0.666
0.001
0.683
0.168
0.003
1.953
0.150
0.596
0.003
0.035
2.184
48.654
474.193

Land cover
Urban unchanged
Urban to Grassland
Urban to Forest
Urban to Rivers
Urban to Sea
Grassland to Urban
Grassland unchanged
Grassland to Forest
Grassland to Rivers
Grassland to Sea
Forest to Urban
Forest to Grassland
Forest unchanged
Forest to rivers
Forest to Sea
Rivers to urban
Rivers to Grassland
Rivers to Forest
Rivers unchanged
Rivers to sea
Sea to Urban
Sea to grassland
Sea to Forest
Sea to Rivers
Sea unchanged
Total

24: grassland to water, 25: grassland to sea, 31: forest to urban, 32: forest to grassland, 33: forest unchanged, 34:
forest to water, 35: forest to sea, 44: water, 55: sea unchanged
Urban Sprawl Analysis
To evaluate the level of dispersion of the urban development in the study area, the Shannon entropy index was
calculated for the two dates studied. The study area is a coastal city hence the area of the sea was removed from the land
cover maps before the sprawl analysis was done. The land cover maps of the two dates (1988 and 2008) were reclassified
into built-up and non-built-up and crossed with 2 km buffer zones (Figure 4a) whose centre start from the city centre.
Figure 4b show the build-up and non-built-up lands in 1988 and 2008 respectively. The area of built-up in each zone was
calculated and the Shannon entropy was determined for each zone as well as the entire study area. The Shannon entropy for
the study area ranged from 0.59 to 0.62 in 1988 and 2008 respectively. This is an indication that sprawling in the study area
has not increased substantially between the two dates despite a massive (more than 263%) increase in built-up areas (Table
4).

www.theijes.com

The IJES

Page 71
Remote Sensing for Mapping Land-Use/Cover Changes and…

Figure 4: a) Buffer zones in Sekondi-Takoradi and b) Built-up areas in 1988 and 2008
The fact that the city is less scattered therefore makes provision of services and infrastructure such as
electricity, water, schools, hospitals and roads less complicated in terms of their spatial distribution. However,
by inspecting the entropies for each zone it is revealed that the values for zones 6 km to 10 km from the city
centre had the highest values for both the 1988 and 2008 land cover maps. This together with field evidence
shows that some of the sections of the study area are more fragmented than others. For example new
neighborhoods in the north eastern part of the study area, behind Kansaworado, Anaji Namibia and Ntankoful
communities are scattered. There are many uncompleted buildings within a few completed residential ones. It is
therefore imperative that urban planning methods that suit all these sections of the city be adopted for a
sustainable utilization of the limited land resources in the study area. It is also important that plans are made to
safeguard the agricultural lands in the outskirts of the city. The result of the study indicates that this can be done
since the city has only few isolated settlements.
Conclusions
Land cover and its changes in the Sekondi-Takoradi Metropolis have been successfully mapped using
satellite remote sensing techniques. The techniques adopted generated acceptable accuracies. The land cover
changes in the study area have changed drastically since 1988. The urban area has more than doubled, while the
forest areas have decreased by more than 10%. Also the areas covered by grasslands have increased. This
means the percentage of impervious surface areas have increased tremendously raising the vulnerability of
sections of the community living near rivers. Furthermore, urban sprawl analysis showed that Sekondi-Takoradi
has not witnessed substantial sprawling between 1988 and 2008. However, sections of the city especially
between 6 km and 10 km from the centre have high sprawling. The results of this study further indicate the
importance of remote sensing to urban environmental monitoring and management especially in Africa. The city
authorities in Sekondi-Takoradi can use the data generated to aid their future development plans that also
protects agricultural lands in the outskirts. Also since land cover affects the climate, it is important that the land
cover in the city is managed so as to protect the citizens from phenomenon such as urban heat island effects and
floods.

www.theijes.com

The IJES

Page 72
Remote Sensing for Mapping Land-Use/Cover Changes and…
REFERENCES
[1.]
[2.]
[3.]
[4.]
[5.]
[6.]
[7.]
[8.]
[9.]
[10.]
[11.]
[12.]
[13.]
[14.]
[15.]
[16.]
[17.]
[18.]
[19.]
[20.]
[21.]

[22.]
[23.]
[24.]
[25.]

Abiy, D. (2010), “Land Use/Land cover Dynamics and Soil Erosion Risk, for Sustainable Land Management in North Central
Ethiopia: The Case of Antsokia-Gemza Woreda”, Msc. Thesis, Addis Ababa University, Ethiopia, 75pp.
Aduah, M. S., Mantey, S. and Tagoe, N. D. (2012), “Mapping land surface temperature and land cover to detect urban heat island
effect: a case study of Tarkwa, South West Ghana”, Research Journal of Environmental and Earth Sciences, vol. 4, 1, pp. 68-75.
Aduah, M. S. and Aabeyir, R. (2012), “Land cover dynamics in Wa Municipality, Upper West Region of Ghana”, Research
Journal of Environmental and Earth Sciences, Vol. 4, 6, pp. 658-644.
Anon. (2009), “Fundamentals of Remote Sensing”, http://pcmas1.ccrs.nrcan.gc.ca/e.htm,
Last Modified: May 4, 2009, Accessed: December 14, 2011.
Anon. (2011a), “Ghana Western Region”, http://www.modernghana.com/favicon.ico, Last Modified: September 19, 2011,
Accessed: September 19, 2011.
Anon. (2011b), “Districts-Western Region”, http://mofa.gov.gh/site, Last Modified: September 24, 2011, Accessed: January 17,
2012.
Anon. (2012), “Sekondi-Takoradi”, http://en.wikipedia.org/wiki/, Last Modified: January
4, 2012, Accessed: January 17,
2012.
Attua, E. M. and Fisher, J. B. (2011), “Historical and Future Land Cover Change in a Municipality of Ghana”, Earth Interactions,
Vol. 15, pp.2-3.
Besussi, E., Chin, N. and Longley, P. A. (2006), “The Structure and Form of Urban Settlements”, In: Tarek, R and Juergens, C,
(eds.), Remote Sensing of Urban and Suburban Areas, Springer.
Boakye, E., Odai, S. N., Adjei, K. A. and Annor, F. O. (2008), “Landsat Images for Assessment of the Impact of Land Use and
Land Cover Changes on the Barekese Catchment in Ghana”, European Journal of Scientific Research, Vol. 22, No.1, pp.269-278.
Campbell, J. B., (2002), “Introduction to Remote Sensing”, 3rd Edition, London: Taylor and Francis, 621pp.
Coppin, E., Jonckheere, I., Nackaerts, K. and Muys, B. (2004),”Digital Change Detection Methods in Ecosystem Monitoring: a
review”, International Journal of Remote Sensing, 25, 9, pp. 1565 – 1596.
Hunt, R., Hamilton, R. and Everitt, J. (2009), “Mapping Weed Infestations Using Remote Sensing”, http://www.fs.us/eng/rsac,
Last Modified: April 27, 2009, Accessed: December 14, 2011.
Jensen, J. R. (2000),”Remote Sensing of the Environment: an Earth Resource Perspective”, New Jersey: Prentice-Hall.
Kabba, V. T. S. and Jiangfeng, L. (2011), “Analysis of Land Use and Land Cover Changes and Their Ecological implications in
Wuhan China”, Journal of Geography and Geology, Vol. 3, No. 1, 15pp.
Lillesand, T. M. and Kiefer, R. W. (2000), “Remote Sensing and Image Interpretation”, John Wiley & Sons, Chichester, pp.724.
Lu, D., Mausel, P., Brondizio, E. and Moran, E. (2004), “Change Detection Techniques”, International Journal of Remote
Sensing, 25, 12, pp. 2365-2407.
Lunetta, R. S. and Elvidge, C. D. (1999),”Remote Sensing Change Detection”, Environmental monitoring methods and
applications, Taylor and Francis, London.
Manonmani, R. and Sunganya, D. M. G. (2010), “Remote Sensing and Application in Change Detection Study in Urban Zone
Using Multi Temporal Satellite”, Vol. 1, No. 6, 6pp.
Parabaharan, S., Raju, K. S., Ramalingam, M. and Lakshumanan, C. (2010), “Remote Sensing and GIS Applications on Change
Detection Study in Coastal Zone Using Multi Temporal Satellite data”, International Journal of Geomatics and Geosciences,
Vol. 1, No. 2, pp.161-164.
Quezada, C. R., Olivera, I. M. and Vilalta, J. P. (2009), “Cartography of Spatial Analysis of Urban Sprawl”,
http://icaci.org/files/documents/ICC_proceedings/ICC2009/html/refer/5_2.pdf.
Accessed: 6th August, 2012.
Tewolde, M. G. and Cabral, P. (2011),” Urban Sprawl Analysis and Modeling in Asmara, Eritrea”, Remote Sensing, 3, pp. 21482165.
Zubair, A. O. (2006), “Change Detection in Land Use and Land Cover Using Remote Sensing Data and GIS: A case study of
Ilorin and its environs in Kwara”, Msc. Thesis, University of Ibadan, Nigeria, 54pp.

www.theijes.com

The IJES

Page 73

Mais conteúdo relacionado

Mais procurados

IMPACT OF COAL MINING ON LAND USE/LAND COVER USING REMOTE SENSING AND GIS TEC...
IMPACT OF COAL MINING ON LAND USE/LAND COVER USING REMOTE SENSING AND GIS TEC...IMPACT OF COAL MINING ON LAND USE/LAND COVER USING REMOTE SENSING AND GIS TEC...
IMPACT OF COAL MINING ON LAND USE/LAND COVER USING REMOTE SENSING AND GIS TEC...Abhiram Kanigolla
 
Role of geo-informatics in land use/land cover
Role of geo-informatics in land use/land coverRole of geo-informatics in land use/land cover
Role of geo-informatics in land use/land coverRohit Kumar
 
Land Use and Land Cover change monitoring of Surajpur Wetland, Uttar Pradesh:...
Land Use and Land Cover change monitoring of Surajpur Wetland, Uttar Pradesh:...Land Use and Land Cover change monitoring of Surajpur Wetland, Uttar Pradesh:...
Land Use and Land Cover change monitoring of Surajpur Wetland, Uttar Pradesh:...Arnab Saha
 
Landuse landcover mapping
Landuse landcover mappingLanduse landcover mapping
Landuse landcover mappingAditya Kushwaha
 
Change detection using remote sensing and GIS
Change detection using remote sensing and GISChange detection using remote sensing and GIS
Change detection using remote sensing and GISTilok Chetri
 
Land Use Land Cover Change Detection of Gulbarga City Using Remote Sensing an...
Land Use Land Cover Change Detection of Gulbarga City Using Remote Sensing an...Land Use Land Cover Change Detection of Gulbarga City Using Remote Sensing an...
Land Use Land Cover Change Detection of Gulbarga City Using Remote Sensing an...ijsrd.com
 
Application of remote sensing
Application of remote sensingApplication of remote sensing
Application of remote sensingAnurag Kumar
 
Application of GIS in Mine Contamination and Associated Environmental Impacts
Application of GIS in Mine Contamination and Associated Environmental ImpactsApplication of GIS in Mine Contamination and Associated Environmental Impacts
Application of GIS in Mine Contamination and Associated Environmental ImpactsArsalan Syed, PMP
 
Remote sensing and it's applications
Remote sensing and it's applicationsRemote sensing and it's applications
Remote sensing and it's applicationsWaleed Liaqat
 
Role of remote sensing and gis in infrastructural plan and identifying ecolog...
Role of remote sensing and gis in infrastructural plan and identifying ecolog...Role of remote sensing and gis in infrastructural plan and identifying ecolog...
Role of remote sensing and gis in infrastructural plan and identifying ecolog...PRADEEP M.S
 
IRJET- Land Use & Land Cover Change Detection using G.I.S. & Remote Sensing
IRJET-  	  Land Use & Land Cover Change Detection using G.I.S. & Remote SensingIRJET-  	  Land Use & Land Cover Change Detection using G.I.S. & Remote Sensing
IRJET- Land Use & Land Cover Change Detection using G.I.S. & Remote SensingIRJET Journal
 
Soil Liquefaction Potential Maps for Earthquake Events in Yangon, Myanmar
Soil Liquefaction Potential Maps for Earthquake Events in Yangon, MyanmarSoil Liquefaction Potential Maps for Earthquake Events in Yangon, Myanmar
Soil Liquefaction Potential Maps for Earthquake Events in Yangon, Myanmarijtsrd
 
Use of remote sensing for land cover monitoring servir science applications
Use of remote sensing for land cover monitoring servir science applicationsUse of remote sensing for land cover monitoring servir science applications
Use of remote sensing for land cover monitoring servir science applicationsKabir Uddin
 
Application of GIS in Modelling Landuse Changes Of Gurupavanapuri, Kerala, India
Application of GIS in Modelling Landuse Changes Of Gurupavanapuri, Kerala, IndiaApplication of GIS in Modelling Landuse Changes Of Gurupavanapuri, Kerala, India
Application of GIS in Modelling Landuse Changes Of Gurupavanapuri, Kerala, IndiaSharik Shamsudhien
 
Remote Sensing and GIS in Land Use / Land Cover Mapping
Remote Sensing and GIS in Land Use / Land Cover MappingRemote Sensing and GIS in Land Use / Land Cover Mapping
Remote Sensing and GIS in Land Use / Land Cover MappingVenkatKamal1
 
Land use land cover mapping for smart village using gis
Land use land cover mapping for smart village using gisLand use land cover mapping for smart village using gis
Land use land cover mapping for smart village using gisSumit Yeole
 
Ecological indicators
Ecological indicatorsEcological indicators
Ecological indicatorsTaha Gorji
 

Mais procurados (20)

IMPACT OF COAL MINING ON LAND USE/LAND COVER USING REMOTE SENSING AND GIS TEC...
IMPACT OF COAL MINING ON LAND USE/LAND COVER USING REMOTE SENSING AND GIS TEC...IMPACT OF COAL MINING ON LAND USE/LAND COVER USING REMOTE SENSING AND GIS TEC...
IMPACT OF COAL MINING ON LAND USE/LAND COVER USING REMOTE SENSING AND GIS TEC...
 
Role of geo-informatics in land use/land cover
Role of geo-informatics in land use/land coverRole of geo-informatics in land use/land cover
Role of geo-informatics in land use/land cover
 
Land Use and Land Cover change monitoring of Surajpur Wetland, Uttar Pradesh:...
Land Use and Land Cover change monitoring of Surajpur Wetland, Uttar Pradesh:...Land Use and Land Cover change monitoring of Surajpur Wetland, Uttar Pradesh:...
Land Use and Land Cover change monitoring of Surajpur Wetland, Uttar Pradesh:...
 
Landuse landcover mapping
Landuse landcover mappingLanduse landcover mapping
Landuse landcover mapping
 
Change detection using remote sensing and GIS
Change detection using remote sensing and GISChange detection using remote sensing and GIS
Change detection using remote sensing and GIS
 
Land Use Land Cover Change Detection of Gulbarga City Using Remote Sensing an...
Land Use Land Cover Change Detection of Gulbarga City Using Remote Sensing an...Land Use Land Cover Change Detection of Gulbarga City Using Remote Sensing an...
Land Use Land Cover Change Detection of Gulbarga City Using Remote Sensing an...
 
FINAL REPORT
FINAL REPORTFINAL REPORT
FINAL REPORT
 
Application of remote sensing
Application of remote sensingApplication of remote sensing
Application of remote sensing
 
Application of GIS in Mine Contamination and Associated Environmental Impacts
Application of GIS in Mine Contamination and Associated Environmental ImpactsApplication of GIS in Mine Contamination and Associated Environmental Impacts
Application of GIS in Mine Contamination and Associated Environmental Impacts
 
Remote sensing and it's applications
Remote sensing and it's applicationsRemote sensing and it's applications
Remote sensing and it's applications
 
Role of remote sensing and gis in infrastructural plan and identifying ecolog...
Role of remote sensing and gis in infrastructural plan and identifying ecolog...Role of remote sensing and gis in infrastructural plan and identifying ecolog...
Role of remote sensing and gis in infrastructural plan and identifying ecolog...
 
IRJET- Land Use & Land Cover Change Detection using G.I.S. & Remote Sensing
IRJET-  	  Land Use & Land Cover Change Detection using G.I.S. & Remote SensingIRJET-  	  Land Use & Land Cover Change Detection using G.I.S. & Remote Sensing
IRJET- Land Use & Land Cover Change Detection using G.I.S. & Remote Sensing
 
Soil Liquefaction Potential Maps for Earthquake Events in Yangon, Myanmar
Soil Liquefaction Potential Maps for Earthquake Events in Yangon, MyanmarSoil Liquefaction Potential Maps for Earthquake Events in Yangon, Myanmar
Soil Liquefaction Potential Maps for Earthquake Events in Yangon, Myanmar
 
Use of remote sensing for land cover monitoring servir science applications
Use of remote sensing for land cover monitoring servir science applicationsUse of remote sensing for land cover monitoring servir science applications
Use of remote sensing for land cover monitoring servir science applications
 
Ijsrp p8127
Ijsrp p8127Ijsrp p8127
Ijsrp p8127
 
Application of GIS in Modelling Landuse Changes Of Gurupavanapuri, Kerala, India
Application of GIS in Modelling Landuse Changes Of Gurupavanapuri, Kerala, IndiaApplication of GIS in Modelling Landuse Changes Of Gurupavanapuri, Kerala, India
Application of GIS in Modelling Landuse Changes Of Gurupavanapuri, Kerala, India
 
Viewpaper
ViewpaperViewpaper
Viewpaper
 
Remote Sensing and GIS in Land Use / Land Cover Mapping
Remote Sensing and GIS in Land Use / Land Cover MappingRemote Sensing and GIS in Land Use / Land Cover Mapping
Remote Sensing and GIS in Land Use / Land Cover Mapping
 
Land use land cover mapping for smart village using gis
Land use land cover mapping for smart village using gisLand use land cover mapping for smart village using gis
Land use land cover mapping for smart village using gis
 
Ecological indicators
Ecological indicatorsEcological indicators
Ecological indicators
 

Destaque

The International Journal of Engineering and Science (The IJES)
The International Journal of Engineering and Science (The IJES)The International Journal of Engineering and Science (The IJES)
The International Journal of Engineering and Science (The IJES)theijes
 
H03310038042
H03310038042H03310038042
H03310038042theijes
 
E0313023027
E0313023027E0313023027
E0313023027theijes
 
K030102074084
K030102074084K030102074084
K030102074084theijes
 
B030102008010
B030102008010B030102008010
B030102008010theijes
 
I030101048052
I030101048052I030101048052
I030101048052theijes
 
H030102052055
H030102052055H030102052055
H030102052055theijes
 
B0315011015
B0315011015B0315011015
B0315011015theijes
 
The International Journal of Engineering and Science (The IJES)
The International Journal of Engineering and Science (The IJES)The International Journal of Engineering and Science (The IJES)
The International Journal of Engineering and Science (The IJES)theijes
 
D0315025029
D0315025029D0315025029
D0315025029theijes
 
The International Journal of Engineering and Science (The IJES)
The International Journal of Engineering and Science (The IJES)The International Journal of Engineering and Science (The IJES)
The International Journal of Engineering and Science (The IJES)theijes
 
K030101060065
K030101060065K030101060065
K030101060065theijes
 
C0314018022
C0314018022C0314018022
C0314018022theijes
 
E03310026031
E03310026031E03310026031
E03310026031theijes
 
E030102031037
E030102031037E030102031037
E030102031037theijes
 
G0314046051
G0314046051G0314046051
G0314046051theijes
 
M030101073078
M030101073078M030101073078
M030101073078theijes
 
A03130109
A03130109A03130109
A03130109theijes
 
The International Journal of Engineering and Science (The IJES)
The International Journal of Engineering and Science (The IJES)The International Journal of Engineering and Science (The IJES)
The International Journal of Engineering and Science (The IJES)theijes
 

Destaque (19)

The International Journal of Engineering and Science (The IJES)
The International Journal of Engineering and Science (The IJES)The International Journal of Engineering and Science (The IJES)
The International Journal of Engineering and Science (The IJES)
 
H03310038042
H03310038042H03310038042
H03310038042
 
E0313023027
E0313023027E0313023027
E0313023027
 
K030102074084
K030102074084K030102074084
K030102074084
 
B030102008010
B030102008010B030102008010
B030102008010
 
I030101048052
I030101048052I030101048052
I030101048052
 
H030102052055
H030102052055H030102052055
H030102052055
 
B0315011015
B0315011015B0315011015
B0315011015
 
The International Journal of Engineering and Science (The IJES)
The International Journal of Engineering and Science (The IJES)The International Journal of Engineering and Science (The IJES)
The International Journal of Engineering and Science (The IJES)
 
D0315025029
D0315025029D0315025029
D0315025029
 
The International Journal of Engineering and Science (The IJES)
The International Journal of Engineering and Science (The IJES)The International Journal of Engineering and Science (The IJES)
The International Journal of Engineering and Science (The IJES)
 
K030101060065
K030101060065K030101060065
K030101060065
 
C0314018022
C0314018022C0314018022
C0314018022
 
E03310026031
E03310026031E03310026031
E03310026031
 
E030102031037
E030102031037E030102031037
E030102031037
 
G0314046051
G0314046051G0314046051
G0314046051
 
M030101073078
M030101073078M030101073078
M030101073078
 
A03130109
A03130109A03130109
A03130109
 
The International Journal of Engineering and Science (The IJES)
The International Journal of Engineering and Science (The IJES)The International Journal of Engineering and Science (The IJES)
The International Journal of Engineering and Science (The IJES)
 

Semelhante a The International Journal of Engineering and Science (The IJES)

IRJET- Landuse, Landcover and Urban Development of Coimbatore North Zone for ...
IRJET- Landuse, Landcover and Urban Development of Coimbatore North Zone for ...IRJET- Landuse, Landcover and Urban Development of Coimbatore North Zone for ...
IRJET- Landuse, Landcover and Urban Development of Coimbatore North Zone for ...IRJET Journal
 
Land use Land Cover change mapping using Remote Sensing and GIS: A case study...
Land use Land Cover change mapping using Remote Sensing and GIS: A case study...Land use Land Cover change mapping using Remote Sensing and GIS: A case study...
Land use Land Cover change mapping using Remote Sensing and GIS: A case study...IRJET Journal
 
Remote Sensing and GIS-Based Monitoring of Land Use Change in Nagpur District...
Remote Sensing and GIS-Based Monitoring of Land Use Change in Nagpur District...Remote Sensing and GIS-Based Monitoring of Land Use Change in Nagpur District...
Remote Sensing and GIS-Based Monitoring of Land Use Change in Nagpur District...IRJET Journal
 
7 Journal of Life Sciences and Biomedicine (2710-4915 2710-3447).pdf
7 Journal of Life Sciences and Biomedicine (2710-4915  2710-3447).pdf7 Journal of Life Sciences and Biomedicine (2710-4915  2710-3447).pdf
7 Journal of Life Sciences and Biomedicine (2710-4915 2710-3447).pdfPublisherNasir
 
Effectiveness and Capability of Remote Sensing (RS) and Geographic Informatio...
Effectiveness and Capability of Remote Sensing (RS) and Geographic Informatio...Effectiveness and Capability of Remote Sensing (RS) and Geographic Informatio...
Effectiveness and Capability of Remote Sensing (RS) and Geographic Informatio...nitinrane33
 
Monitoring_and_Prediction_of_Land_Use_La
Monitoring_and_Prediction_of_Land_Use_LaMonitoring_and_Prediction_of_Land_Use_La
Monitoring_and_Prediction_of_Land_Use_Lasanjoy roy
 
geo-informatics in land use/land cover study
geo-informatics in land use/land cover studygeo-informatics in land use/land cover study
geo-informatics in land use/land cover studyRohit Kumar
 
Land Use/Land Cover Mapping Of Allahabad City by Using Remote Sensing & GIS
Land Use/Land Cover Mapping Of Allahabad City by Using  Remote Sensing & GIS Land Use/Land Cover Mapping Of Allahabad City by Using  Remote Sensing & GIS
Land Use/Land Cover Mapping Of Allahabad City by Using Remote Sensing & GIS IJMER
 
Impact of Land-use and Land-cover Change Dynamics on Flooding: A Case Study o...
Impact of Land-use and Land-cover Change Dynamics on Flooding: A Case Study o...Impact of Land-use and Land-cover Change Dynamics on Flooding: A Case Study o...
Impact of Land-use and Land-cover Change Dynamics on Flooding: A Case Study o...IRJET Journal
 
Accuracy Assessment of Land Use/Land Cover Classification using multi tempora...
Accuracy Assessment of Land Use/Land Cover Classification using multi tempora...Accuracy Assessment of Land Use/Land Cover Classification using multi tempora...
Accuracy Assessment of Land Use/Land Cover Classification using multi tempora...IRJET Journal
 
Land use and Land cover Change detection and Its Environmental Impact on Sout...
Land use and Land cover Change detection and Its Environmental Impact on Sout...Land use and Land cover Change detection and Its Environmental Impact on Sout...
Land use and Land cover Change detection and Its Environmental Impact on Sout...IRJET Journal
 
2. VULNERABILITY ASSESSMENT OF SOIL EROSION USING GEOSPATIAL TECHNIQUES
2. VULNERABILITY ASSESSMENT OF SOIL EROSION USING GEOSPATIAL TECHNIQUES2. VULNERABILITY ASSESSMENT OF SOIL EROSION USING GEOSPATIAL TECHNIQUES
2. VULNERABILITY ASSESSMENT OF SOIL EROSION USING GEOSPATIAL TECHNIQUESDr. Ravinder Jangra
 
“Cadastral Maps for Socio-Economic Data Visualization and Integration for Lan...
“Cadastral Maps for Socio-Economic Data Visualization and Integration for Lan...“Cadastral Maps for Socio-Economic Data Visualization and Integration for Lan...
“Cadastral Maps for Socio-Economic Data Visualization and Integration for Lan...irjes
 
GEOMATICS ANALYSIS ON LAND USE LAND COVER CLASSIFICATION SYSTEM IN PRECAMBRIA...
GEOMATICS ANALYSIS ON LAND USE LAND COVER CLASSIFICATION SYSTEM IN PRECAMBRIA...GEOMATICS ANALYSIS ON LAND USE LAND COVER CLASSIFICATION SYSTEM IN PRECAMBRIA...
GEOMATICS ANALYSIS ON LAND USE LAND COVER CLASSIFICATION SYSTEM IN PRECAMBRIA...IAEME Publication
 
Land Use/Cover change Evaluation of Gibe III Dam in Southern Ethiopia by ayel...
Land Use/Cover change Evaluation of Gibe III Dam in Southern Ethiopia by ayel...Land Use/Cover change Evaluation of Gibe III Dam in Southern Ethiopia by ayel...
Land Use/Cover change Evaluation of Gibe III Dam in Southern Ethiopia by ayel...Space science
 
Identification of Groundwater Potential Survey Using QGIS of DBATU campus, Ma...
Identification of Groundwater Potential Survey Using QGIS of DBATU campus, Ma...Identification of Groundwater Potential Survey Using QGIS of DBATU campus, Ma...
Identification of Groundwater Potential Survey Using QGIS of DBATU campus, Ma...IRJET Journal
 
Remote Sensing and GIS Techniques
Remote Sensing and GIS TechniquesRemote Sensing and GIS Techniques
Remote Sensing and GIS TechniquesRisikesh Thakur
 

Semelhante a The International Journal of Engineering and Science (The IJES) (20)

IRJET- Landuse, Landcover and Urban Development of Coimbatore North Zone for ...
IRJET- Landuse, Landcover and Urban Development of Coimbatore North Zone for ...IRJET- Landuse, Landcover and Urban Development of Coimbatore North Zone for ...
IRJET- Landuse, Landcover and Urban Development of Coimbatore North Zone for ...
 
Land use Land Cover change mapping using Remote Sensing and GIS: A case study...
Land use Land Cover change mapping using Remote Sensing and GIS: A case study...Land use Land Cover change mapping using Remote Sensing and GIS: A case study...
Land use Land Cover change mapping using Remote Sensing and GIS: A case study...
 
Remote Sensing and GIS-Based Monitoring of Land Use Change in Nagpur District...
Remote Sensing and GIS-Based Monitoring of Land Use Change in Nagpur District...Remote Sensing and GIS-Based Monitoring of Land Use Change in Nagpur District...
Remote Sensing and GIS-Based Monitoring of Land Use Change in Nagpur District...
 
7 Journal of Life Sciences and Biomedicine (2710-4915 2710-3447).pdf
7 Journal of Life Sciences and Biomedicine (2710-4915  2710-3447).pdf7 Journal of Life Sciences and Biomedicine (2710-4915  2710-3447).pdf
7 Journal of Life Sciences and Biomedicine (2710-4915 2710-3447).pdf
 
Effectiveness and Capability of Remote Sensing (RS) and Geographic Informatio...
Effectiveness and Capability of Remote Sensing (RS) and Geographic Informatio...Effectiveness and Capability of Remote Sensing (RS) and Geographic Informatio...
Effectiveness and Capability of Remote Sensing (RS) and Geographic Informatio...
 
Monitoring_and_Prediction_of_Land_Use_La
Monitoring_and_Prediction_of_Land_Use_LaMonitoring_and_Prediction_of_Land_Use_La
Monitoring_and_Prediction_of_Land_Use_La
 
geo-informatics in land use/land cover study
geo-informatics in land use/land cover studygeo-informatics in land use/land cover study
geo-informatics in land use/land cover study
 
Ijciet 06 10_004
Ijciet 06 10_004Ijciet 06 10_004
Ijciet 06 10_004
 
Land Use/Land Cover Mapping Of Allahabad City by Using Remote Sensing & GIS
Land Use/Land Cover Mapping Of Allahabad City by Using  Remote Sensing & GIS Land Use/Land Cover Mapping Of Allahabad City by Using  Remote Sensing & GIS
Land Use/Land Cover Mapping Of Allahabad City by Using Remote Sensing & GIS
 
Impact of Land-use and Land-cover Change Dynamics on Flooding: A Case Study o...
Impact of Land-use and Land-cover Change Dynamics on Flooding: A Case Study o...Impact of Land-use and Land-cover Change Dynamics on Flooding: A Case Study o...
Impact of Land-use and Land-cover Change Dynamics on Flooding: A Case Study o...
 
Accuracy Assessment of Land Use/Land Cover Classification using multi tempora...
Accuracy Assessment of Land Use/Land Cover Classification using multi tempora...Accuracy Assessment of Land Use/Land Cover Classification using multi tempora...
Accuracy Assessment of Land Use/Land Cover Classification using multi tempora...
 
Ijciet 10 02_036
Ijciet 10 02_036Ijciet 10 02_036
Ijciet 10 02_036
 
a3-4.park.pdf
a3-4.park.pdfa3-4.park.pdf
a3-4.park.pdf
 
Land use and Land cover Change detection and Its Environmental Impact on Sout...
Land use and Land cover Change detection and Its Environmental Impact on Sout...Land use and Land cover Change detection and Its Environmental Impact on Sout...
Land use and Land cover Change detection and Its Environmental Impact on Sout...
 
2. VULNERABILITY ASSESSMENT OF SOIL EROSION USING GEOSPATIAL TECHNIQUES
2. VULNERABILITY ASSESSMENT OF SOIL EROSION USING GEOSPATIAL TECHNIQUES2. VULNERABILITY ASSESSMENT OF SOIL EROSION USING GEOSPATIAL TECHNIQUES
2. VULNERABILITY ASSESSMENT OF SOIL EROSION USING GEOSPATIAL TECHNIQUES
 
“Cadastral Maps for Socio-Economic Data Visualization and Integration for Lan...
“Cadastral Maps for Socio-Economic Data Visualization and Integration for Lan...“Cadastral Maps for Socio-Economic Data Visualization and Integration for Lan...
“Cadastral Maps for Socio-Economic Data Visualization and Integration for Lan...
 
GEOMATICS ANALYSIS ON LAND USE LAND COVER CLASSIFICATION SYSTEM IN PRECAMBRIA...
GEOMATICS ANALYSIS ON LAND USE LAND COVER CLASSIFICATION SYSTEM IN PRECAMBRIA...GEOMATICS ANALYSIS ON LAND USE LAND COVER CLASSIFICATION SYSTEM IN PRECAMBRIA...
GEOMATICS ANALYSIS ON LAND USE LAND COVER CLASSIFICATION SYSTEM IN PRECAMBRIA...
 
Land Use/Cover change Evaluation of Gibe III Dam in Southern Ethiopia by ayel...
Land Use/Cover change Evaluation of Gibe III Dam in Southern Ethiopia by ayel...Land Use/Cover change Evaluation of Gibe III Dam in Southern Ethiopia by ayel...
Land Use/Cover change Evaluation of Gibe III Dam in Southern Ethiopia by ayel...
 
Identification of Groundwater Potential Survey Using QGIS of DBATU campus, Ma...
Identification of Groundwater Potential Survey Using QGIS of DBATU campus, Ma...Identification of Groundwater Potential Survey Using QGIS of DBATU campus, Ma...
Identification of Groundwater Potential Survey Using QGIS of DBATU campus, Ma...
 
Remote Sensing and GIS Techniques
Remote Sensing and GIS TechniquesRemote Sensing and GIS Techniques
Remote Sensing and GIS Techniques
 

Último

TeamStation AI System Report LATAM IT Salaries 2024
TeamStation AI System Report LATAM IT Salaries 2024TeamStation AI System Report LATAM IT Salaries 2024
TeamStation AI System Report LATAM IT Salaries 2024Lonnie McRorey
 
Anypoint Exchange: It’s Not Just a Repo!
Anypoint Exchange: It’s Not Just a Repo!Anypoint Exchange: It’s Not Just a Repo!
Anypoint Exchange: It’s Not Just a Repo!Manik S Magar
 
Unraveling Multimodality with Large Language Models.pdf
Unraveling Multimodality with Large Language Models.pdfUnraveling Multimodality with Large Language Models.pdf
Unraveling Multimodality with Large Language Models.pdfAlex Barbosa Coqueiro
 
WordPress Websites for Engineers: Elevate Your Brand
WordPress Websites for Engineers: Elevate Your BrandWordPress Websites for Engineers: Elevate Your Brand
WordPress Websites for Engineers: Elevate Your Brandgvaughan
 
Use of FIDO in the Payments and Identity Landscape: FIDO Paris Seminar.pptx
Use of FIDO in the Payments and Identity Landscape: FIDO Paris Seminar.pptxUse of FIDO in the Payments and Identity Landscape: FIDO Paris Seminar.pptx
Use of FIDO in the Payments and Identity Landscape: FIDO Paris Seminar.pptxLoriGlavin3
 
(How to Program) Paul Deitel, Harvey Deitel-Java How to Program, Early Object...
(How to Program) Paul Deitel, Harvey Deitel-Java How to Program, Early Object...(How to Program) Paul Deitel, Harvey Deitel-Java How to Program, Early Object...
(How to Program) Paul Deitel, Harvey Deitel-Java How to Program, Early Object...AliaaTarek5
 
Gen AI in Business - Global Trends Report 2024.pdf
Gen AI in Business - Global Trends Report 2024.pdfGen AI in Business - Global Trends Report 2024.pdf
Gen AI in Business - Global Trends Report 2024.pdfAddepto
 
Transcript: New from BookNet Canada for 2024: BNC CataList - Tech Forum 2024
Transcript: New from BookNet Canada for 2024: BNC CataList - Tech Forum 2024Transcript: New from BookNet Canada for 2024: BNC CataList - Tech Forum 2024
Transcript: New from BookNet Canada for 2024: BNC CataList - Tech Forum 2024BookNet Canada
 
Scale your database traffic with Read & Write split using MySQL Router
Scale your database traffic with Read & Write split using MySQL RouterScale your database traffic with Read & Write split using MySQL Router
Scale your database traffic with Read & Write split using MySQL RouterMydbops
 
What is DBT - The Ultimate Data Build Tool.pdf
What is DBT - The Ultimate Data Build Tool.pdfWhat is DBT - The Ultimate Data Build Tool.pdf
What is DBT - The Ultimate Data Build Tool.pdfMounikaPolabathina
 
What's New in Teams Calling, Meetings and Devices March 2024
What's New in Teams Calling, Meetings and Devices March 2024What's New in Teams Calling, Meetings and Devices March 2024
What's New in Teams Calling, Meetings and Devices March 2024Stephanie Beckett
 
Rise of the Machines: Known As Drones...
Rise of the Machines: Known As Drones...Rise of the Machines: Known As Drones...
Rise of the Machines: Known As Drones...Rick Flair
 
SIP trunking in Janus @ Kamailio World 2024
SIP trunking in Janus @ Kamailio World 2024SIP trunking in Janus @ Kamailio World 2024
SIP trunking in Janus @ Kamailio World 2024Lorenzo Miniero
 
Visualising and forecasting stocks using Dash
Visualising and forecasting stocks using DashVisualising and forecasting stocks using Dash
Visualising and forecasting stocks using Dashnarutouzumaki53779
 
DevoxxFR 2024 Reproducible Builds with Apache Maven
DevoxxFR 2024 Reproducible Builds with Apache MavenDevoxxFR 2024 Reproducible Builds with Apache Maven
DevoxxFR 2024 Reproducible Builds with Apache MavenHervé Boutemy
 
TrustArc Webinar - How to Build Consumer Trust Through Data Privacy
TrustArc Webinar - How to Build Consumer Trust Through Data PrivacyTrustArc Webinar - How to Build Consumer Trust Through Data Privacy
TrustArc Webinar - How to Build Consumer Trust Through Data PrivacyTrustArc
 
Digital Identity is Under Attack: FIDO Paris Seminar.pptx
Digital Identity is Under Attack: FIDO Paris Seminar.pptxDigital Identity is Under Attack: FIDO Paris Seminar.pptx
Digital Identity is Under Attack: FIDO Paris Seminar.pptxLoriGlavin3
 
New from BookNet Canada for 2024: BNC CataList - Tech Forum 2024
New from BookNet Canada for 2024: BNC CataList - Tech Forum 2024New from BookNet Canada for 2024: BNC CataList - Tech Forum 2024
New from BookNet Canada for 2024: BNC CataList - Tech Forum 2024BookNet Canada
 
New from BookNet Canada for 2024: Loan Stars - Tech Forum 2024
New from BookNet Canada for 2024: Loan Stars - Tech Forum 2024New from BookNet Canada for 2024: Loan Stars - Tech Forum 2024
New from BookNet Canada for 2024: Loan Stars - Tech Forum 2024BookNet Canada
 
Tampa BSides - Chef's Tour of Microsoft Security Adoption Framework (SAF)
Tampa BSides - Chef's Tour of Microsoft Security Adoption Framework (SAF)Tampa BSides - Chef's Tour of Microsoft Security Adoption Framework (SAF)
Tampa BSides - Chef's Tour of Microsoft Security Adoption Framework (SAF)Mark Simos
 

Último (20)

TeamStation AI System Report LATAM IT Salaries 2024
TeamStation AI System Report LATAM IT Salaries 2024TeamStation AI System Report LATAM IT Salaries 2024
TeamStation AI System Report LATAM IT Salaries 2024
 
Anypoint Exchange: It’s Not Just a Repo!
Anypoint Exchange: It’s Not Just a Repo!Anypoint Exchange: It’s Not Just a Repo!
Anypoint Exchange: It’s Not Just a Repo!
 
Unraveling Multimodality with Large Language Models.pdf
Unraveling Multimodality with Large Language Models.pdfUnraveling Multimodality with Large Language Models.pdf
Unraveling Multimodality with Large Language Models.pdf
 
WordPress Websites for Engineers: Elevate Your Brand
WordPress Websites for Engineers: Elevate Your BrandWordPress Websites for Engineers: Elevate Your Brand
WordPress Websites for Engineers: Elevate Your Brand
 
Use of FIDO in the Payments and Identity Landscape: FIDO Paris Seminar.pptx
Use of FIDO in the Payments and Identity Landscape: FIDO Paris Seminar.pptxUse of FIDO in the Payments and Identity Landscape: FIDO Paris Seminar.pptx
Use of FIDO in the Payments and Identity Landscape: FIDO Paris Seminar.pptx
 
(How to Program) Paul Deitel, Harvey Deitel-Java How to Program, Early Object...
(How to Program) Paul Deitel, Harvey Deitel-Java How to Program, Early Object...(How to Program) Paul Deitel, Harvey Deitel-Java How to Program, Early Object...
(How to Program) Paul Deitel, Harvey Deitel-Java How to Program, Early Object...
 
Gen AI in Business - Global Trends Report 2024.pdf
Gen AI in Business - Global Trends Report 2024.pdfGen AI in Business - Global Trends Report 2024.pdf
Gen AI in Business - Global Trends Report 2024.pdf
 
Transcript: New from BookNet Canada for 2024: BNC CataList - Tech Forum 2024
Transcript: New from BookNet Canada for 2024: BNC CataList - Tech Forum 2024Transcript: New from BookNet Canada for 2024: BNC CataList - Tech Forum 2024
Transcript: New from BookNet Canada for 2024: BNC CataList - Tech Forum 2024
 
Scale your database traffic with Read & Write split using MySQL Router
Scale your database traffic with Read & Write split using MySQL RouterScale your database traffic with Read & Write split using MySQL Router
Scale your database traffic with Read & Write split using MySQL Router
 
What is DBT - The Ultimate Data Build Tool.pdf
What is DBT - The Ultimate Data Build Tool.pdfWhat is DBT - The Ultimate Data Build Tool.pdf
What is DBT - The Ultimate Data Build Tool.pdf
 
What's New in Teams Calling, Meetings and Devices March 2024
What's New in Teams Calling, Meetings and Devices March 2024What's New in Teams Calling, Meetings and Devices March 2024
What's New in Teams Calling, Meetings and Devices March 2024
 
Rise of the Machines: Known As Drones...
Rise of the Machines: Known As Drones...Rise of the Machines: Known As Drones...
Rise of the Machines: Known As Drones...
 
SIP trunking in Janus @ Kamailio World 2024
SIP trunking in Janus @ Kamailio World 2024SIP trunking in Janus @ Kamailio World 2024
SIP trunking in Janus @ Kamailio World 2024
 
Visualising and forecasting stocks using Dash
Visualising and forecasting stocks using DashVisualising and forecasting stocks using Dash
Visualising and forecasting stocks using Dash
 
DevoxxFR 2024 Reproducible Builds with Apache Maven
DevoxxFR 2024 Reproducible Builds with Apache MavenDevoxxFR 2024 Reproducible Builds with Apache Maven
DevoxxFR 2024 Reproducible Builds with Apache Maven
 
TrustArc Webinar - How to Build Consumer Trust Through Data Privacy
TrustArc Webinar - How to Build Consumer Trust Through Data PrivacyTrustArc Webinar - How to Build Consumer Trust Through Data Privacy
TrustArc Webinar - How to Build Consumer Trust Through Data Privacy
 
Digital Identity is Under Attack: FIDO Paris Seminar.pptx
Digital Identity is Under Attack: FIDO Paris Seminar.pptxDigital Identity is Under Attack: FIDO Paris Seminar.pptx
Digital Identity is Under Attack: FIDO Paris Seminar.pptx
 
New from BookNet Canada for 2024: BNC CataList - Tech Forum 2024
New from BookNet Canada for 2024: BNC CataList - Tech Forum 2024New from BookNet Canada for 2024: BNC CataList - Tech Forum 2024
New from BookNet Canada for 2024: BNC CataList - Tech Forum 2024
 
New from BookNet Canada for 2024: Loan Stars - Tech Forum 2024
New from BookNet Canada for 2024: Loan Stars - Tech Forum 2024New from BookNet Canada for 2024: Loan Stars - Tech Forum 2024
New from BookNet Canada for 2024: Loan Stars - Tech Forum 2024
 
Tampa BSides - Chef's Tour of Microsoft Security Adoption Framework (SAF)
Tampa BSides - Chef's Tour of Microsoft Security Adoption Framework (SAF)Tampa BSides - Chef's Tour of Microsoft Security Adoption Framework (SAF)
Tampa BSides - Chef's Tour of Microsoft Security Adoption Framework (SAF)
 

The International Journal of Engineering and Science (The IJES)

  • 1. The International Journal Of Engineering And Science (IJES) ||Volume|| 2 ||Issue|| 10 ||Pages|| 66-73 ||2013|| ISSN (e): 2319 – 1813 ISSN (p): 2319 – 1805 Remote Sensing for Mapping Land-Use/Cover Changes and Urban Sprawl in Sekondi-Takoradi, Western Region of Ghana M. S. Aduah, P. E. Baffoe Department of Geomatics Engineering, University of Mines and Technology, P. O. Box 237, Tarkwa, Ghana ------------------------------------------------------ABSTRACT---------------------------------------------------Land use/land cover influences a variety of processes on the Earth surface which also generate feedback effects on the natural environment, economic and social systems. Poorly managed changes in urban areas have resulted in many catastrophic consequences such as floods, landslides, droughts etc. The Landsat satellite system has long term data archives and can be used to assess the land cover changes in the landscape to provide information to support future urban planning. In this paper Landsat images were used to map the land use/land cover changes in the city of Sekondi-Takoradi in the Western region of Ghana from 1988 to 2011 through a change detection process. The post-classification method of change detection was used and the accuracies achieved were high. The analysis showed that a large portion of the city and its surrounding areas has been converted from natural surfaces to impervious surfaces. Also it was observed that precipitation has reduced considerably during the period and high temperatures have been observed. A model developed between land use change and time have showed that in the next 50 years if the trend of land use change continues, there will be complete removal of natural surfaces. These could lead to increased incidence and severity of flash floods and droughts. Therefore the data produced in this study can be used to guide effective urban planning to mitigate the combined effects of land use changes due to urbanisation and climate change. This study demonstrates the critical role remote sensing can play in the developing world in terms of providing data for planning since many countries do not have the resources to map their territories regularly through conventional means. Key words: change detection, land use/land cover, Landsat, remote sensing, Sekondi-Takoradi ----------------------------------------------------------------------------------------------------------------------------- ---------Date of Submission: 01st, October, 2013 Date of Acceptance: 30th, October, 2013 -------------------------------------------------------------------------------------------------------------------------------- ------- I. INTRODUCTION Land use/land cover (LULC) influences a variety of processes on the Earth surface. These processes also generate feedback effects on the natural environment, economic and social systems. LULC is pervasive in urbanised environments worldwide and reflects a society’s interactions with the physical environment (Campbell, 2002). Hence poorly managed changes in urban areas have the potential to result in many social, economic and environmental catastrophes such as floods, landslides, droughts, lack of safe drinking water and loss of crop productivity etc. It is imperative therefore that urban land use is planned properly to ensure that sustainable social, economic and environmental goals are achieved. To achieve these objectives it is important to map the existing LULC of the urban areas. It is only then that it will be possible to analyse which land use best suits a particular land cover considering all necessary variables. For example, it will not make economic sense to build low cost estates on rich agricultural lands and it will not make environmental sense to construct certain industries in riparian habitats. The overall objective of ensuring that the urban land use is not mixed is to ensure sustainable utilization of the natural resources. Urban LULC occurs mostly by the removal of vegetation through anthropogenic activities such as construction of housing estates, road construction, agriculture and livestock raising, forest harvesting and mining etc. These causes are influenced by population increase, government policy and economic development. In some places the occurrence of major floods can also alter the land cover though the floods are also influenced by LULC. Other causes of LULC changes include bushfires and climatic changes (Aduah et al., 2012). LULC changes in urban areas create impervious and non-evaporative surfaces. The consequences include increases in storm run-off, river discharge rates and floods in low lying areas. Others include increased soil erosion and alteration of the surface energy balance resulting in increased land surface temperatures and urban heat islands (Aduah et al., 2012). These changes also cause high evaporation rates and decreased productivity of soils and crops. Over long period of time urban land cover turning into impervious area will reduce the ground water recharge and pollution of water bodies due to non-point source pollution and sedimentation. Pollution and sedimentation of water bodies will reduce wetland habitats and affect the flora and fauna hence reducing biodiversity. Consequently water treatment for the urban areas would be expensive and supplies would be limited. www.theijes.com The IJES Page 66
  • 2. Remote Sensing for Mapping Land-Use/Cover Changes and… LULC and its changes have been mapped extensively in the past five decades through multiple techniques. These include ground surveys, aerial photogrammetry and satellite remote sensing. However, the use of ground surveys and aerial photogrammerty is expensive and time consuming and therefore normally limited to small areas and low temporal domains. Satellite remote sensing with its long term data, wide spatial and synoptic coverage and high temporal resolution has become the most important technology for mapping LULC and its changes for the past three decades after the launch of the Landsat group of satellites. Today LULC is one key area where satellite images are routinely used. This is mainly because satellite images provide synoptic and spatial coverage over large areas for a long period of time and repeated views of the same location can be obtained. The basis of remote sensing is that changes occurring in the land cover alter the reflected radiation which is recorded in the images. Also the development of high spatial and spectral resolution sensor technology (e.g. Ikonos, Orbview, GeoEye, QuickBird etc) has provided the opportunity to conduct detailed inventory of LULC. Consequently, it is now possible to generate detailed and timely LULC inventories for many Countries using a variety of optical and microwave satellite images. Until recently this was only possible with aerial photography interpretation and ground surveys. Change detection is the process of categorizing differences in the state of an object or phenomenon by observing it at different times (Abiy, 2010). Remote sensing methods of mapping LULC change include multidate composites, change vector, image algebra (image differencing, image ratio), on-screen digitization, GIS overlay and post-classification comparison (Zubair, 2006; Coppin et al., 2004; Lu et al., 2004, Lunetta and Elvidge, 1999 and Campbell, 2000). These methods have been used extensively over the past four decades. For examples of studies see Manonmani et al., 2010 for multi-date composites and Aduah and Aebayir, 2012; Prabaharan et al., 2010; Boakye et al., 2008 for post classification comparison techniques. The post classification method is the most widely used change detection algorithm. The approach classifies and labels two images from different dates. The area of change is then calculated through direct comparison of the classification results. Main advantages of post classification include: detailed “from – to” information. Also the spectral complexities associated with the analysing images acquired at different times of year or with different sensors is avoided. However, the accuracy of the analysis depends on the accuracy of the image registration and classification of the individual images. This implies that the individual classification be executed carefully so as to achieve the best accuracy as possible (Abiy, 2010). The extensive application of these methods in the remote sensing community has ensured that LULC inventories are available for many Countries. The availability of LULC inventories serves as the baseline upon which effective monitoring and management of the urban environment can be carried out. This enhances the ability to combat or adapt to the negative effects LULC change and global climate change at the local scale. To be able to ascertain how the LULC has changed and how it has affected many environmental parameters it is imperative to conduct effective LULC inventory over a period of time. Since the LULC changes are speculated to affect the magnitudes of the predicted effects of climate change, it is also relevant to predict the status of the LULC in the future. This study is therefore conducted in the Sekondi-Takoradi Metropolitan area of Ghana to map LULC and its change using the post classification comparison method. This is to provide data suitable for monitoring and managing the local environment. Materials and Methods The material and methods used in this research are elaborated in the sections below. Study Area Sekondi-Takoradi metropolis (Figure 1) comprises of the cities of Sekondi and Takoradi. The metropolis is located within latitude 050 55’ North and longitude 010 46’ West with a land area of about 49.78 km2. It is the capital of the Western Region of Ghana and it is Ghana's fourth largest city. It also serves as an industrial and commercial center. The major industries are timber, plywood, shipbuilding and railroad repair and recently, oil. The Metropolis is characterized by faulted shales and sandstone resting on a hard basement of granite, gneiss and schist (Anon., 2011b). The faulting system has influenced the land form along the coastline. It clearly follows the main fault direction of North East (Anon., 2011b). www.theijes.com The IJES Page 67
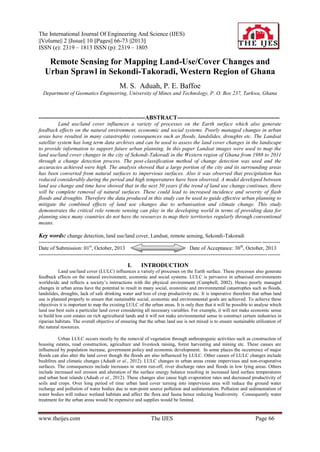
  • 3. Remote Sensing for Mapping Land-Use/Cover Changes and… Figure 1: Map showing the location of the Study Area in Ghana Generally, the Metropolis does not experience severe weather conditions. The climate of the metropolis is equatorial, with an average annual temperature of about 22 0c. Rainfall is bi-modal, with the major season occurring between March and July and the minor season occurring between August and November. The mean annual rainfall is about 1,380 mm, covering an average of 122 rainy days (Anon., 2011b). The natural vegetation has largely been degraded due to slash and burn farming practices and other human activities. The existing vegetation in the north and central portions of the Metropolis is mainly woodland. However, along the coastal areas there are thickets interspersed with tall grass species (Anon., 2011b). The Metropolis is of varied landscape; the coast line has capes and bays, which have been largely eroded. The central portion of the metropolis is low lying while the rest of the area is undulating with ridges and hills. The metropolis is drained by two main rivers; the Whin and the Kansawora Rivers, while the lagoons are the Essei and the Butre (Anon., 2011b). Major crops cultivated in the metropolis are cassava, maize, plantain, cocoyam, yam, sugarcane, oil palm, citrus, sweet potato, vegetables and coconut. Livestock reared include sheep, goats, local and commercial poultry, and to a lesser extent, cattle. Non-traditional commodities include grasscutter, beekeeping, mushroom, snail and agro-forestry/woodlots. In the fisheries sub-sector, marine fishing and aquaculture are the major areas. Data acquisition The data used for the study included subset of two Landsat images of 30 meter spatial resolution captured in 1988 and 2008. One image was obtained from the enhanced thematic mapper plus satellite (ETM+) and the other was from the thematic mapper (TM). The images were ordered and downloaded from the United States Geological Survey (USGS) website. Landsat images were chosen because they covered the period of the intended study and they have high spatial resolution suitable for the USGS Land cover classification system level 1 (Campbell, 2002; Jensen, 2000). The selection of the images was restricted to similar season to avoid seasonal differences in reflected radiation due to vegetation senescence. In addition, sample land cover information was collected with reference to the 2008 ETM+ image during field work in January 2012. Therefore the land cover map accuracy assessment was executed for only this image. The field work was also used to measure coordinates of known ground points for geo-referencing of the two images. The geo-referencing was executed with the ArgGIS software from Environmental Systems Research Institute (ESRI). Also digital line maps were obtained from the Survey Division of the Lands Commission, Ghana. In order to draw inferences with relevant environmental variables, precipitation and temperature data was obtained from the Metrological Agency of Ghana. Also discharges of two rivers (Whin and Kansawora) were obtained from the Hydrological Service Department of Ghana’s Ministry of Water Resources Works and Housing. In figures … and …precipitation and temperature measured at the Takoradi Airport from 2001 to 2011 is displayed. Image Registration Image registration is executed to assign real world coordinates to images. This is to correct for geometric errors associated with the satellite images due a variety of reasons. These include instrumental errors, attitude of the sensors with respect to the rotation of the Earth and swath width of the sensor etc. Also image registration is executed to assign coordinates systems and projections to images. Image registration ensures that the features and process found on the satellite image are allocated their correct dimensions and positions. This is very important for change detection since we only compare the same geographic location at different times. The image registration in this study was executed with the ArcGIS software from ESRI. The images were registered to the 1984 World Geodetic System Universal Transverse Mercator (WGS ’84 UTM) Zone 30 North Projection. Although the images were already geo-referenced to the UTM ‘84 zone 30 N, they were re-projected to ensure that they are allocated their correct ground coordinates. This is normally referred to as geometric correction. www.theijes.com The IJES Page 68
  • 4. Remote Sensing for Mapping Land-Use/Cover Changes and… Land Cover Classification Image classification is performed to identify and assign real world thematic classes to the image pixels. In this study image classification was done in two stages, first by performing an unsupervised classification to assist in colleting additional training samples for the supervised classification. The maximum likelihood classification algorithm was selected because it has the ability to incorporate the statistics of the training samples before assigning the land covers to each pixel. The training samples obtained during fieldwork in January 2012 were used together with those collected after unsupervised classification. The landsat image bands used for the classification were the visible, near-infrared, middle and far-infrared. After image classification the land cover maps generated were filtered with the majority filter to remove the “salt-and-pepper appearance” (Lillesand and Kiefer, 2000) and to enhance the cartographic presentation. The landcover classes generated were built-up, grassland/shrubs, forest/farm lands, rivers/lakes/lagoons and sea. See Table 1 for the display of the nomenclature used for the land covers. Table1: Land cover classes nomenclature Code 1 2 3 4 5 LULC Classes Built-up land Grassland/shrubs Forests/farm lands Water Sea Description derived from USGS Level I Urban residential, commercial, industrial, transportation and services Grasses, shrubs,bushes Forests, palm, rubber plantations,coacoa farms Rivers, streams, lagoons, bays, estruaries, wetlands, lakes, dams Sea water in the Atlantic Ocean Urban LULC Change detection Change detection is a process to record the changes that have occurred in the LULC over a period of time. The change detection process to use depends on the phenomena or feature under investigation. If the change being studied has high temporal resolution, the images and procedures must account for the time. The change detection process adopted for this study is the post classification comparison. This is because the method is simple to execute and it provides detailed “from to” statistics suitable for decision making. The method was executed by using the two land cover maps generated for 1988 and 2008 in a raster GIS analysis. The 1988 land cover map was reclassified and combined with that of 2008 using map algebra functions within the spatial analyst of the ArcGIS software. The result was a land cover change map from 1988 to 2008. Also, the statistics of the change was extracted and analyzed using tables and graphs. Urban sprawl measurement and Analysis using Shannon’s Entropy Urban sprawl is the ‘scatteredness” of an urban area (Quezada et al., 2009). Urban sprawl has been measured in a variety of ways (Tewolde and Cabral, 2011; Besussi et al, 2006 ). However, the most common form of measurement and analysis has been the use of the Shannon’s entropy index (Tewolde and Cabral, 2011). It is computed by defining zones along major roads or by using buffers from the city centre(s) and calculating the density of built-up areas in each zone. This means the “scaterrednes” of development is measured along major roads or from the city centre. The index ranges from 0 to 1. An index of 0 means there is compactness in the urban development and efficient utilization of land is implied while an index of 1 means there is scattered development. In this paper the Shannon’s entropy, En, was calculated for the 1988 and 2008 land cover maps using the formula in equation (1). (1) Where, pi= and xi is the density of land development, equal to area of built-up divided by total land th area in i of n total zones, n is the number of zones from city centre. Results and Discussion Urban Land cover/Land use Results of the study are shown in the figures and tables below. In Figure 2, land cover maps of 1988 and 2008 are displayed. Five land cover classes: built-up areas, grasslands, forest, rivers/lakes and sea were identified in the study area. The classification accuracy estimate was executed for the 2008 image since ground truth data was captured with respect to that image. The overall accuracy of the classification generated from the confusion matrix was 88.88%. www.theijes.com The IJES Page 69
  • 5. Remote Sensing for Mapping Land-Use/Cover Changes and… It can be observed from Figure 2 and Table 3 that in 1988 the built-up area was 14.14 km,2 only 3% of the study area while the forests covered 332.66 km2, 70% of the study area. The land cover map of 2008 however shows that the builtup area was now 51.31 km2, 11% of the study area, an increase of 263 % (Table 4). In addition, the forested areas had reduced to 293.56 km2, a reduction of 12% (Table 4). In Figure 3 and Table 5 the LULC change map and statistics are also displayed. It can be observed from figure 4 that built-up areas in 2008 have mainly been taken from grasslands and forests. Also a substantial part of the forested areas have been converted to grassland or shrubs. In addition, some grasslands in 1988 have been reforested by 2008. This is possible because there are commercial rubber and palm plantation farms in the northern sections of the study area. The built-up areas have increased about 263% in the twenty year period while forested areas have reduced by more than 11% and grasslands by almost 2%. The reduction of the forest and grasslands and increase of urban built-up areas indicates a substantial increase in impervious surface areas. It is well noted that impervious surface areas are a major contributing factor to urban floods and urban heat island effects (Aduah et al., 2011). Therefore it is necessary that plans are made to convey run-off in the Takoradi-Sekondi Metropolis with a variety of objects. These could include well designed drains, ponds and wetlands. In Table 5 it is also interesting to note that some of the urban areas (rivers to urban: 0.68 km2) have encroached on the river banks most of which are wetlands. It is not surprising that many of the residences in these areas experience floods the most. Figure 2: A map showing land cover/land use for 1988 and 2008 Table 3: land cover statistics 1988 Class Built-up Grassland Forest Water Sea Total Area(km2) 14.148 72.958 332.658 2.957 51.472 474.193 2008 % of Area 2.98 15.39 70.15 0.62 10.86 100.00 Area(km2) 51.314 74.304 293.561 5.986 49.028 474.193 % of Area 10.82 15.67 61.91 1.26 10.34 100.00 Table 4: Land cover change statistics from 1988 to 2008 Land cover Built-up Grasslands Forest Water Sea Total 1988 14.148 72.958 332.658 2.957 51.472 474.193 Area (Km2) 2008 51.314 74.304 293.561 5.986 49.028 474.193 change 37.166 1.346 -39.097 3.029 -2.444 % change 262.691 1.845 -11.753 102.404 -4.747 The urban land cover change detected in Sekondi-Takoradi Metropolis shows that the city have experienced massive growth in the urban space and therefore problems associated with such changes are expected. These include high urban temperatures, high vulnerability to floods and reduction in rich agricultural areas. Some of the causes of these massive urban changes in the study area include high growth rate of population (Ghana statistical Service, 2000) and high population density. Also an increase in the Gross Domestic Product (GDP) of the city accounts partly for the high rate of urbanization. Many people are able to buy land and construct their own homes. Also many firms have established their regional or subregional offices and factories in the city within the period and many of them have constructed staff accommodation. The high rate of urbanization could also be negative for the communities living at the city fringes. This is because many of the peasant farmers have lost their lands to real estate developers, individuals and companies over the years. For many of these farmers they have no other source of income and therefore could become poorer as a result of losing their farm lands. www.theijes.com The IJES Page 70
  • 6. Remote Sensing for Mapping Land-Use/Cover Changes and… The urban change therefore has both negative and positive effects on the community. However, until detailed and timely inventory is done, it is not possible to make any assessment. Land cover land use map is therefore one of the first statistic required to manage the urban space efficiently to generate opportunities for all sectors of the economy. Without these maps it will be difficult to assess the success of any urban planning strategy. Figure 3: Land cover changed map from 1988 to 2008 Classes: 11-urban unchanged, 12: urban to grassland, 13: urban to forest, 14: urban to water bodies, 15: urban to sea, 21: grassland to urban, 22: grassland unchanged, 23: grassland to forest, Table 5: Land cover changed statistics Area(Km2) 12.196 0.655 0.743 0.333 0.221 19.997 20.005 32.103 0.850 0.003 17.842 53.473 260.677 0.666 0.001 0.683 0.168 0.003 1.953 0.150 0.596 0.003 0.035 2.184 48.654 474.193 Land cover Urban unchanged Urban to Grassland Urban to Forest Urban to Rivers Urban to Sea Grassland to Urban Grassland unchanged Grassland to Forest Grassland to Rivers Grassland to Sea Forest to Urban Forest to Grassland Forest unchanged Forest to rivers Forest to Sea Rivers to urban Rivers to Grassland Rivers to Forest Rivers unchanged Rivers to sea Sea to Urban Sea to grassland Sea to Forest Sea to Rivers Sea unchanged Total 24: grassland to water, 25: grassland to sea, 31: forest to urban, 32: forest to grassland, 33: forest unchanged, 34: forest to water, 35: forest to sea, 44: water, 55: sea unchanged Urban Sprawl Analysis To evaluate the level of dispersion of the urban development in the study area, the Shannon entropy index was calculated for the two dates studied. The study area is a coastal city hence the area of the sea was removed from the land cover maps before the sprawl analysis was done. The land cover maps of the two dates (1988 and 2008) were reclassified into built-up and non-built-up and crossed with 2 km buffer zones (Figure 4a) whose centre start from the city centre. Figure 4b show the build-up and non-built-up lands in 1988 and 2008 respectively. The area of built-up in each zone was calculated and the Shannon entropy was determined for each zone as well as the entire study area. The Shannon entropy for the study area ranged from 0.59 to 0.62 in 1988 and 2008 respectively. This is an indication that sprawling in the study area has not increased substantially between the two dates despite a massive (more than 263%) increase in built-up areas (Table 4). www.theijes.com The IJES Page 71
  • 7. Remote Sensing for Mapping Land-Use/Cover Changes and… Figure 4: a) Buffer zones in Sekondi-Takoradi and b) Built-up areas in 1988 and 2008 The fact that the city is less scattered therefore makes provision of services and infrastructure such as electricity, water, schools, hospitals and roads less complicated in terms of their spatial distribution. However, by inspecting the entropies for each zone it is revealed that the values for zones 6 km to 10 km from the city centre had the highest values for both the 1988 and 2008 land cover maps. This together with field evidence shows that some of the sections of the study area are more fragmented than others. For example new neighborhoods in the north eastern part of the study area, behind Kansaworado, Anaji Namibia and Ntankoful communities are scattered. There are many uncompleted buildings within a few completed residential ones. It is therefore imperative that urban planning methods that suit all these sections of the city be adopted for a sustainable utilization of the limited land resources in the study area. It is also important that plans are made to safeguard the agricultural lands in the outskirts of the city. The result of the study indicates that this can be done since the city has only few isolated settlements. Conclusions Land cover and its changes in the Sekondi-Takoradi Metropolis have been successfully mapped using satellite remote sensing techniques. The techniques adopted generated acceptable accuracies. The land cover changes in the study area have changed drastically since 1988. The urban area has more than doubled, while the forest areas have decreased by more than 10%. Also the areas covered by grasslands have increased. This means the percentage of impervious surface areas have increased tremendously raising the vulnerability of sections of the community living near rivers. Furthermore, urban sprawl analysis showed that Sekondi-Takoradi has not witnessed substantial sprawling between 1988 and 2008. However, sections of the city especially between 6 km and 10 km from the centre have high sprawling. The results of this study further indicate the importance of remote sensing to urban environmental monitoring and management especially in Africa. The city authorities in Sekondi-Takoradi can use the data generated to aid their future development plans that also protects agricultural lands in the outskirts. Also since land cover affects the climate, it is important that the land cover in the city is managed so as to protect the citizens from phenomenon such as urban heat island effects and floods. www.theijes.com The IJES Page 72
  • 8. Remote Sensing for Mapping Land-Use/Cover Changes and… REFERENCES [1.] [2.] [3.] [4.] [5.] [6.] [7.] [8.] [9.] [10.] [11.] [12.] [13.] [14.] [15.] [16.] [17.] [18.] [19.] [20.] [21.] [22.] [23.] [24.] [25.] Abiy, D. (2010), “Land Use/Land cover Dynamics and Soil Erosion Risk, for Sustainable Land Management in North Central Ethiopia: The Case of Antsokia-Gemza Woreda”, Msc. Thesis, Addis Ababa University, Ethiopia, 75pp. Aduah, M. S., Mantey, S. and Tagoe, N. D. (2012), “Mapping land surface temperature and land cover to detect urban heat island effect: a case study of Tarkwa, South West Ghana”, Research Journal of Environmental and Earth Sciences, vol. 4, 1, pp. 68-75. Aduah, M. S. and Aabeyir, R. (2012), “Land cover dynamics in Wa Municipality, Upper West Region of Ghana”, Research Journal of Environmental and Earth Sciences, Vol. 4, 6, pp. 658-644. Anon. (2009), “Fundamentals of Remote Sensing”, http://pcmas1.ccrs.nrcan.gc.ca/e.htm, Last Modified: May 4, 2009, Accessed: December 14, 2011. Anon. (2011a), “Ghana Western Region”, http://www.modernghana.com/favicon.ico, Last Modified: September 19, 2011, Accessed: September 19, 2011. Anon. (2011b), “Districts-Western Region”, http://mofa.gov.gh/site, Last Modified: September 24, 2011, Accessed: January 17, 2012. Anon. (2012), “Sekondi-Takoradi”, http://en.wikipedia.org/wiki/, Last Modified: January 4, 2012, Accessed: January 17, 2012. Attua, E. M. and Fisher, J. B. (2011), “Historical and Future Land Cover Change in a Municipality of Ghana”, Earth Interactions, Vol. 15, pp.2-3. Besussi, E., Chin, N. and Longley, P. A. (2006), “The Structure and Form of Urban Settlements”, In: Tarek, R and Juergens, C, (eds.), Remote Sensing of Urban and Suburban Areas, Springer. Boakye, E., Odai, S. N., Adjei, K. A. and Annor, F. O. (2008), “Landsat Images for Assessment of the Impact of Land Use and Land Cover Changes on the Barekese Catchment in Ghana”, European Journal of Scientific Research, Vol. 22, No.1, pp.269-278. Campbell, J. B., (2002), “Introduction to Remote Sensing”, 3rd Edition, London: Taylor and Francis, 621pp. Coppin, E., Jonckheere, I., Nackaerts, K. and Muys, B. (2004),”Digital Change Detection Methods in Ecosystem Monitoring: a review”, International Journal of Remote Sensing, 25, 9, pp. 1565 – 1596. Hunt, R., Hamilton, R. and Everitt, J. (2009), “Mapping Weed Infestations Using Remote Sensing”, http://www.fs.us/eng/rsac, Last Modified: April 27, 2009, Accessed: December 14, 2011. Jensen, J. R. (2000),”Remote Sensing of the Environment: an Earth Resource Perspective”, New Jersey: Prentice-Hall. Kabba, V. T. S. and Jiangfeng, L. (2011), “Analysis of Land Use and Land Cover Changes and Their Ecological implications in Wuhan China”, Journal of Geography and Geology, Vol. 3, No. 1, 15pp. Lillesand, T. M. and Kiefer, R. W. (2000), “Remote Sensing and Image Interpretation”, John Wiley & Sons, Chichester, pp.724. Lu, D., Mausel, P., Brondizio, E. and Moran, E. (2004), “Change Detection Techniques”, International Journal of Remote Sensing, 25, 12, pp. 2365-2407. Lunetta, R. S. and Elvidge, C. D. (1999),”Remote Sensing Change Detection”, Environmental monitoring methods and applications, Taylor and Francis, London. Manonmani, R. and Sunganya, D. M. G. (2010), “Remote Sensing and Application in Change Detection Study in Urban Zone Using Multi Temporal Satellite”, Vol. 1, No. 6, 6pp. Parabaharan, S., Raju, K. S., Ramalingam, M. and Lakshumanan, C. (2010), “Remote Sensing and GIS Applications on Change Detection Study in Coastal Zone Using Multi Temporal Satellite data”, International Journal of Geomatics and Geosciences, Vol. 1, No. 2, pp.161-164. Quezada, C. R., Olivera, I. M. and Vilalta, J. P. (2009), “Cartography of Spatial Analysis of Urban Sprawl”, http://icaci.org/files/documents/ICC_proceedings/ICC2009/html/refer/5_2.pdf. Accessed: 6th August, 2012. Tewolde, M. G. and Cabral, P. (2011),” Urban Sprawl Analysis and Modeling in Asmara, Eritrea”, Remote Sensing, 3, pp. 21482165. Zubair, A. O. (2006), “Change Detection in Land Use and Land Cover Using Remote Sensing Data and GIS: A case study of Ilorin and its environs in Kwara”, Msc. Thesis, University of Ibadan, Nigeria, 54pp. www.theijes.com The IJES Page 73