
Recommended
Recommended
More Related Content
What's hot
What's hot (20)
Viewers also liked
Viewers also liked (19)
Similar to K021203066079
Similar to K021203066079 (20)
Recently uploaded
Recently uploaded (20)
K021203066079
- 1. The International Journal Of Engineering And Science (IJES) ||Volume|| 2 ||Issue|| 12 || Pages || 66-79 || 2013 || ISSN (e): 2319 – 1813 ISSN (p): 2319 – 1805 The Optical and Microphysical Properties of water Soluble Aerosols 1 D.O. Akpootu, 2M. J. Abdul salami 1 Department of Physics, Usmanu Danfodiyo University, Sokoto, Nigeria. M. Sc. Student, Department of Physics, Usmanu Danfodiyo University, Sokoto, Nigeria. 2 --------------------------------------------------------------ABSTRACT--------------------------------------------------------This paper describes the hygroscopicity properties of water soluble aerosols component based on optical and microphysical properties of urban aerosols using data extracted from Optical Properties of Aerosols and Clouds (OPAC) incorporated with FORTRAN program were modeled to determine the density mix ratio due to hygroscopic growth factor and bulk hygroscopicity at spectral range of 0.25-1.00 m for eight relative humidities (RHs) (0, 50, 70, 80, 90, 95, 98 and 99%). The extracted optical properties are scattering and absorption coefficients while the microphysical properties are volume mix ratio and mass mix ratio as a function of RH which was used to determine the density mix ratio. The scattering and absorption coefficients along with their respective hygroscopicity reflect cooling effect indicating a more scattering aerosol. The density mix ratio indicates that there is a steady increase in aerosol hygroscopic growth factor with RHs and decrease in the magnitude of bulk hygroscopicity, B of the atmospheric water soluble aerosols as we moved from the first model to the fifth model. Using SPSS 16.0 software for the regression analysis of both scattering and absorption coefficients for the Ångström exponent, and curvature, shows that the data excellently fits in terms of their coefficient of determination. Keywords: Density mix ratio, hygroscopic growth factor, bulk hygroscopicity, aerosols, water soluble, scattering coefficient, and absorption coefficient. ----------------------------------------------------------------------------------------------------------------------------- ---------Date of Submission: 25 December 2013 Date of Acceptance: 08 January 2014 ----------------------------------------------------------------------------------------------------------------------------- ---------- I. INTRODUCTION Atmospheric aerosols are complex in their sources, evolutions, and interactions with water vapor in the atmosphere and as a result of that they affect the regional and global climate by participating in various atmospheric processes. Their hygroscopic response with the changes in relative humidity (RH) is critically important for their cloud condensation nuclei (CCN) activity, atmospheric residence time, optical property, microphysical property and chemical reactivity and so is one of the key factors in defining their impacts on climate. The hygroscopic growth of aerosol particles are of current interest due to their effects on light scattering and absorption properties of particles which thereby affect the air quality, visibility, Earth’s radiation and the climate (Charlson et al., 1992; IPCC, 2007). On a global basis, sulfates, nitrates and chlorides contribute the largest to the mass budget of fine atmospheric particles (IPCC, 2007; Li et al., 2009; Shen et al., 2009). The effects of hygroscopic growth on optical properties are that primarily, it causes increase of the geometric sizes of the aerosol particles with increasing RH, and secondarily the decrease in the index of refraction of those particles that are solution drops with increasing RH as the drops become larger and thus more dilute. Hygroscopic properties are key properties of aerosol particles, affecting particle growth by water vapor, scattering efficiency of particles, and potential for the formation of cloud condensation nuclei. Also, an accurate measurement of hygroscopic properties of nanoparticles is essential for better understanding of atmospheric nanoparticle formation and growth. However, there has been limited information on how the hygroscopic properties of atmospheric particles will vary with decreasing size below 50 nm. Hygroscopic properties (deliquescence relative humidity (DRH) and growth factor (GF)) of nanoparticles may or may not be the same as those of submicron or larger particles. For example, theoretical prediction of the GF using the Kelvin correction would not suffice to accurately determine hygroscopic behaviors for such small particles (Hӓmeri et al. 2000; Hӓmeri et al., 2001; Russell and Ming 2002). This paper uses data extracted from OPAC to show that the scattering and absorption coefficients of optical properties of atmospheric water soluble aerosols testifies its cooling effect on earth’s atmosphere and aimed at to ascertain if the density mix ratio will give a higher value of coefficient of determination when compare to microphysical volume and mass mix ratios already proposed. www.theijes.com The IJES Page 66
- 2. The Optical and Microphysical Properties of water Soluble Aerosols II. METHODOLOGY The models extracted from OPAC are given in table 1 Table 1: Compositions of aerosols types (Hess et al., 1998) Components Insoluble Water soluble Soot Total Model 1 No.density (cm-3) 1.50 15,000.00 120,000.00 135,001.50 Model 2 No.density (cm-3) 1.50 20,000.00 120,000.00 140,001.50 Model 3 No.density (cm-3) 1.50 25,000.00 120,000.00 145,001.50 Model 4 No.density (cm-3) 1.50 30,000.00 120,000.00 150,001.50 Model 5 No.density (cm-3) 1.50 35,000.00 120,000.00 155,001.50 The data used for the urban aerosols in this paper are derived from the Optical Properties of Aerosols and Clouds (OPAC) data set (Hess et al., 1998). The main parameter used to characterize the hygroscopicity of the aerosol particles is the aerosol hygroscopic growth factor gf(RH), which indicates the relative increase in mobility diameter of particles due to water absorption at a certain RH and is defined as the ratio of the particle diameter at any RH to the particle diameter at RH=0 and RH is taken for seven values 50%, 70%, 80%, 90%, 95%, 98% and 99%. (Swietlicki et al. , 2008; Randles et al., 2004): (1) The hygroscopic growth factor of a mixture, gf mix(RH), can be estimated from the growth factors of the individual components of the aerosol and their respective volume fractions, V k, using the Zdanovskii-StokesRobinson relation (ZSR relation; Sjogren et al., 2007; Stokes and Robinson, 1966; Meyer et al., 2009; Stock et al., 2011): (2) where the summation is performed over all compounds present in the particles. The gfmix(RH) to be a function of mass mix ratio was proposed by Tijjani and Uba (2013) as (3) where the subscript k represents the different substances. We now proposed the gfmix(RH) to be a function of density mix ratio as (4) The RH dependence of gfmix(RH) can be parameterized in a good approximation by a one-parameter equation, proposed e.g. by Petters and Kreidenweis (2007): (5) Here, aw is the water activity, which can be replaced by the relative humidity RH at equilibrium (Seinfeld and Pandis, 2006), if the Kelvin effect is negligible, as for particles with sizes more relevant for light scattering and absorption. The coefficient κ is a simple measure of the particle’s hygroscopicity and captures all solute properties (Raoult effect). Humidograms of the ambient aerosols obtained in various atmospheric conditions showed that gf mix(RH) could as well be fitted well with a γ-law (Swietlicki et al., 2000; Gysel et al., 2009; Putaud, 2012) as (6) Particle hygroscopicity is a measure that scales the volume of water associated with a unit volume of dry particle (Petters and Kreidenweis, 2007) and depends on the molar volume and the activity coefficients of the dissolved compounds (Christensen and Petters, 2012). The bulk hygroscopicity factor B under subsaturation RH conditions was determined using the following relation: (7) where aw is the water activity, which can be replaced by the relative humidity RH as explained before. The spectral behavior of the aerosol optical thickness, scattering, absorption and extinction coefficients can be used to obtain some information regarding the size distribution by just looking at the Ångström coefficient exponent that expresses the spectral dependence of aerosol optical depth , scattering scat (), absorption abs () and extinction ext () coefficients, with the wavelength of light () as inverse power law (Ångström, 1929; Ångström, 1961). (8) www.theijes.com The IJES Page 67
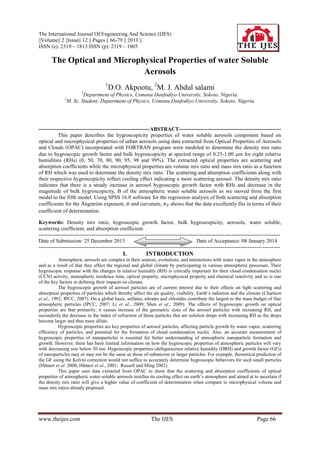
- 3. The Optical and Microphysical Properties of water Soluble Aerosols where can be any of the parameters mentioned above. In this paper the scattering scat () and absorption abs () coefficients are used. The formula is derived on the premise that the extinction of solar radiation by aerosols is a continuous function of wavelength, without selective bands or lines for scattering or absorption (Ranjan et al., 2007). The wavelength dependence of scat () and abs () are characterized by the Ångström parameter, which is a coefficient of the following regression: (9) And (10) where and are Ångström exponent and turbidity coefficient ( Liou, 2002; O’Neill and Royer, 1993). The Ångström exponent itself varies with wavelength, and a more precise empirical relationship between aerosol extinction and wavelength is obtained with a 2nd-order polynomial (King and Byrne, 1976) as: (11) (12) The coefficient accounts for “curvature” often observed in Sun photometry measurements. In case of negative curvature ( ) while positive curvature . Eck et al., (1999) reported the existence of negative curvatures for fine mode and positive curvatures for significant contribution by coarse mode particles in the size distribution. The hygroscopicity was obtained using the equation (13) (14) where is the value of any RH other than at 0% RH while III. is the value of RH at 0% RESULTS AND DISCUSSION Table 2: The growth factor and bulk hygroscopicity of the aerosols using density mix ratio for model (1-5) Model 1 RH(%) gfmix Model 2 Bulk Hyg gfmix Model 3 Bulk Hyg gfmix Model 4 Bulk Hyg gfmix Model 5 Bulk Hyg gfmix Bulk Hyg 50 0.99022 -0.02013 0.99048 -0.01960 0.99094 -0.01866 0.99141 -0.01770 0.99192 -0.01666 70 0.98245 -0.01845 0.98368 -0.01718 0.98494 -0.01587 0.98611 -0.01466 0.98712 -0.01360 80 0.97637 -0.01545 0.97871 -0.01395 0.98081 -0.01260 0.98263 -0.01143 0.98413 -0.01046 90 0.96857 -0.00963 0.97308 -0.00828 0.97652 -0.00725 0.97918 -0.00645 0.98138 -0.00578 95 0.96728 -0.00487 0.97304 -0.00404 0.97708 -0.00345 0.98008 -0.00300 0.98241 -0.00266 98 0.97235 -0.00163 0.97796 -0.00131 0.98167 -0.00109 0.98433 -0.00093 0.98630 -0.00082 99 0.97724 -0.00067 0.98212 -0.00053 0.98530 -0.00044 0.98749 -0.00037 0.98916 -0.00032 Adopting the density mix ratio shows that there is a decrease in aerosol hygroscopic growth factor from 50-95% RHs and subsequently increases from 98-99% RHs in models 1 and 2 while in models 3, 4 and 5 it decreases from 50-90% RHs and increases from 95-99% RHs. The bulk hygroscopicity, B increases with RHs, though, decreases in magnitude with increase in RHs. We observed that there is a steady increase in aerosol hygroscopic growth factor with RHs and decrease in the magnitude of bulk hygroscopicity, B as we moved from model 1-5. Model1 Model3 Model5 0.995 Model2 Model4 0.990 gfmix(RH) 0.985 0.980 0.975 0.970 0.965 50 60 70 80 90 100 Relative Humidity (%) www.theijes.com The IJES Page 68
- 4. The Optical and Microphysical Properties of water Soluble Aerosols Figure 1: A graph of growth factor of the mixture using density mix ratio (model 1-5) Model1 Model3 Model5 Bulk Hygroscopicity 0.000 Model2 Model4 -0.005 -0.010 -0.015 -0.020 50 60 70 80 90 100 Relative Humidity (%) Figure 2: A graph of bulk hygroscopicity of the mixture using density mix ratio (model 1-5) Figure 1 show the graph of aerosol hygroscopic growth factor with RHs. The hygroscopic growth factor decreases with increase in RHs from 50-90% RHs and becomes almost linear with small positive slope between 90-95% RHs and then rose steadily from 95-99% RHs in model 3, 4 and 5. However, between 90-95% RHs in model 1 and 2 gives a small negative slope and also rose steadily from 95-99% RHs. The deliquescence point was observed as from 90-99% RHs, higher RHs implies more moisture in the atmosphere leads the aerosol particles to absorb more water vapour on particle surface. The figure can be described as barely hygroscopic (Liu et al., 2011; Swietlick et al., 2008). The bulk hygroscopicity, B increases with RHs, though, decreases in magnitude with increase in RHs as displayed in figure 2 SCAT00 SCAT70 SCAT90 SCAT98 1.3 1.2 -1 Scattering Coefficient (Km ) 1.1 1.0 SCAT50 SCAT80 SCAT95 SCAT99 0.9 0.8 0.7 0.6 0.5 0.4 0.3 0.2 0.1 0.0 0.3 0.4 0.5 0.6 0.7 0.8 0.9 1.0 Wavelength (m) Figure 3: a graph of scattering coefficient against wavelength HYG0050 HYG0080 HYG0095 HYG0099 11 HYG0070 HYG0090 HYG0098 10 Hygroscopicity 9 8 7 6 5 4 3 2 1 0.3 0.4 0.5 0.6 0.7 0.8 0.9 1.0 Wavelength (m) Figure 4: a graph of hygroscopicity against wavelength www.theijes.com The IJES Page 69
- 5. -1 Scattering Coefficient (Km ) The Optical and Microphysical Properties of water Soluble Aerosols SCAT00 SCAT70 SCAT90 SCAT98 1.7 1.6 1.5 1.4 1.3 1.2 1.1 1.0 0.9 0.8 0.7 0.6 0.5 0.4 0.3 0.2 0.1 0.0 0.3 0.4 0.5 SCAT50 SCAT80 SCAT95 SCAT99 0.6 0.7 0.8 0.9 1.0 Wavelength (m) Figure 5: a graph of scattering coefficient against wavelength HYG0050 HYG0080 HYG0095 HYG0099 12 HYG0070 HYG0090 HYG0098 11 10 Hygroscopicity 9 8 7 6 5 4 3 2 1 0.3 0.4 0.5 0.6 0.7 0.8 0.9 1.0 Wavelength (m) Figure 6: a graph of hygroscopicity against wavelength SCAT00 SCAT70 SCAT90 SCAT98 2.2 2.0 -1 Scattering Coefficient (Km ) 1.8 SCAT50 SCAT80 SCAT95 SCAT99 1.6 1.4 1.2 1.0 0.8 0.6 0.4 0.2 0.0 0.3 0.4 0.5 0.6 0.7 0.8 0.9 1.0 Wavelength (m) Figure 7: a graph of scattering coefficient against wavelength www.theijes.com The IJES Page 70
- 6. The Optical and Microphysical Properties of water Soluble Aerosols HYG0050 HYG0080 HYG0095 HYG0099 13 HYG0070 HYG0090 HYG0098 12 11 10 Hygroscopicity 9 8 7 6 5 4 3 2 1 0.3 0.4 0.5 0.6 0.7 0.8 0.9 1.0 Wavelength (m) Figure 8: a graph of hygroscopicity against wavelength SCAT00 SCAT70 SCAT90 SCAT98 2.6 2.4 -1 Scattering Coefficient (Km ) 2.2 SCAT50 SCAT80 SCAT95 SCAT99 2.0 1.8 1.6 1.4 1.2 1.0 0.8 0.6 0.4 0.2 0.0 0.3 0.4 0.5 0.6 0.7 0.8 0.9 1.0 Wavelength (m) Figure 9: a graph of scattering coefficient against wavelength HYG0050 HYG0080 HYG0095 HYG0099 14 HYG0070 HYG0090 HYG0098 13 12 Hygroscopicity 11 10 9 8 7 6 5 4 3 2 0.3 0.4 0.5 0.6 0.7 0.8 0.9 1.0 Wavelength (m) Figure 10: a graph of hygroscopicity against wavelength www.theijes.com The IJES Page 71
- 7. The Optical and Microphysical Properties of water Soluble Aerosols SCAT00 SCAT70 SCAT90 SCAT98 3.0 2.8 -1 Scattering Coefficient (Km ) 2.6 2.4 SCAT50 SCAT80 SCAT95 SCAT99 2.2 2.0 1.8 1.6 1.4 1.2 1.0 0.8 0.6 0.4 0.2 0.0 0.3 0.4 0.5 0.6 0.7 0.8 0.9 1.0 Wavelength (m) Figure 11: a graph of scattering coefficient against wavelength HYG0050 HYG0080 HYG0095 HYG0099 14 HYG0070 HYG0090 HYG0098 Hygroscopicity 12 10 8 6 4 2 0.3 0.4 0.5 0.6 0.7 0.8 0.9 1.0 Wavelength (m) Figure 12: a graph of hygroscopicity against wavelength Figures (3, 5, 7, 9 and11) shows the graphs of scattering coefficients against wavelength, from the graphs we observed that it follows a relatively smooth decrease in wavelength at all RHs and this can be approximated to power law wavelength dependence (Akpootu and Momoh, 2013), the graphs further show that there is a relatively strong wavelength dependence of scattering coefficients at shorter wavelengths that gradually decreases towards the longer wavelengths regardless of the RHs attributing to the presence of fine and coarse mode particles. However, due to hygroscopic growth, the smaller particles scatter more light at shorter wavelengths compared to bigger particles. The overall effects as we moved from model 1-5 shows that there is an increase in scattering coefficients at all RHs, indicating that water soluble has high scattering coefficient, which in turn implies cooling effect. Figures (4, 6, 8, 10 and 12) shows their respective hygroscopicity for each scattering coefficient, we observed that the hygroscopicity increases with increase in RHs as we moved from model 1-5; the hygroscopic growth is more pronounced as from 90-99% RHs www.theijes.com The IJES Page 72
- 8. The Optical and Microphysical Properties of water Soluble Aerosols 0.16 ABS00 ABS70 ABS90 ABS98 -1 Absorption Coefficient (Km ) 0.14 0.12 ABS50 ABS80 ABS95 ABS99 0.10 0.08 0.06 0.04 0.02 0.3 0.4 0.5 0.6 0.7 0.8 0.9 1.0 Wavelength (m) Figure 13: a graph of absorption coefficient against wavelength 2.0 HYG0050 HYG0080 HYG0095 HYG0099 Hygroscopicity 1.5 HYG0070 HYG0090 HYG0098 1.0 0.5 0.0 0.3 0.4 0.5 0.6 0.7 0.8 0.9 1.0 Wavelength (m) Figure 14: a graph of hygroscopicity against wavelength ABS00 ABS70 ABS90 ABS98 -1 Absorption Coefficient (Km ) 0.16 0.14 0.12 ABS50 ABS80 ABS95 ABS99 0.10 0.08 0.06 0.04 0.02 0.3 0.4 0.5 0.6 0.7 0.8 0.9 1.0 Wavelength (m) Figure 15: a graph of absorption coefficient against wavelength www.theijes.com The IJES Page 73
- 9. Hygroscopicity The Optical and Microphysical Properties of water Soluble Aerosols 1.032 1.030 1.028 1.026 1.024 1.022 1.020 1.018 1.016 1.014 1.012 1.010 1.008 1.006 1.004 1.002 1.000 0.998 0.996 HYG0050 HYG0080 HYG0095 HYG0099 0.3 0.4 0.5 HYG0070 HYG0090 HYG0098 0.6 0.7 0.8 0.9 1.0 Wavelength (m) Figure 16: a graph of hygroscopicity against wavelength 0.18 ABS00 ABS70 ABS90 ABS98 -1 Absorption Coefficient (Km ) 0.16 0.14 ABS50 ABS80 ABS95 ABS99 0.12 0.10 0.08 0.06 0.04 0.02 0.3 0.4 0.5 0.6 0.7 0.8 0.9 1.0 X axis title Figure 17: a graph of absorption coefficient against wavelength HYG0050 HYG0080 HYG0095 HYG0099 1.04 Hygroscopicity 1.03 HYG0070 HYG0090 HYG0098 1.02 1.01 1.00 0.3 0.4 0.5 0.6 0.7 0.8 0.9 1.0 Wavelength (m) Figure 18: a graph of hygroscopicity against wavelength www.theijes.com The IJES Page 74
- 10. The Optical and Microphysical Properties of water Soluble Aerosols -1 Absorption Coefficient (Km ) 0.18 ABS00 ABS70 ABS90 ABS98 0.16 0.14 ABS50 ABS80 ABS95 ABS99 0.12 0.10 0.08 0.06 0.04 0.02 0.3 0.4 0.5 0.6 0.7 0.8 0.9 1.0 Wavelength (m) Figure 19: a graph of absorption coefficient against wavelength HYG0050 HYG0080 HYG0095 HYG0099 1.05 Hygroscopicity 1.04 HYG0070 HYG0090 HYG0098 1.03 1.02 1.01 1.00 0.99 0.3 0.4 0.5 0.6 0.7 0.8 0.9 1.0 Wavelength (m) Figure 20: a graph of hygroscopicity against wavelength 0.20 ABS00 ABS70 ABS90 ABS98 -1 Absorption Coefficient (Km ) 0.18 0.16 ABS50 ABS80 ABS95 ABS99 0.14 0.12 0.10 0.08 0.06 0.04 0.02 0.3 0.4 0.5 0.6 0.7 0.8 0.9 1.0 Wavelength (m) Figure 21: a graph of absorption coefficient against wavelength www.theijes.com The IJES Page 75
- 11. The Optical and Microphysical Properties of water Soluble Aerosols 1.055 HYG0050 HYG0080 HYG0095 HYG0099 1.050 1.045 1.040 HYG0070 HYG0090 HYG0098 Hygroscopicity 1.035 1.030 1.025 1.020 1.015 1.010 1.005 1.000 0.995 0.3 0.4 0.5 0.6 0.7 0.8 0.9 1.0 Wavelength (m) Figure 22: a graph of hygroscopicity against wavelength Figures (13, 15, 17, 19 and 21) shows the graphs of absorption coefficients against wavelength, from the graphs we observed that there is no much absorption of solar radiation by the aerosols as we moved from model 1-5 indicating a less absorption and more scattering aerosols which reflects the dominance of cooling effect. Figures (14, 16, 18, 20 and 22) shows their respective hygroscopicity for each of the absorption coefficients, figure 14 shows almost a stable aerosols at all RHs while figures (16, 18, 20 and 22) shows an unstable or scattering aerosols due to absorption and tends to increase in growth factor. Table 3: The results of RH(%) 0 50 70 80 90 95 98 99 R2 0.98211 0.98254 0.98221 0.98150 0.97976 0.97690 0.97145 0.96626 Table 4: The results of RH(%) 0 50 70 80 90 95 98 99 R2 0.97909 0.98036 0.98027 0.97975 0.97830 0.97566 0.97039 0.96532 Table 5: The results of RH(%) 0 50 70 80 90 95 98 99 R2 0.97679 0.97880 0.97892 0.97857 0.97732 0.97488 0.96973 0.96475 www.theijes.com and for scattering coefficient (model 1) using equations (9) and (11) with SPSS 16.0 LINEAR 1.32628 1.31859 1.30065 1.27856 1.22248 1.14364 1.02122 0.93291 and LINEAR 1.35561 1.33715 1.31431 1.28836 1.22654 1.14381 1.01845 0.92966 R2 0.99674 0.99838 0.99884 0.99913 0.99950 0.99973 0.99988 0.99992 QUADRATIC 1 2 -1.87929 -0.40567 -1.89052 -0.41955 -1.87890 -0.42419 -1.86387 -0.42936 -1.81522 -0.43482 -1.74086 -0.43811 -1.61804 -0.43781 -1.52775 -0.43636 0.03031 0.04415 0.05331 0.06352 0.09016 0.13559 0.23704 0.34412 for scattering coefficient (model 2) using equations (9) and (11) with SPSS 16.0 LINEAR 1.34355 1.32975 1.30889 1.28444 1.22479 1.14364 1.01971 0.93081 and 0.03419 0.05002 0.06048 0.07218 0.10261 0.15446 0.27000 0.39180 0.04146 0.06255 0.07652 0.09211 0.13271 0.20183 0.35590 0.51837 R2 0.99728 0.99871 0.99909 0.99932 0.99960 0.99979 0.99990 0.99994 QUADRATIC 1 2 -1.96906 -0.45886 -1.95121 -0.45588 -1.92841 -0.45447 -1.90456 -0.45490 -1.84222 -0.45293 -1.75795 -0.45064 -1.62724 -0.44567 -1.53307 -0.44180 0.03617 0.05462 0.06684 0.08045 0.11599 0.17652 0.31172 0.45455 for scattering coefficient (model 3) using equations (9) and (11) with SPSS 16.0 0.04873 0.07508 0.09254 0.11203 0.16277 0.24917 0.44185 0.64493 R2 0.99762 0.99889 0.99922 0.99942 0.99967 0.99982 0.99992 0.99995 The IJES 1 -2.03192 -1.99153 -1.96094 -1.93081 -1.86008 -1.76885 -1.63239 -1.53633 QUADRATIC 2 -0.49612 -0.48003 -0.47435 -0.47129 -0.46475 -0.45851 -0.45037 -0.44503 0.04204 0.06510 0.08036 0.09738 0.14176 0.21741 0.38646 0.56498 Page 76
- 12. The Optical and Microphysical Properties of water Soluble Aerosols Table 6: The results of and for scattering coefficient (model 4) using equations (9) and (11) with SPSS 16.0 LINEAR 0 50 70 80 90 95 98 99 QUADRATIC 1.36448 1.34260 1.31817 1.29104 1.22772 1.14364 1.01791 0.92859 R2 0.97503 0.97766 0.97794 0.97771 0.97663 0.97434 0.96924 0.96430 RH(%) Table 7: The results of and 0.05598 0.08760 0.10856 0.13195 0.19283 0.29657 0.52777 0.77157 R2 0.99786 0.99901 0.99931 0.99949 0.99971 0.99984 0.99993 0.99995 1 -2.07771 -2.02044 -1.98391 -1.94932 -1.87237 -1.77580 -1.63667 -1.53858 2 -0.52321 -0.49725 -0.48837 -0.48289 -0.47290 -0.46373 -0.45391 -0.44747 0.04792 0.07556 0.09389 0.11430 0.16753 0.25836 0.46113 0.67543 for scattering coefficient (model 5) using equations (9) and (11) with SPSS 16.0 LINEAR QUADRATIC R 1 2 0 50 70 80 90 95 0.97361 0.97676 0.97719 0.97703 0.97617 0.97392 1.37136 1.34628 1.32092 1.29313 1.22837 1.14383 0.06324 0.10016 0.12459 0.15186 0.22293 0.34390 0.99802 0.99910 0.99938 0.99953 0.99973 0.99985 -2.11325 -2.04179 -2.00092 -1.96355 -1.88029 -1.78154 -0.54423 -0.51021 -0.49883 -0.49180 -0.47823 -0.46780 0.05379 0.08606 0.10742 0.13120 0.19338 0.29923 98 99 0.96899 0.96402 1.01739 0.92812 0.61367 0.89810 0.99994 0.99996 -1.63847 -1.54030 -0.45560 -0.44907 0.53591 0.78582 RH(%) R 2 2 According to (Eck et al., 1999; Eck et al., 2001) and Ranjan (2007) positive values of Ångström exponent, are characteristics of fine-mode dominated aerosols size distributions while near zero and negative values are characteristics of dominant coarse-mode, or bi-modal size distributions, with coarse-mode aerosols having significant magnitude. Tables (3-7) shown the tables of the Ångström exponent, and curvature, for the scattering coefficient, we observed that the reflects the dominance of fine mode particles at all RHs and also decreases with increase in RHs in each table; however, there is an increase in when we moved from model 1-5. The confirms the with increasing magnitude. The coefficient of determination shows that the data fits excellently. Table 8: The results of RH(%) 0 50 70 80 90 95 98 99 R2 0.99804 0.99816 0.99803 0.99790 0.99771 0.99749 0.99721 0.99714 Table 9: The results of RH(%) 0 50 70 80 90 95 98 99 R2 0.99652 0.99572 0.99545 0.99519 0.99478 0.99438 0.99386 0.99367 www.theijes.com and for absorption coefficient (model 1) using equations (10) and (12) with SPSS 16.0 LINEAR 1.06754 1.06888 1.06899 1.06920 1.06897 1.06893 1.06876 1.06783 and 0.02870 0.03098 0.03100 0.03101 0.03104 0.03107 0.03112 0.03116 R2 0.99922 0.99920 0.99917 0.99913 0.99908 0.99902 0.99896 0.99894 QUADRATIC 1 2 -0.94243 0.09178 -0.95071 0.08669 -0.94555 0.09055 -0.94057 0.09436 -0.93349 0.09939 -0.92607 0.10480 -0.91603 0.11203 -0.91302 0.11356 0.02949 0.03179 0.03184 0.03189 0.03197 0.03205 0.03217 0.03223 for absorption coefficient (model 2) using equations (10) and (12) with SPSS 16.0 LINEAR 1.07612 1.07605 1.07598 1.07618 1.07640 1.07600 1.07572 1.07451 0.03138 0.03142 0.03144 0.03146 0.03149 0.03154 0.03160 0.03166 R2 0.99890 0.99866 0.99859 0.99852 0.99843 0.99832 0.99820 0.99815 The IJES QUADRATIC 1 2 -0.89656 0.13172 -0.87627 0.14655 -0.86934 0.15159 -0.86355 0.15598 -0.85373 0.16335 -0.84452 0.16981 -0.83287 0.17815 -0.82794 0.18087 0.03264 0.03282 0.03289 0.03295 0.03306 0.03318 0.03332 0.03341 Page 77
- 13. The Optical and Microphysical Properties of water Soluble Aerosols Table 10: The results of and for absorption coefficient (model 3) using equations (10) and (12) with SPSS 16.0 0 50 70 80 90 95 R2 0.99367 0.99236 0.99193 0.99151 0.99085 0.99019 LINEAR 1.08275 1.08277 1.08258 1.08250 1.08264 1.08217 0.03182 0.03187 0.03189 0.03192 0.03196 0.03202 R2 0.99830 0.99793 0.99782 0.99768 0.99753 0.99735 QUADRATIC 1 2 -0.83027 0.18521 -0.80560 0.20332 -0.79749 0.20914 -0.79072 0.21404 -0.77900 0.22274 -0.76781 0.23060 0.03362 0.03385 0.03394 0.03401 0.03415 0.03429 98 0.98937 1.08153 0.03210 0.99716 -0.75370 0.24049 0.03448 99 0.98908 1.08045 0.03216 0.99713 -0.74752 0.24422 0.03459 RH(%) Table 11: The results of R2 0.99013 0.98830 0.98765 0.98711 0.98614 0.98521 0.98404 0.98365 RH (%) 0 50 70 80 90 95 98 99 Table 12: The results of and for absorption coefficient (model 4) using equations (10) and (12) with SPSS 16.0 LINEAR 1.08865 1.08837 1.08835 1.08842 1.08825 1.08767 1.08726 1.08567 and 0.03226 0.03232 0.03235 0.03238 0.03243 0.03250 0.03260 0.03268 R2 0.99753 0.99703 0.99686 0.99672 0.99646 0.99621 0.99597 0.99593 QUADRATIC 1 2 -0.76723 0.23579 -0.73889 0.25637 -0.72925 0.26343 -0.72158 0.26910 -0.70795 0.27898 -0.69511 0.28797 -0.67840 0.29993 -0.67121 0.30404 0.03461 0.03488 0.03499 0.03507 0.03524 0.03541 0.03564 0.03577 for absorption coefficient (model 5) using equations (10) and (12) with SPSS 16.0 0 50 70 80 R2 0.98611 0.98364 0.98282 0.98203 LINEAR 1.09429 1.09374 1.09361 1.09372 0.03270 0.03277 0.03281 0.03284 R2 0.99669 0.99600 0.99579 0.99559 QUADRATIC 1 2 -0.70706 0.28406 -0.67499 0.30719 -0.66436 0.31489 -0.65469 0.32206 0.03559 0.03591 0.03603 0.03614 90 95 98 99 0.98086 0.97964 0.97815 0.97761 1.09352 1.09276 1.09210 1.09043 0.03291 0.03299 0.03310 0.03319 0.99531 0.99499 0.99468 0.99461 -0.64008 -0.62549 -0.60708 -0.59924 0.03633 0.03653 0.03679 0.03694 RH (%) 0.33263 0.34278 0.35580 0.36032 Tables (8-12) shows the tables of the Ångström exponent, and curvature, for the absorption coefficient, the reflects the dominance of fine mode particles at all RHs, though, there is no stable relationship between them in terms of increasing and decreasing, at some points the increases and decreases with RHs. At 0% RH in table 8 the verifies , while from 50-99% RHs and subsequent tables reflects the dominance of coarse mode particles, this shows that the atmospheric aerosols are composed of both fine and coarse mode particles (Akpootu and Momoh, 2013). The coefficient of determination, shows that the data fits excellently. IV. CONCLUSION The scattering and absorption coefficients of optical properties of atmospheric water soluble aerosols along with their respective hygroscopicity verifies it’s cooling effect on earth’s atmosphere. The Ångström exponent, and curvature, reveals that the atmosphere is composed of both fine and coarse mode particles. Finally, the results shows that the density mix ratio of atmospheric water soluble aerosols as a function of bulk hygroscopicity and hygroscopic growth factor using one parameter equation and γ-law gives lower values of coefficient of determination despite the higher values of coefficient of determination for the already proposed volume and mass mix ratio models, though, gives the precise density of atmospheric aerosols in terms of their bulk hygroscopicity and hygroscopic growth factor as seen from our results. The density mix ratio shows that the mixture of growth factor is described to be barely hygroscopic. www.theijes.com The IJES Page 78
- 14. The Optical and Microphysical Properties of water Soluble Aerosols REFERENCES [1] [2] [3] [4] [5] [6] [7] [8] [9] [10] [11] [12] [13] [14] [15] [16] [17] [18] [19] [20] [21] [22] [23] [24] [25] [26] [27] [28] [29] [30] [31] Akpootu, D. O and Momoh, M. (2013): The Scattering coefficient, extinction coefficient and single scattering albedo of water soluble in the radiative forcing of urban aerosols, Scholars Research Library., 5(2), 109-120. Ångström, A (1929): On the atmospheric transmission of Sun radiation and on dust in the air, Geografiska Annaler, 11 156-166 Ångström, A (1961): Techniques of determining the turbidity, Tellus, 13(2) 214-223. Charlson, R.J., Schwartz, S.E., Hales, J.M., Cess, R.D., Coakley, J.A., Hansen, J.E. and Hofmann, D.J. (1992): Climate Forcing by Anthropogenic Aerosols. Science. 255: 423–430. Christensen, S. I. and Petters, M. D. (2012): The role of temperature in cloud droplet activation, J. Phys. Chem. A 116(39): 9706–9717. Eck, T. F., Holben, B. N., Reid, J. S., Dubovik, O., Smirnov, A., O’Neill, N. T., Slutsker, I and Kinne, S (1999): Wavelength Dependence of the Optical Depth of Biomass burning, Urban and desert dust Aerosols. Journal of Geophysical Research 104 31333-31,349. Eck, T. F., Holben, B. N., Dubovic, O., Smirnov, A., Slutsker, I., Lobert, J. M and Ramanathan, V. (2001).Column- integrated aerosol optical properties over the Maldives during the Northern monsoon for 1998-2000, Journal of Geophysical Research., 106 28,555-28,566. Gysel, M., McFiggans, G. B., and Coe, H. (2009): Inversion of tandem differential mobility analyser (tdma) measurements, J. Aerosol Sci., 40, 134–151, doi:10.1016/j.jaerosci.2008.07.013. Hӓmeri K, Vakeva M, Hansson HC, Laaksonen A (2000): Hygroscopic growth of ultrafine ammonium sulphate aerosol measured using an ultrafine tandem differential mobility analyzer. J Geophys Res., 105:22231–22242. doi: 10.1029/2000JD900220 Hӓmeri K, Laaksonen A, Vakeva M, Suni T (2001): Hygroscopic growth of ultrafine sodium chloride particles. J Geophys ResAtmos., 106:20749–20757. doi:10.1029/ 2000JD000200 Hess, M., Koepke, P and Schult, I (1998): Optical Properties of Aerosols and Clouds. American Meteorology Society. IPCC (2007): Climate Change 2007: The Scientific Basis. In Solomon, S., Ding, Y., Griggs, D.G., Noguer, M., Vanderlinden, P.G., Dai, X., Maskell, K. and Johnson, C.A. (Eds). Contribution of Working Group I to the Fourth Assessment Report of the Intergovernmental Panel on Climate Change. Cambridge University Press. Cambridge. King, M and Byrne, D (1976): A method for inferring total ozone content from the spectral variation of total optical depth obtained with a solar radiometer Journal of Geophysical Research., 33 3251-3254. equation to include soluble trace gases and slightly soluble substances, J. Atmos. Sci., 55, 853–862. Li, W.F, Bai, Z.P., Liu, A.X., Chen, J. and Chen, L. (2009): Characteristics of Major PM2.5 Components during Winter in Tianjin, China. Aerosol Air Qual. Res., 9: 105–119. Liou, K. N (2002): An introduction to Atmospheric Radiation 2nd ed. Academic, San Diego, California. Liu, P. F., Zhao, C. S., Gobel, T., Hallbauer, E., Nowak, A., Ran, L., Xu, W. Y., Deng, Z. Z., Ma, N., Milderger, K., Henning, S., Stratmann, F., and Wiedensohler, A. (2011): Hygroscopic Properties of Aerosol Particles at High Relative Humidity and their Diurnal Variations in the North China Plain, Atm. Chem. Phys., Discuss., 11, 2991-3040. Meyer, N. K., Duplissy, J., Gysel, M., Metzger, A., Dommen, J., Weingartner, E., Alfarra, M. R., Prevot, A. S. H., Fletcher, C., Good, N., McFiggans, G., Jonsson, A. M., Hallquist, M., Baltensperger, U., and Ristovski, Z. D. (2009): Analysis of the hygroscopic and volatile properties of ammonium sulphate seeded and unseeded SOA particles, Atmos. Chem. Phys., 9, 721–732, doi:10.5194/acp-9-721-2009. O’Neill, N. T and Royer, A (1993): Extraction of binomial aerosol-size distribution Radii from spectral and angular slope (Ångström) coefficients Appl. Opt. 32 1642-1645 Petters, M. D. and Kreidenweis, S. M. (2007): A single parameter representation of hygroscopic growth and cloud condensation nucleus activity, Atmos. Chem. Phys., 7, 1961–1971, doi:10.5194/acp-7- 1961-2007. Putaud, J.P. (2012): Aerosol hygroscopicity at Ispra EMEP-GAW station by M. Adam et al., Atmos. Chem. Phys. Discuss., 12, C1316–C1322 Randles, C. A., Russell, L. M., and Ramaswamy, V. (2004): Hygroscopic and optical properties of organic sea salt aerosol and consequences for climate forcing, Geographical Research Letters., Vol. 31, LI6108, doi: 10, 1029/2004GL020628. Ranjan, R. R., Joshi, H. P and Iyer, K. N (2007): Spectral variation of total column aerosol optical depth over Rajkot: A tropical semi-arid India Station. Aerosol and Air Quality Research 7 33-45 Russell, L.M and Ming, Y. (2002): Deliquescence of small particles. J Atm. Chem Phys 116:311–321. doi:10.1063/1.1420727 Seinfeld, J. H. and Pandis, S. N. (2006): Atmospheric Chemistry and Physics: From Air Pollution to Climate Change, John Wiley and Sons, Inc., New York. Shen, Z.X., Cao, J.J, Tong, Z., Liu, S.X., Reddy, L.S.S., Han, Y.M, Zhang, T. and Zhou, J. (2009): Chemical Characteristics of Submicron Particles in Winter in Xi’an. Aerosol Air Qual. Res. 9: 80–93. Sjogren, S., Gysel, M., Weingartner, E., Baltensperger, U., Cubison, M. J., Coe, H., Zardini, A. A., Marcolli, C., Krieger, U. K., and Peter, T. (2007): Hygroscopic growth and water uptake kinetics of two-phase aerosol particles consisting of ammonium sulfate, adipic and humic acid mixtures, J. Aerosol Sci., 38, 157–171, doi:10.1016/j.jaerosci.2006.11.005. Stock, M., Cheng, Y. F. Birmili, W., Massling, A., Wehner, B., Muller, T., Leinert, S., Kalivitis, N., Mihalopoulos, N., and Wiedensohler. A. (2011): Atmos. Chem. Phys., 11, 4251–4271, www.atmos-chemphys. net/11/4251/2011/ doi:10.5194/acp-114251-2011 Stokes, R. H., and Robinson, R. A. (1966): Interactions in aqueous nonelectrolyte solutions. I. Solute solvent equilibria, J. Phys. Chem., 70, 2126–2130. Tijjani, B. I and Uba, S. (2013): The effect of hygroscopic growth on desert aerosols, Pelagia Research Library., 4(4), 165-178. Swietlicki, E., Zhou, J., Covert, D. S., Hameri, K., Busch, B., Vakeva, M., Dusek, U., Berg, O. H.,Wiedensohler, A., Aalto, P., Makela, J., Marinsson, B. G., Papaspiropoulos, G., Mentes, B., Frank, G. and Stratch. F.( 2000):Hygroscopic properties of aerosol particles in the north-eastern Atlantic during ACE-2.Tellus 52B, 201–227. Swietlicki, E., Hansson, H.-C., H¨ameri, K., Svenningsson, B., Massling, A., McFiggans, G., McMurry, P. H., Petӓjӓ, T., Tunved, P., Gysel, M., Topping, D., Weingartner, E., Baltensperger, U., Rissler, J., Wiedensohler, A., and Kulmala, M. (2008): Hygroscopic properties of submicrometer atmospheric aerosol particles measured with H-TDMA instruments in various environments 10 – a review, Tellus B, 60(3), 432–469,. 6892, 6898, 6906, 6909 www.theijes.com The IJES Page 79